Documentation Revision Date: 2018-10-29
Data Set Version: 1
Summary
There are five *.csv files provided with this dataset.
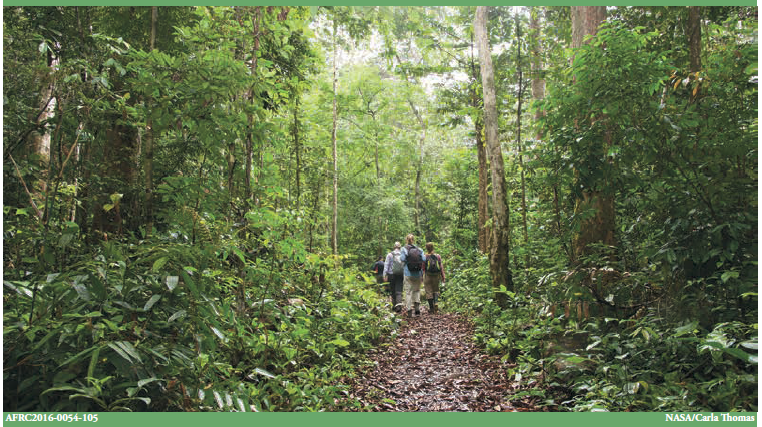
Figure 1: Collecting field data in Mondah Forest, Gabon. Credit: Carla Thomas/NASA (2016).
Citation
Fatoyinbo, T., S.S. Saatchi, J. Armston, J. Poulsen, S. Marselis, N. Pinto, L. Duncanson, L.J.T. White, and K. Jeffery. 2018. AfriSAR: Mondah Forest Tree Species, Biophysical, and Biomass Data, Gabon, 2016. ORNL DAAC, Oak Ridge, Tennessee, USA. https://doi.org/10.3334/ORNLDAAC/1580
Table of Contents
- Data Set Overview
- Data Characteristics
- Application and Derivation
- Quality Assessment
- Data Acquisition, Materials, and Methods
- Data Access
- References
Data Set Overview
This dataset provides (1) plot-level estimates of basal area, aboveground biomass, number of trees, maximum tree height, and basal-area-weighted wood specific gravity that were derived from (2) observations of nearly 6,700 individual trees including tree family, species, DBH, the height of each tree, and their x,y location within 25 x 25 m subplots. These field data were collected from 15 1-hectare plots located across the Mondah Forest of Gabon as part of the AfriSAR Campaign in 2016. These biophysical and biomass data were used for training the above ground biomass prediction models for the AfriSAR LVIS remote sensing above ground biomass density products.
Project: AfriSAR
The AfriSAR mission was an airborne campaign that collected radar and field measurements of tropical forests in Gabon, West Africa. The mission was a NASA collaboration with the European Space Agency (ESA) and the Gabonese Space Agency. During the 2016 AfriSAR campaign, NASA UAVSAR and LVIS instruments collected data that will be used to derive forest canopy height, structure, and topography. The AfriSAR data is a precursor to upcoming spaceborne missions that examine the role of forests in Earth's carbon cycle.
Acknowledgements:
Thanks to Christelle Tayo, Vincent Medjibe and the Agence Nationale des Parcs Nationaux in Gabon (ANPN) National Resource Inventory Team for helping with the collection of the field data. Thanks to ANPN for helping with field permitting and research in the country. Many thanks to Nicolas Labriere, Victoria Meyer and the ForestPlots Team for helping with species ID and dataset cleanup. This data collection was funded through the NASA AfriSAR project.
Data Characteristics
Spatial Coverage: Mondah Forest, Gabon
Spatial Resolution: 0.0625 - 1.0 ha plots
Temporal Coverage: 2016-03-01 to 2016-03-23
Temporal Resolution: One-time measurements
Study Area (coordinates in decimal degrees)
| Site | Westernmost Longitude | Easternmost Longitude | Northernmost Latitude | Southernmost Latitude |
|---|---|---|---|---|
| Mondah Forest, Gabon | 9.316216 | 9.422509 | 0.616939 | 0.538705 |
Data File Information
There are five *.csv files provided with this dataset. Note that the three plot-level files have the same structure.
| Data File | Description |
|---|---|
| Mondah_Field_Data_Trees.csv | Individual tree observations were collected at the 25 m x 25 m, or 0.0625 ha subplot level. |
| Mondah_Field_Data_Plot-0_0625ha.csv | Vegetation characteristics and estimates of biomass at 25 m x 25 m, or 0.0625 ha plot-level |
| Mondah_Field_Data_Plot-0_25ha.csv | Vegetation characteristics and estimates of biomass aggregated to 50 m x 50 m, or 0.25 ha plot-level |
| Mondah_Field_Data_Plot-1ha.csv | Vegetation characteristics and estimates of biomass aggregated to 100 m x 100 m, or 1 ha plot-level |
| Mondah_Field_Data_OrigCoords.csv | The original field Global Positioning System (GPS) coordinates of each plot are also provided at the 0.0625 ha subplot level (GPS Coordinates). |
Missing values for field data:
A value of -9999 means invalid data for numeric fields. For character fields the code for invalid data is “NA”. Zero, "0", is always a valid value.
Data Dictionary
Table 1. The tree data file (*_Tree) contains the following columns with accompanying information.
| Column Name | Variable Type | Units/format | Description |
|---|---|---|---|
| plot | chr | name of the plot in which tree is located | |
| subplot | num | number of the subplot in which the tree is located, assuming subplots of 25x25 m | |
| tree_date | date | yyyy-mm-dd | date when the tree was measured |
| family | chr | taxonomic family to which the tree belongs | |
| species | chr | tree species name | |
| wsg | num | g/cm3 | wood specific gravity, derived with the BIOMASS package in R, based on the species, genus and/or family of the tree |
| tree | num | tag of the tree in the field | |
| stem | num | number of the stem, if tree splits below breast height (1.3 m) the tree is considered to have multiple stems indicated in this column with a number | |
| epsg | num | epsg code of the projection in which the x and y coordinate are expressed | |
| x | num | m | the x coordinate of the tree location. Easting coordinate in the map projection (see epsg field) |
| y | num | m | the y coordinate of the tree location. Northing coordinate in the map projection (see epsg field) |
| status | num | tree status alive (1) or dead (0) | |
| allom_key | num | indication of the allometry used to estimate biomass. 1 = use of pan-tropical allometric equation from Chave et al. 2014 if height measurement is absent, 2 = use of the pantropical allometric equation published in Chave et al. 2014 with real or modeled height. | |
| a_stem | num | m2 | area of the stem at breast height, calculated from d.stem |
| h_t | num | m | measured height of the tree |
| h_t_mod | num | m | tree heights modelled using local or regional DBH-Ht relationship |
| d_stem | num | m | diameter of stem at measurement height |
| d_stem.valid | num | valid (1) or invalid (0) tree measurement | |
| d_ht | num | m | height at which the stem diameter was measured |
| m_agb | num |
mass of above-ground components of tree (kg) estimated with Chave et al. 2014 allometric equation |
Table 2. Each of the three plot-level data files (*_Plot-1ha, *_Plot-0.25ha, and *_Plot-0.0625ha) contain the following columns.
| Column Name | Variable Type | Units/format | Description |
|---|---|---|---|
| plot | chr | name of the plot | |
| subplot | num | number of the subplot, provides unique identifier together with the plot name | |
| date | date | yyyy-mm-dd | date when the plot data was collected |
| vegetation | chr | type of vegetation (TropRF = Tropical Rain Forest) | |
| map | num | mean annual precipitation (mm), derived from worldclim global climate data (worldclim.org) database | |
| mat | num | mean annual temperature (Celsius), derived from worldclim global climatedata (worldclim.org) database | |
| pft_name | chr | name of the plant functional type this vegetation is part of | |
| latitude | num | latitude of location where sampled (-90 to 90 deg South to North) | |
| longitude | num | longitude of location where sampled (-180 to 180 West to East) | |
| p_origin | chr | origin of the plot for which longitude/latitude are provided, C=center | |
| p_orientation | num | degrees | orientation of the plot in degrees clockwise from UTM map grid north |
| p_shape | chr | shape of the plot (R=rectangular) | |
| p_majoraxis | num | m | length of the longest axis of the plot |
| p_minoraxis | num | m | length of the minor axis of the plot |
| p_geom | chr | wkt containing geometry of the plot | |
| p_epsg | num | epsg indicating the projection of the plot geometry | |
| p_area | num | m2 | area of the plot |
| p_mindiam | num | minimum diameter of trees measured in the field | |
| sp_ix | num | subplot column index. Each plot is divided into a number of columns and rows using the subplot information, the number being dependent on the spatial resolution of the output biomass values. Sp.ix are the column numbers, left to right. See Figure 2. | |
| sp_iy | num | subplot row index. Each plot is divided into a number of columns and rows using the subplot information, the number being dependent on the spatial resolution of the output biomass values. Sp.iy are the row number, top to bottom. See Figure 2. | |
| dft | chr | dominant plant functional type: EA = evergreen angiosperm, DG = deciduous gymnosperm | |
| agb | num | kg | total above ground biomass in this plot |
| agb_valid | num | valid (1) or invalid (0) agb value | |
| agb_lower | num | kg | lower limit of standard error of mass of above-ground standing trees and shrubs |
| agb_upper | num | kg | upper limit of standard error of mass of above-ground standing trees and shrubs |
| agbd_ha | num | Mg/ha | mass density of above-ground standing trees and shrubs |
| agbd_ha_lower | num | Mg/ha | lower limit of standard error of mass density of above-ground standing trees and shrubs |
| agbd_ha_upper | num | Mg/ha | upper limit of standard error of mass density of above-ground standing trees and shrubs |
| sn | num | number of stems in plot | |
| snd_ha | num | plot stem number density | |
| sba | num | m2 | plot stand basal area |
| sba_ha | num | m2/ha | stand basal area per ha based on sba and plot size |
| swsg_ba | num | g/cm3/m2 | basal-area-weighted wood specific gravity |
| h_t_max | num | m | maximum total height of plants from ground to highest leaf |
Table 3. The data file with the original plot coordinates (*_OrigCoords) is organized as follows. See processing description below and note about limited usability.
| Column Name | Variable Type | Units/format | Description |
|---|---|---|---|
| Date | date | date when plot coordinates were collected | |
| Name | chr | plot name | |
| Altitude | chr | m | plot altitude, measured by GPS |
| Coordinate | chr | coordinate identifier of the plot | |
| Latitude | chr | latitude coordinate expressed in degree, minute, second (e.g. 00,35076° = 00° 35' 07.6) | |
| Longitude | chr | Longitude coordinate expressed in degree, minute, second (e.g. 09,20264° = 09° 20' 26.4) | |
| Precision | num | m | GPS coordinate precision |
Application and Derivation
These data were used for training the above ground biomass prediction models for the AfriSAR LVIS above ground biomass density product.
Quality Assessment
For each plot level aboveground biomass value we calculated the upper and lower limits of standard error of mass of above-ground standing trees and shrubs. These estimates are included in the data files.
Data Acquisition, Materials, and Methods
These field data were collected from 15 1-hectare plots located across the Mondah Forest of Gabon as part of the AfriSAR Campaign in 2016 (Figure 2). These biophysical and biomass data will be used for training the above ground biomass prediction models for the AfriSAR LVIS remote sensing above ground biomass density products.
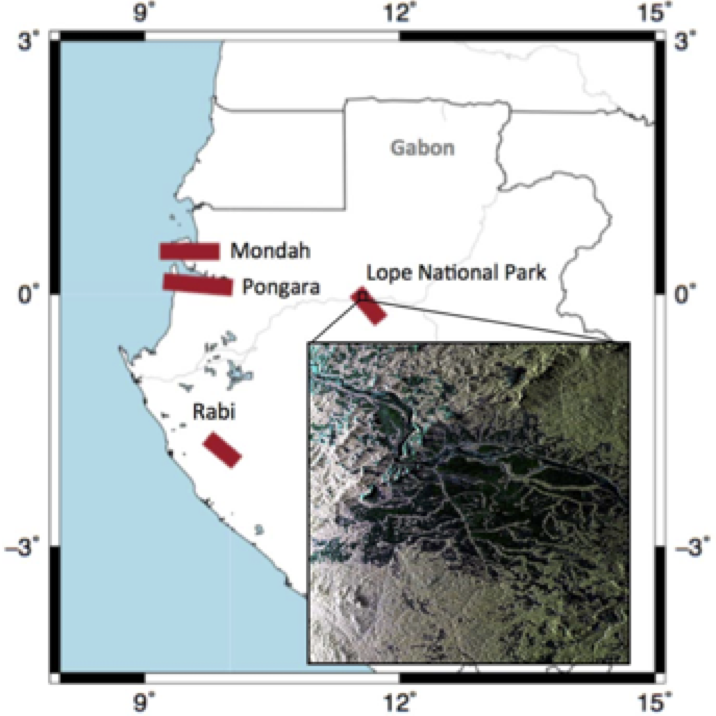
Figure 2. Showing the sampling locations in the coastal Mondah Forest of Gabon (Lavelle et al. 2017)
Individual trees were observed in 0.0625 ha subplots and plot-level data estimates were aggregated at 0.0625, 0.25, and 1 ha spatial resolutions. See Figure 3.
Individual Tree Measurements
For each 0.0625 ha subplot the data covers: GPS location of the 4 corners, x,y location of trees within a subplot, measurements of live tree family, species, DBH, height of each tree, and biomass at individual tree and plot level. Data file: Mondah_Field_Data_Trees.csv. Family and species of each tree was determined by a local botanist. DBH is the Diameter at Breast Height measured with a diameter measurement tape at 1.3 m height. Tree height measured in the field with DBH meter and a clinometer. Biomass of each tree is estimated using the Chave et al. 2014 equation with tree diameter, wood specific gravity (defined by tree species) and tree height. From the biomass of each individual tree, the biomass at plot level was calculated by adding the biomass of every tree within the 1 ha plot boundaries.
Aggregated Plot-level Estimates
At each plot level we calculated basal area, aboveground biomass, number of trees per plot, maximum tree height, and basal-area-weighted wood specific gravity. Respective aggregated data files: Mondah_Field_Data_Plot-0.0625ha.csv, Mondah_Field_Data_Plot-0.25ha.csv, and Mondah_Field_Data_Plot-1ha.csv. Biomass density information for different plot sizes was calculated by adding the biomass data for each individual tree within the boundaries of a certain subplot and divide by the area of that subplot to calculate biomass density for each subplot.
Figure 3. Spatial arrangement of subplots (from left to right) for 1 ha (Plot-1ha), 0.25 ha (Plot-0.25ha), and 0.0625 ha (Plot-0.0625ha) spatial resolutions. The reconstructed stem map is shown on the right.
Original GPS Coordinates
The original field Global Positioning System (GPS) coordinates of each plot are also provided at the 0.0625 ha subplot level (Mondah_Field_Data_OrigCoords.csv). Note that geolocation errors from the GPS measurements caused the measured points to not create perfect squares. These points have been adjusted to create the weighted best plot locations which are provided in the three plot-level measurement files. These original coordinates are not provided in decimal degrees to clearly denote their limited usefulness. They are included only for completeness of the data collection record. Plot altitude (elevation) maybe useful.
Data Access
These data are available through the Oak Ridge National Laboratory (ORNL) Distributed Active Archive Center (DAAC).
AfriSAR: Mondah Forest Tree Species, Biophysical, and Biomass Data, Gabon, 2016
Contact for Data Center Access Information:
- E-mail: uso@daac.ornl.gov
- Telephone: +1 (865) 241-3952
References
Chave, J. , Réjouâ-Méchain, M. , Búrquez, A. , Chidumayo, E. , Colgan, M. S., Delitti, W. B., Duque, A. , Eid, T. , Fearnside, P. M., Goodman, R. C., Henry, M. , Martínez-Yrízar, A. , Mugasha, W. A., Mullerâ-Landau, H. C., Mencuccini, M. , Nelson, B. W., Ngomanda, A., Nogueira, E. M., Ortiz-Malavassi, E. , Pélissier, R. , Ploton, P. , Ryan, C. M., Saldarriaga, J. G. and Vieilledent, G. (2014), Improved allometric models to estimate the aboveground biomass of tropical trees. Glob Change Biol, 20: 3177-3190. https://doi.org/10.1111/gcb.12629
T.E. Fatoyinbo, N. Pinto, M. Hofton, M. Simard, B. Blair, S. Saatchi, Y. Lou, R. Dubayah, S. Hensley, J. Armston, L. Duncanson, M. Lavalle. The 2016 NASA AfriSAR campaign: airborne SAR and Lidar measurements of tropical forest structure and biomass in support of future satellite missions. IEEE International Geoscience and Remote Sensing Symposium (July 23-28, 2017) (Fort Worth, Texas, USA, TH3.L9.1).
Lavalle, M., M. Simard, B. Riel, B. Hawkins, and N. Pinto. 2017. Tomographic imaging with UAVSAR: Current status and new results from the 2016 AfriSAR campaign. 2017 IEEE International Geoscience and Remote Sensing Symposium (IGARSS): 2485-2488.
NASA. 2016. The ARMSTRONG X-PRESS. AfriSAR: NASA Science Mission Measures Changes in the Gabon Environment. Volume 58, Number 5, May 2016. https://www.nasa.gov/sites/default/files/atoms/files/xpress_afrisar.pdf