Documentation Revision Date: 2018-10-29
Data Set Version: 1
Summary
There are 273 files in comma-delimited (*.csv) format included in this dataset.

Figure 1. LVIS waveforms were collected over this area at the edge of the Mondah Forest outside of Libreville, Gabon. (Photo Credit: Christian Vigna, April 13, 2013)
Citation
Tang, H., J. Armston, S. Hancock, M. Hofton, J.B. Blair, T. Fatoyinbo, and R.O. Dubayah. 2018. AfriSAR: Canopy Cover and Vertical Profile Metrics Derived from LVIS, Gabon, 2016. ORNL DAAC, Oak Ridge, Tennessee, USA. https://doi.org/10.3334/ORNLDAAC/1591
Table of Contents
- Data Set Overview
- Data Characteristics
- Application and Derivation
- Quality Assessment
- Data Acquisition, Materials, and Methods
- Data Access
- References
Data Set Overview
This dataset includes footprint-level canopy structure products derived from data collected using NASA's Land, Vegetation, and Ice Sensor (LVIS) during flights over five forested sites in Gabon during February and March 2016. Three types of canopy structure information are included for each flight: 1) vertical profiles of canopy cover fraction in 1-meter bins, 2) vertical profiles of plant area index (PAI) in 1-meter bins, and 3) footprint summary data of total recorded energy, leaf area index, canopy cover fraction, and vertical foliage profiles in 10-meter bins. Canopy structure metrics are provided for each waveform (20-m footprint) collected by the LVIS instrument. These data were collected by NASA as part of the AfriSAR project. AfriSAR is a NASA collaboration with the European Space Agency (ESA), German Aerospace Center (DLR), and the Gabonese Space Agency (AGEOS) that is collecting data useful for deriving forest canopy structure and will help prepare for and calibrate current and upcoming spaceborne missions that aim to gauge the role of forests in Earth's carbon cycle.
Project: AfriSAR
The AfriSAR mission was an airborne campaign that collected radar and field measurements of forests in Gabon, West Africa. The mission was a NASA collaboration with the European Space Agency (ESA) and the Gabonese Space Agency. During the 2016 AfriSAR campaign, NASA UAVSAR and LVIS instruments collected data that will be used to derive forest canopy height, structure, and topography. The AfriSAR data will help prepare for and calibrate current and upcoming spaceborne missions that aim to gauge the role of forests in Earth's carbon cycle.
Acknowledgements:
This data collection was funded through the NASA AfriSAR project.
Data Characteristics
Spatial Coverage: Forest sites in Gabon
Spatial Resolution: 20-m footprint
Temporal Coverage: 2016-02-20 to 2016-03-08
Temporal Resolution: The five sites were visited once each during five days in early 2016.
Study Area: (These coordinates are the approximate locations of the study sites and may not match the extent of the data files. All coordinates in decimal degrees.)
| Site | Dates | Northern Latitude | Southern Latitude | Western Longitude | Eastern Longitude |
|---|---|---|---|---|---|
| Mabounie | 2016-02-20 | 0.16455 | -0.99585 | 9.79035 | 10.793756 |
| Lope | 2016-03-02 | -0.018549 | -0.634119 | 11.2 | 12.013281 |
| Pongara Mondah | 2016-03-04 | 0.566658 | -0.039924 | 10.135744 | 9.187093 |
| Rabi | 2016-03-07 | 0.323587 | -2.291708 | 10.273923 | 9.52355 |
| Mondah2 | 2016-03-08 | 0.701451 | -1.047759 | 11.005249 | 8.727603 |
| Total Study Area | 2016-02-20 to 2016-03-08 | 0.701451 | -2.291708 | 9.79035 | 12.013281 |
Data File Information
There are a total of 273 files in CSV format in this dataset. The files contain the Level 2B data derived from waveform lidar data from NASA's Land, Vegetation, and Ice Sensor (LVIS) and are provided in sets of three for each flight and site:
- covz: Level 2B product with vertical profiles of canopy cover fraction for each LVIS shot with a range from 0 to 1 and vertical resolution of 1 meter.
- paiz: Level 2B product with vertical profile of Plant Area Index (PAI) for each LVIS shot with a vertical resolution of 1 meter.
- metrics: Level 2A product containing summary canopy structure metrics for each LVIS shot. These are used as input to the Level 3A gridded products.
File Naming Convention
The naming convention for the LVIS Level 2 footprint data files is outlined below:
lvis2_[where]_[date]_[level]_[variable]_[projection]_[version].csv
e.g. lvis2_038002_2016030820160308_l2a_metrics_e04326_v0100.csv
where:
lvis2 : Level 2 LVIS derived product
[where] : LVIS flightline ID
[date] : Product was generated from data collected between the two dates in YYYYMMDDYYYYMMDD format
[level] : l2a indicates a Level 2A product (metrics); and l2b indicates a Level 2B product (covz, paiz)
[variable] : indicates whether the file contains a summary of canopy structure metrics (metrics), the vertical profile of canopy cover fraction (covz), or the vertical profile of Plant Area Index (paiz)
[projection] : the EPSG code of the coordinate data
[version] : the data version
File Organization
All three types of footprint-level data files provide an index (lfid plus shotnumber) that uniquely identifies a row and footprint geolocation information (glat, glon) that together correspond to individual waveform records in the LVIS Level 1B and Level 2 products.
Canopy cover vertical profile (covz)
The covz product contains the canopy cover at 1-m intervals. Column headers indicate the the vertical interval represented by the column; e.g. cc_z0 refers to canopy cover fraction between 0- and 1-m, cc_z1 refers to canopy cover fraction between 1- and 2-m, etc.
Table 1. Column names and descriptions for canopy cover files (*_covz_e04326_v0100.csv)
| Column Name | Description |
|---|---|
| lfid | LVIS file identifier. Together with shotnumber indicate the unique identifier for every LVIS laser shot. Format is XXYYYYYZZZ where XX identifies instrument version, YYYYY is the Modified Julian Date of the flight departure day, ZZZ represents file number |
| shotnumber | LVIS shot number assigned during collection |
| glat | Latitude of the lowest detected mode within the waveform (degrees north) |
| glon | Longitude of the lowest detected mode within the waveform (degrees east) |
|
cc_z0,cc_z1, ... , cc_z69 |
Canopy cover fraction at 1-meter vertical intervals. Methods for deriving canopy cover metrics from waveform lidar footprints are described in more detail in Tang et al. (2012). |
Plant Area Index (PAI) vertical profile (paiz)
The paiz product contains the vertical PAI profile for each waveform measurement at a 1-m vertical interval; e.g. l_z0 refers to the PAI between 0- and 1-m, l_z1 refers to the PAI between 1- and 2-m, etc.
Table 2. Column names and descriptions for canopy cover files (*_paiz_e04326_v0100.csv)
| Column Name | Description |
|---|---|
| lfid | LVIS file identifier. Together with shotnumber indicate the unique identifier for every LVIS laser shot. Format is XXYYYYYZZZ where XX identifies instrument version, YYYYY is the Modified Julian Date of the flight departure day, ZZZ represents file number |
| shotnumber | LVIS shot number assigned during collection |
| glat | Latitude of the lowest detected mode within the waveform (degrees north) |
| glon | Longitude of the lowest detected mode within the waveform (degrees east) |
|
l_z0,l_z1, ... , l_z69 |
Leaf area index at 1-meter vertical intervals. Methods for deriving canopy cover metrics from waveform lidar footprints are described in more detail in Tang et al. (2012). |
Footprint Summary (metrics)
The metrics footprint-level product contains the total recorded energy from vegetation (totwave) and the ground (groundtot), plant area index (labeled LAI in the data files), canopy cover fraction (ccover), vertical foliage profile by 10-m height interval (vfp00, vfp10, vfp20, and vfp30), and the foliage height diversity (fhd). Columns err_rg and err_cov represent the ground fitting error and the associated error in canopy cover estimation, respectively. Methods for deriving canopy cover metrics from waveform lidar footprints are described in more detail in Tang et al. (2012).
Table 3. Column names and descriptions for canopy cover files (*_metrics_e04326_v0100.csv)
| Column Name | Description |
|---|---|
| lfid | LVIS file identifier. Together with shotnumber indicate the unique identifier for every LVIS laser shot. Format is XXYYYYYZZZ where XX identifies instrument version, YYYYY is the Modified Julian Date of the flight departure day, ZZZ represents file number |
| shotnumber | LVIS shot number assigned during collection |
| glat | Latitude of the lowest detected mode within the waveform (degrees north) |
| glon | Longitude of the lowest detected mode within the waveform (degrees east) |
| totwave | Total laser energy reflected from vegetation |
| groundtot | Total laser energy reflected from ground, estimated from an Exponential Gaussian fitting algorithm |
| LAI | One half of the total plant area projected per unit ground surface. Assumes LAI represents all plant material within a footprint and no clumping effect. Column named "LAI" but is really value for "plant area index (PAI)". |
| ccover | Canopy cover fraction in the laser illuminated footprint |
| vfp00 | Integration of vertical foliage profile from ground to 10-m height AGL |
| vfp10 | Integration of vertical foliage profile from 10- to 20-m height AGL |
| vfp20 | Integration of vertical foliage profile from 20- to 30-m height AGL |
| vfp30 | Integration of vertical foliage profile from 30- to 40-m height AGL |
| fhd | Foliage height diversity |
| err_rg | Uncertainty in ground energy estimates (see Section 4) |
| err_cov | Uncertainty in canopy cover fraction estimates (see Section 4) |
Application and Derivation
This dataset provides accurate vertical profiles of PAI and canopy cover generated from data collected by a large footprint waveform lidar instrument. Foliage at different height intervals contributes differently towards total photosynthesis and canopy carbon storage. Vertical variation in PAI and canopy cover are informative metrics for examining the relationships between foliage-height profiles and energy, water, and nutrient flows. These data will help prepare for and calibrate current and upcoming spaceborne missions that aim to gauge the role of forests in Earth's carbon cycle.
Quality Assessment
An initial quality check of the source data detected minor errors in the ground elevation or the top of canopy height. It is recommended that users review the Level 1B waveforms for their specific study areas to verify that ground return and canopy top identification seem reasonable. Level 1B data are available from the LVIS website:
https://lvis.gsfc.nasa.gov/Data/Maps/Gabon2016Map.html
Horizontal geolocation accuracy is estimated at around 1 meter and the vertical accuracy of the geolocated waveforms is between 5 to 10 cm.
The uncertainty of the dataset is characterized by two attributes for each individual footprint, including ground fitting error (ERR_RG) and the associated error in canopy cover estimation (ERR_COV). The ERR_RG is calculated by doubling the total difference between the algorithm-fitted ground distribution and raw measurement of LVIS waveform for the below ground range. The ERR_COV is calculated by propagating ERR_RG with basic lidar-canopy-gap equations. This error calculation is described in more detail in Tang et al. (2012).
Data Acquisition, Materials, and Methods
Study Sites
Gabon's forest is part of the Congolian tropical forests, altogether the second largest rainforest in the world after the Amazon. About 85 percent of the country's land is forested. The forests in Gabon are inhabited by a wide variety of plants and animals and are largely undisturbed by human activity. The Pongara National Park and Lope National Park sites contain extensive mangrove and inland forest coverage, respectively, and a wide range of forest canopy heights up to 50 m. Mondah Forest, in northwest Gabon, is a partially flooded area containing mangrove and mahogany woodlands. Its proximity to Gabon's capital of Libreville has placed the forest under environmental pressure, and some areas have been cleared for agriculture. The Rabi site is a 25-hectare permanent forest monitoring plot established as part of the Smithsonian Institution of Global Earth Observatories (SIGEO) world-wide network of forest plots. Close proximity to oil fields and commercial logging activity are a strain on biodiversity.
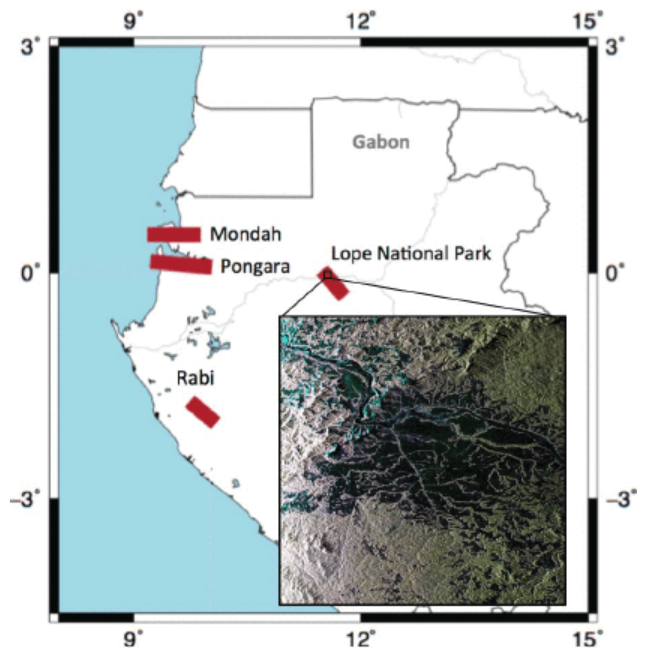
Figure 2. Study sites where LVIS data were acquired during the 2016 AfriSAR airborne campaign (Lavelle et al. 2017)
LVIS Instrument
NASA's Land, Vegetation, and Ice Sensor or "LVIS", is an airborne, wide-swath imaging laser altimeter system that is flown over target areas to collect data on surface topography and 3-d structure. Utilizing a system that includes a 1064 nm-wavelength laser and 3 detectors, the entire time history of the outgoing and return pulses is digitized, allowing unambiguous determination of range and return pulse structure. Combined with aircraft position and attitude knowledge, the sensor produces topographic maps with dm accuracy and vertical height and structure measurements of overflown terrain, e.g., vegetation and ice.
Data Acquisition and Processing
In February and March of 2016, NASA's Land Vegetation and Ice Sensor (LVIS) system was flown over selected sites in Gabon for the AfriSAR project, a joint campaign between NASA, ESA, DLR, and AGEOS. LVIS was mounted on the NASA Langley B-200 aircraft and flown at ~24,000 ft over selected sites. The LVIS instrument has a nominal swath width of 1.5 km and footprint diameter of 18 m.
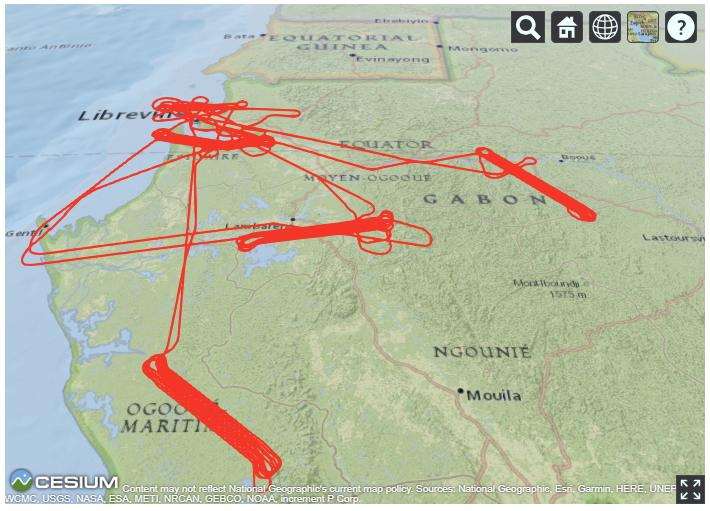
Figure 3. Flight lines over the five sampled ecological areas across Gabon. The centrally located Mabounie site is not shown in Figure 2. (Source: https://lvis.gsfc.nasa.gov/Data/Maps/Gabon2016Map.html#DataTraj)
The Level 2B products included in this dataset contains footprint-level vegetation canopy metrics derived from the Level 1B geolocated laser return waveforms. For this release, returns that were not believed to have penetrated through to the ground (due to clouds, fog, etc.) were filtered out. Waveforms were interpreted by setting thresholds above which electronic and optical noise was filtered out of the LIDAR returns such that weak signals could be detected. Example waveforms captured by the LVIS sensor over vegetated and non-vegetated areas are depicted in Figures 2 and 3.
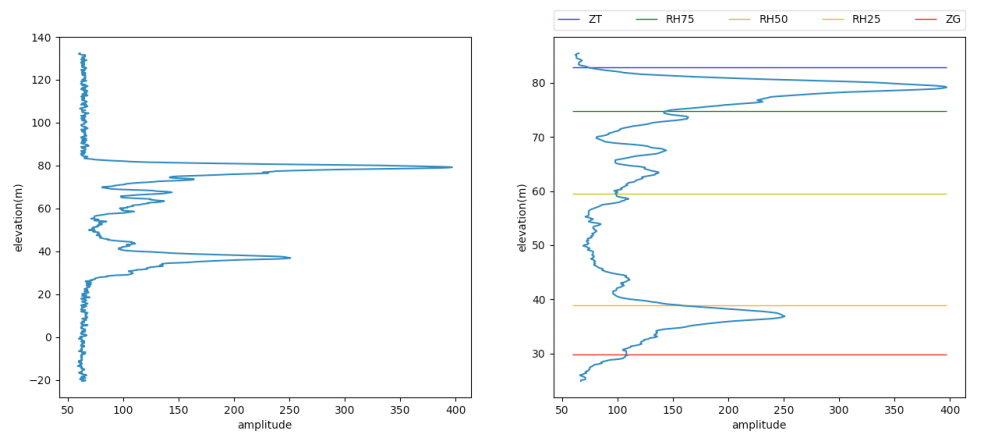
Figure 4. Example LVIS waveform vegetated area
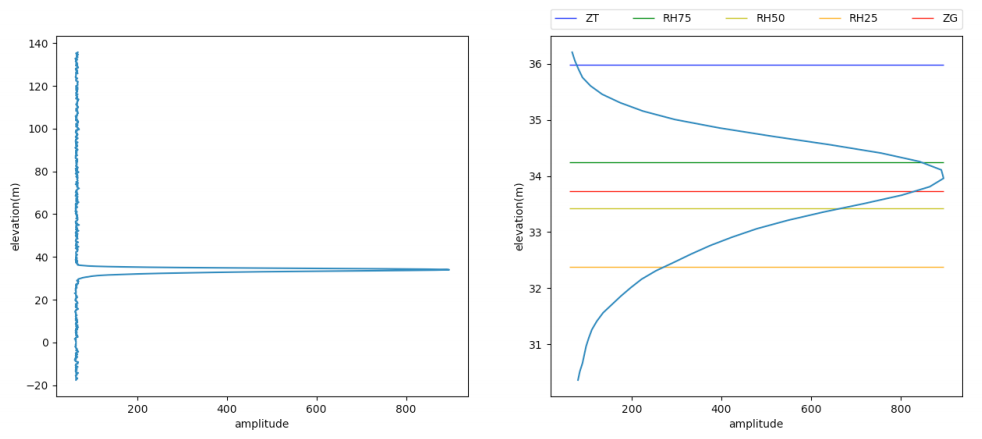
Figure 5. Example LVIS waveform over road
Plant area index (PAI) and canopy cover fraction (CCF) profiles were calculated using a model based on gap theory which quantifies the relationship between PAI and the gap frequency for horizontally homogenous canopy layers. These methods for deriving canopy cover metrics from waveform lidar footprints are described in more detail in Tang et al. (2012) where they were applied to data collected by the Geoscience Laser Altimeter System (GLAS; aboard ICESat) over the La Selva Biological Station in Costa Rica.
Note: Interpreting waveforms is partially a statistical process. Thresholds are set to differentiate between weak signals and electronic and optical noise. As such, there will be some (small) percentage of the data that have been misinterpreted. An initial quality check of the data was performed to remove obvious errors, but there will be some small percentage of the data that have some error in the ground elevation or the canopy top height.
Data Access
These data are available through the Oak Ridge National Laboratory (ORNL) Distributed Active Archive Center (DAAC).
AfriSAR: Canopy Cover and Vertical Profile Metrics Derived from LVIS, Gabon, 2016
Contact for Data Center Access Information:
- E-mail: uso@daac.ornl.gov
- Telephone: +1 (865) 241-3952
References
Lavalle, M., M. Simard, B. Riel, B. Hawkins, and N. Pinto. 2017. Tomographic imaging with UAVSAR: Current status and new results from the 2016 AfriSAR campaign. 2017 IEEE International Geoscience and Remote Sensing Symposium (IGARSS): 2485-2488.
Tang, H., R. Dubayah, A. Swatantran, M. Hofton, S. Sheldon, D.B. Clark, and B. Blair. 2012. Retrieval of vertical LAI profiles over tropical rain forests using waveform lidar at La Selva, Costa Rica. Remote Sensing of Environment 124: 242-250 https://dx.doi.org/10.1016/j.rse.2014.08.007.