Documentation Revision Date: 2022-04-25
Dataset Version: 1
Summary
ACT-America's overall mission spanned five years and included field campaigns covering all four seasons over central and eastern regions of the United States. ACT-America's objectives were to study the transport and fluxes of atmospheric CO2 and CH4. Two instrumented aircraft platforms, the NASA Langley Beechcraft B-200 King Air and the NASA Wallops Flight Facility's C-130 Hercules, were used to collect high-quality in situ measurements across a variety of continental surfaces and atmospheric conditions. At times they flew directly under Orbiting Carbon Observatory-2 (OCO-2) overpasses to evaluate the ability of OCO-2 to observe high-resolution atmospheric CO2 variations. The C-130 aircraft was also equipped with active remote sensing instruments for planetary boundary layer height detection and column greenhouse gas measurements.
There are 296 data files in netCDF (*.nc) format included in this dataset. Also included are two companion files in Portable Document Format (*.pdf).
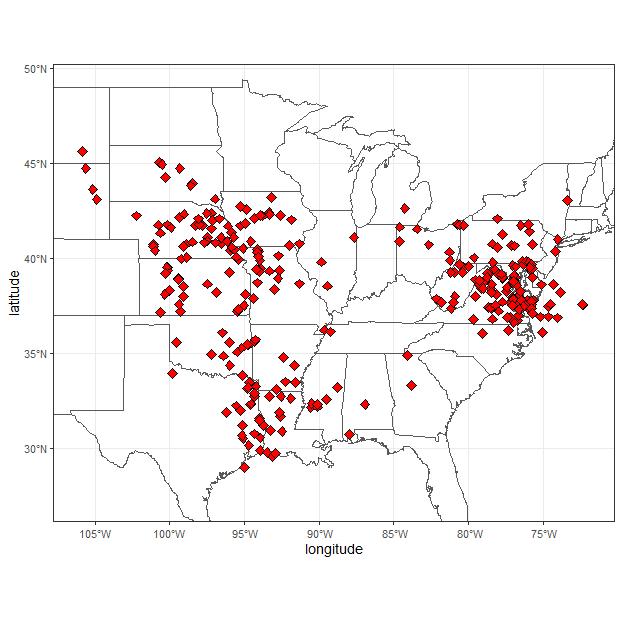
Figure 1. Locations of ACT-America flights collecting MFLL carbon dioxide (CO2) measurements over eastern and central U.S. in 2016-2018.
Citation
Lin, B., J.F. Campbell, J. Dobler, E.V. Browell, S.A. Kooi, S. Pal, T. Fan, W. Erxleben, D. Mcgregor, M.D. Obland, and C. O'Dell. 2022. ACT-America: L2 Weighting Functions for Airborne Lidar Column-avg CO2, Eastern USA. ORNL DAAC, Oak Ridge, Tennessee, USA. https://doi.org/10.3334/ORNLDAAC/1891
Table of Contents
- Dataset Overview
- Data Characteristics
- Application and Derivation
- Quality Assessment
- Data Acquisition, Materials, and Methods
- Data Access
- References
Dataset Overview
This dataset provides vertical weighting function coefficients of the Level 2 (L2) remotely sensed column-average carbon dioxide (CO2) concentrations measured during airborne campaigns in Summer 2016, Winter 2017, Fall 2017, and Spring 2018 conducted over central and eastern regions of the U.S. for the Atmospheric Carbon and Transport (ACT-America) project. Column-average CO2 concentrations were measured at a 0.1-second frequency during flights of the C-130 Hercules aircraft at altitudes up to 8 km with a Multi-functional Fiber Laser Lidar (MFLL; Harris Corporation). The MFLL is a set of Continuous-Wave (CW) lidar instruments consisting of an intensity-modulated multi-frequency single-beam synchronous-detection Laser Absorption Spectrometer (LAS) operating at 1571 nm for measuring the column amount of CO2 number density and range between the aircraft and the surface or to cloud tops, and surface reflectance and a Pseudo-random Noise (PN) altimeter at 1596 nm for measuring the path length from the aircraft to the scattering surface and/or cloud tops. The MFLL was onboard all ACT-America seasonal campaigns, except Summer 2019. The MFLL-measured column-averaged CO2 values have certain distinct vertical weights on CO2 profiles depending on the meteorological conditions and the wavelengths used at the measurement time and location. This product includes the instrument location at the time of measurement in geographic coordinates and altitude, along with a vector of weighting function values representing conditions along the nadir direction.
ACT-America's overall mission spanned five years and included field campaigns covering all four seasons over central and eastern regions of the United States. ACT-America's objectives were to study the transport and fluxes of atmospheric CO2 and CH4. Two instrumented aircraft platforms, the NASA Langley Beechcraft B-200 King Air and the NASA Wallops Flight Facility's C-130 Hercules, were used to collect high-quality in situ measurements across a variety of continental surfaces and atmospheric conditions. At times they flew directly under Orbiting Carbon Observatory-2 (OCO-2) overpasses to evaluate the ability of OCO-2 to observe high-resolution atmospheric CO2 variations. The C-130 aircraft was also equipped with active remote sensing instruments for planetary boundary layer height detection and column greenhouse gas measurements.
Project: Atmospheric Carbon and Transport - America
The Atmospheric Carbon and Transport - America (ACT-America) project is a NASA Earth Venture Suborbital-2 mission to study the transport and fluxes of atmospheric carbon dioxide and methane across three regions in the eastern United States. Flight campaigns measured transport of greenhouse gases by continental-scale weather systems. Ground-based measurements of greenhouse gases were also collected. Project goals include better estimates of greenhouse gas sources and sinks which are required for climate management and for prediction of future climate.
Related Datasets
Lin, B., J.F. Campbell, J. Dobler, E.V. Browell, S.A. Kooi, S. Pal, T. Fan, W. Erxleben, D. Mcgregor, M.D. Obland, and C. O'Dell. 2018. ACT-America: L2 Remotely Sensed Column-average CO2 by Airborne Lidar, Eastern USA. ORNL DAAC, Oak Ridge, Tennessee, USA. https://doi.org/10.3334/ORNLDAAC/1649.
Lin, B., J.F. Campbell, J. Dobler, E.V. Browell, S.A. Kooi, S. Pal, T. Fan, W. Erxleben, D. Mcgregor, M.D. Obland, and C. O'Dell. 2020. ACT-America: L1 Remotely Sensed Column-average CO2 by Airborne Lidar, Eastern USA. ORNL DAAC, Oak Ridge, Tennessee, USA. https://doi.org/10.3334/ORNLDAAC/1817.
Lin, B., J.F. Campbell, J. Dobler, E.V. Browell, S.A. Kooi, S. Pal, T. Fan, W. Erxleben, D. Mcgregor, M.D. Obland, and C. O'Dell. 2021. ACT-America: L2 Column-avg CO2 by Airborne Lidar, Eastern US, MFLL Lite, 2016-2018. ORNL DAAC, Oak Ridge, Tennessee, USA. https://doi.org/10.3334/ORNLDAAC/1892
Acknowledgments
This project was funded by NASA's ACT-America program (grant NNX15AG76G).
Data Characteristics
Spatial Coverage: flights over the eastern and central United States
Spatial Resolution: nominal 1.3 km, point measurements along C-130 flight tracks
Temporal Coverage: 2016-05-27 to 2018-05-20
Temporal Resolution: 10 seconds
Study Area: Latitude and longitude are given in decimal degrees.
| Site | Westernmost Longitude | Easternmost Longitude | Northernmost Latitude | Southernmost Latitude |
|---|---|---|---|---|
| Eastern and central U.S. | -106.0535 | -71.9109 | 49.1083 | 27.2303 |
Data File Information
There are 296 data files in netCDF (*.nc) format included in this dataset. Also included are two companion files in Portable Document Format (*.pdf).
The files are named ACTAmerica-MFLL-WeightingFn_C130_YYYY-MM-DDTHHmmSS_R#.nc (e.g., ACTAmerica-MFLL-Lite-lev2_C130_2016-05-27T145325_R0.nc), where YYYY-MM-DDTHHmmSS is the flight start date and time (UTC) and R# is the data revision number. A higher number indicates a more recent revision.
Table 1. File names and descriptions.
| File Name | Description |
|---|---|
| Data Files | |
| ACTAmerica-MFLL-WeightingFn_C130_YYYY-MM-DDTHHmmSS_R#.nc | normalized weighting function values (coefficients) for vertical profiles of atmospheric CO2 measurements; there are two dimensions: time, which indexes the sample locations, and v_profile, which indexes 30 m intervals along the nadir direction from the instrument |
| Companion Files | |
| ACTAmerica-MFLL-WeightingFn_C130_Readme_R0.pdf | details about MFLL instrument and methods for calculating XCO2 measurements with normalized weighting functions |
| MFLL_CO2_Weighting_Functions.pdf | a PDF version of this user guide |
Data File Details
Missing values are represented by -9999. Locations are provided in geographic coordinates.
Table 2. Variable names and descriptions.
| Variable | Units | Description |
|---|---|---|
| Weighting_Pressure | 1 | Normalized weighting function values calculated from air pressure coordinate for individual vertical profiles at flight tracks |
| Range_nadir | m | The range from the instrument onboard the C-130 aircraft to the backscatter in nadir direction |
| Latitude | degree_north | Latitude in decimal degrees |
| Longitude | degree_east | Longitude in decimal degrees |
| GPS_Altitude | m | Aircraft altitude measured by global positioning system |
| time | s | Time in seconds since 1970-01-01 00:00:00 UTC |
| v_profile | 1 | Index of weighting_pressure values in 30 m intervals along nadir range. The number of values is (Range_nadir divided by 30) + 1 |
User Notes
The time variable does not increase monotonically along the flight path. Gaps exist for segments of the flight when measurements were not being recorded. Refer to the time variable units "seconds since 1970-01-01 00:00:00 UTC".
Application and Derivation
ACT-America, or Atmospheric Carbon and Transport - America, conducted five airborne campaigns across three regions in the eastern United States to study the transport and fluxes of atmospheric carbon. The eastern half of the United States is a region that includes a highly productive biosphere, vigorous agricultural activity, extensive gas and oil extraction and consumption, dynamic, seasonally varying weather patterns and the most extensive carbon cycle and meteorological observing networks on Earth, serves as an ideal setting for the mission.
Each 6-week campaign accurately and precisely quantified anomalies in atmospheric carbon, also known as carbon flux. Accurate carbon flux data is necessary to address all terrestrial carbon cycle science questions. ACT-America addressed the three primary sources of uncertainty in atmospheric inversions—transport error, prior flux uncertainty, and limited data density.
ACT-America advances society’s ability to predict and manage future climate change by enabling policy-relevant quantification of the carbon cycle. Sources and sinks of atmospheric carbon dioxide (CO2) and methane (CH4) are poorly known at regional to continental scales. ACT-America enables and demonstrates a new generation of atmospheric inversion systems for quantifying CO2 and CH4 sources and sinks.
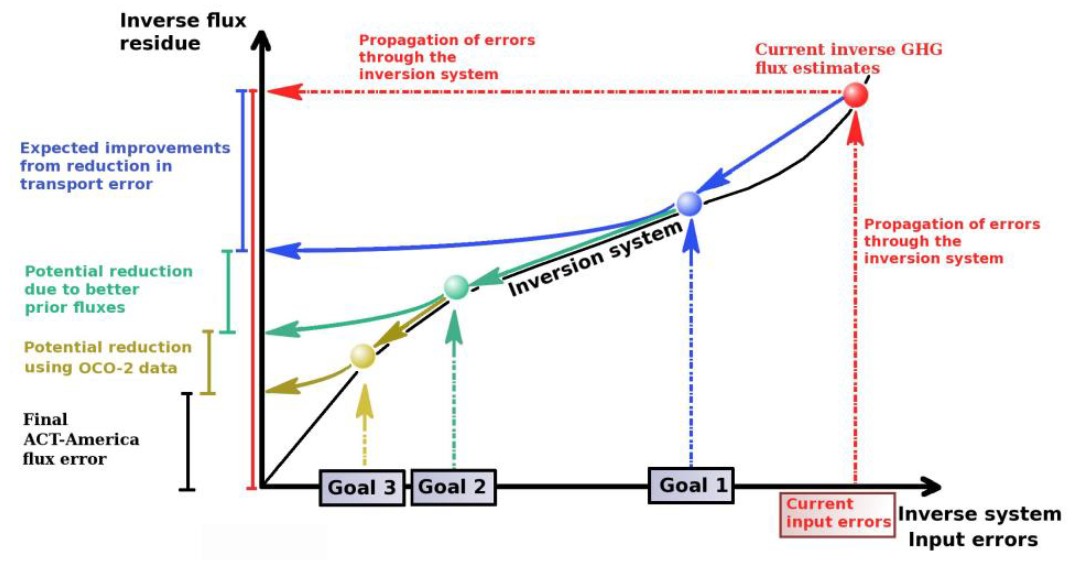
Figure 2. A schematic showing ACT-America mission goals.
ACT-America Goals
- To quantify and reduce atmospheric transport uncertainties.
- To improve regional-scale, seasonal prior estimates of C)2 and CH4 fluxes.
- To evaluate the sensitivity of Orbiting Carbon Observatory (OCO-2) column measurements to regional variability in tropospheric CO2.
ACT-America achieved these goals by deploying airborne and ground-based platforms to obtain data that were combined with data from existing measurement networks and integrated with an ensemble of atmospheric inversion systems. Aircraft instrumented with remote and in situ sensors observed how mid-latitude weather systems interact with CO2 and CH4 sources and sinks to create atmospheric CO2/CH4 distributions. A model ensemble consisting of a mesoscale atmospheric transport model with multiple physics and resolutions options nested within global inversion models and surface CO2/CH4 flux ensembles was used to predict atmospheric CO2 and CH4 distributions.
Beyond the conclusion of the mission, the application of knowledge gained from this mission will improve diagnoses of the carbon cycle across the globe for decades.
Quality Assessment
The evaluation of ACT-America field campaign data (Campbell et al., 2020) has shown that the lidar CO2 measurements are consistent from season to season and have an absolute calibration uncertainty (i.e., standard deviation) of 0.80 ppm. The CO2 measurement precision for 0.1 s, 1 s, 10 s, and 60 s averages was 3.4 ppm, 1.2 ppm, 0.43 ppm, and 0.26 ppm, respectively, and the drift in XCO2 over one hour of flight time was very small and below 0.1 ppm. Because of the unprecedented high stability, accuracy, and precision, the ACT-America MFLL data has been used for many analyses (e.g., Bell et al., 2020).
Data Acquisition, Materials, and Methods
The intensity-modulated continuous-wave (IM-CW) CO2 lidar (MFLL) has been a crucial instrument in measuring column CO2. This lidar was jointly developed for remote CO2 column measurements by the NASA Langley Research Center and the Harris Space and Intelligence Systems Corp (Dobler et al., 2013; Lin et al., 2013; Lin et al., 2015). These MFLL data were collected during the four ACT-America field campaigns: Summer 2016, Winter 2017, Fall 2017, and Spring 2018.
The XCO2 product release of the ACT-America MFLL Level 2 data (Campbell et al., 2020; Lin et al., 2018; Lin et al., 2021) is targeted at the end-users of CO2 observations for scientific research and societal applications. This product provides column-average CO2 measurements across a variety of ecosystems and landscapes in the eastern and central U.S.
The MFLL lidar system transmits online and offline wavelengths simultaneously on the 1.57 μm CO2 absorption line. The online wavelength is positioned on the CO2 absorption line center at 1571.112 nm, and the two offline wavelengths are set to be ±50 pm on either side of the absorption line. Each wavelength is modulated with a unique orthogonal waveform before being combined for simultaneous transmission through the atmosphere (Campbell, 2013; Campbell et al., 2014a; Campbell et al., 2014b). The individual wavelengths are then separated from the combined received signal by cross-correlating the received signal by each orthogonal waveform. Differential Absorption Optical Depth (DAOD) values are estimated from combined online and offline measurements. The result of this cross-correlation allows the determination of a backscatter profile for each wavelength, and the range to a scattering surface and signal amplitude is determined. The DAOD measurements, then, are converted to XCO2 values based on meteorological conditions at the measurement time and location (Campbell et al., 2020).
Because of the spectral characteristics of MFLL online and offline wavelengths, the MFLL-measured CO2 values have certain distinct vertical weights depending on the air pressure, temperature, humidity, and the wavelengths used at the measurement time and location (Campbell et al., 2020). The wavelengths were recorded by MFLL during its flight periods, and the meteorological data were obtained from the Modern-Era Retrospective analysis for Research and Applications version 2 (MERRA−2) weather product (https://gmao.gsfc.nasa.gov/reanalysis/MERRA-2/). Furthermore, the CO2 retrievals from MFLL measurements are also influenced by the measured nadir ranges from the MFLL sensor to the backscatter.
A vector of weighting coefficients represents conditions along with the vertical profile in the nadir directions and can be used to calculate an average of CO2 concentrations in this column. This vertical weighting function is unique for each column-average XCO2 value. The weighting functions were calculated assuming a uniform CO2 vertical profile of 400 ppm, and their related DAOD values were used as the scaling factor for the MFLL XCO2 retrieval. The weighting coefficients in each weighting function were normalized by their averages (Campbell et al., 2020).
In this dataset, a vector of normalized weighting values (coefficients) is reported for each measurement location. The vector is a vertical profile, and the number of values is equal to the nadir range (variable Range_nadir) divided by 30 m, plus 1 (for remainder distance <30 m). Nadir range, and therefore the number of values, varies among sample locations. The sampling interval was 10 seconds, which is equivalent to a horizontal spatial resolution of about 1.3 km under the nominal C-130 aircraft cruising speed of 250 knots.
Data Access
These data are available through the Oak Ridge National Laboratory (ORNL) Distributed Active Archive Center (DAAC).
ACT-America: L2 Weighting Functions for Airborne Lidar Column-avg CO2, Eastern USA
Contact for Data Center Access Information:
- E-mail: uso@daac.ornl.gov
- Telephone: +1 (865) 241-3952
References
Bell, E., C. O’Dell, K. Davis, S. Pal, B. Lin, S. Kooi, T. Fan, J. Campbell, E. Browell, J. Dobler, W. Erxleben, B. Weir, and S. Denning. 2020. Evaluation of OCO-2 XCO2 variability at local and synoptic scales using lidar and in situ observations from the ACT-America Campaign. Journal of Geophysical Research: Atmospheres 125:e2019JD031400. https://doi.org/10.1029/2019JD031400
Campbell, J.F. 2013. Nonlinear swept frequency technique for CO2 measurements using a CW laser system. Applied Optics 52:3100-3107. https://doi.org/10.1364/AO.52.003100
Campbell, J., B. Lin, A. Nehrir, F.W. Harrison, and M. Obland. 2014a. Super-resolution technique for CW lidar using Fourier transform reordering and Richardson–Lucy deconvolution. Optics Letters 39:6981-6984. https://doi.org/10.1364/OL.39.006981
Campbell, J.F., B. Lin, A.R. Nehrir, F.W. Harrison, and M.D. Obland. 2014b. Binary phase shift keying on orthogonal carriers for multi-channel CO2 absorption measurements in the presence of thin clouds. Optics Express 22:A1634-A1640. https://doi.org/10.1364/OE.22.0A1634
Campbell, J., B. Lin, E. Browell, M. Obland, J. Dobler, W. Erxleben, D. McGregor, C. O’Dell, E. Bell, S. Pal, B. Weir, T. Fan, S. Kooi, A. Corbett, K. Davis, I. Gordon, R. Kochanov. 2020. Field evaluation of column CO2 retrievals from intensity-modulated continuous-wave differential absorption lidar measurements during ACT-America. Earth and Space Science 7:e2019EA000847. https://doi.org/10.1029/2019EA000847
Dobler, Jeremy T., F.W. Harrison, E.V. Browell, B. Lin, D. McGregor, S. Kooi, Y. Choi, and S. Ismail. 2013. Atmospheric CO2 column measurements with an airborne intensity-modulated continuous wave 1.57 μm fiber laser lidar. Applied Optics 52:2874-2892. https://doi.org/10.1364/AO.52.002874
Lin, B., S. Ismail, F.W. Harrison, E.V. Browell, A.R. Nehrir, J. Dobler, B. Moore, T. Refaat, and S.A. Kooi. 2013. Modeling of intensity-modulated continuous-wave laser absorption spectrometer systems for atmospheric CO2 column measurements. Applied Optics 52:7062-7077. https://doi.org/10.1364/AO.52.007062
Lin, B., A.R. Nehrir, F.W. Harrison, E.V. Browell, S. Ismail, M.D. Obland, J.l Campbell, J. Dobler, B. Meadows, T. Fan, and S. Kooi. 2015. Atmospheric CO2 column measurements in cloudy conditions using intensity-modulated continuous-wave lidar at 1.57 micron. Optics Express 23:A582-A593. https://doi.org/10.1364/OE.23.00A582
Lin, B., J.F. Campbell, J. Dobler, E.V. Browell, S.A. Kooi, S. Pal, T. Fan, W. Erxleben, D. Mcgregor, M.D. Obland, and C. O'Dell. 2018. ACT-America: L2 Remotely Sensed Column-average CO2 by Airborne Lidar, Eastern USA. ORNL DAAC, Oak Ridge, Tennessee, USA. https://doi.org/10.3334/ORNLDAAC/1649
Lin, B., J.F. Campbell, J. Dobler, E.V. Browell, S.A. Kooi, S. Pal, T. Fan, W. Erxleben, D. Mcgregor, M.D. Obland, and C. O'Dell. 2021. ACT-America: L2 Column-avg CO2 by Airborne Lidar, Eastern US, MFLL Lite, 2016-2018. ORNL DAAC, Oak Ridge, Tennessee, USA. https://doi.org/10.3334/ORNLDAAC/1892