Documentation Revision Date: 2020-10-30
Dataset Version: 1
Summary
ACT-America's overall mission spanned five years and included field campaigns covering all four seasons over central and eastern regions of the United States. ACT-America's objectives were to study the transport and fluxes of atmospheric CO2 and CH4. Two instrumented aircraft platforms, the NASA Langley Beechcraft B-200 King Air and the NASA Wallops Flight Facility's C-130 Hercules, were used to collect high-quality in situ measurements across a variety of continental surfaces and atmospheric conditions. At times they flew directly under Orbiting Carbon Observatory-2 (OCO-2) overpasses to evaluate the ability of OCO-2 to observe high-resolution atmospheric CO2 variations. The C-130 aircraft was also equipped with active remote sensing instruments for planetary boundary layer height detection and column greenhouse gas measurements.
This dataset contains 28 files in netCDF (*.nc) format.

Figure 1. The communication tower at the Wessington, South Dakota site. This site was instrumented from January of 2017 to September of 2019.
Citation
Miles, N.L., S.J. Richardson, D.K. Martins, K.J. Davis, and B.J. Haupt. 2020. ACT-America: L1 Raw, Uncalibrated In-Situ CO2, CO, and CH4 Mole Fractions from Towers. ORNL DAAC, Oak Ridge, Tennessee, USA. https://doi.org/10.3334/ORNLDAAC/1798
Table of Contents
- Dataset Overview
- Data Characteristics
- Application and Derivation
- Quality Assessment
- Data Acquisition, Materials, and Methods
- Data Access
- References
Dataset Overview
This dataset provides Level 1 (L1) in-situ atmospheric carbon dioxide (CO2), carbon monoxide (CO), and methane (CH4) concentrations as measured on a network of instrumented communications towers across the central and eastern USA operated by the Atmospheric Carbon and Transport-America (ACT-America) project. There were 11 towers instrumented with cavity ring-down spectrometers (CRDS; Picarro Inc.) with measurements beginning in January 2015 and continuing to October 2019. The measurement period varied by tower site. The Picarro analyzers continuously measured total CH4, isotopic ratio of CH4, CO2, CO, and other greenhouse gas concentrations. Not all species were measured at all sites. Complete tower location, elevation, instrument height, and date/time information are also provided. Determination of greenhouse gas fluxes and uncertainty bounds is essential for the evaluation of the effectiveness of mitigation strategies. These L1 data are raw instrument outputs from the Picarro instruments. A Level 2 (L2) product derived from this L1 data is available and generally would be the preferred data for most use cases.
ACT-America's overall mission spanned five years and included field campaigns covering all four seasons over central and eastern regions of the United States. ACT-America's objectives were to study the transport and fluxes of atmospheric CO2 and CH4. Two instrumented aircraft platforms, the NASA Langley Beechcraft B-200 King Air and the NASA Wallops Flight Facility's C-130 Hercules, were used to collect high-quality in-situ measurements across a variety of continental surfaces and atmospheric conditions. At times they flew directly under Orbiting Carbon Observatory-2 (OCO-2) overpasses to evaluate the ability of OCO-2 to observe high-resolution atmospheric CO2 variations. The C-130 aircraft was also equipped with active remote sensing instruments for planetary boundary layer height detection and column greenhouse gas measurements.
Project: Atmospheric Carbon and Transport - America
The ACT-America, or Atmospheric Carbon and Transport - America, project was a NASA Earth Venture Suborbital-2 mission to study the transport and fluxes of atmospheric carbon dioxide and methane across three regions in the eastern United States. ACT-America conducted five flight campaigns spanning all four seasons throughout 2016—2019 and measured how weather systems transported greenhouse gases. Ground-based measurements were also collected. The objective of the study was to enable more accurate and precise estimates of the sources and sinks of greenhouse gases, as better estimates are needed for climate management and for prediction of future climate. Three primary sources of uncertainty (i.e., transport error, prior flux uncertainty, and limited data density) were addressed to improve the inference of carbon dioxide and methane sources and sinks.
Related Datasets
Digangi, J.P., Y. Choi, J.B. Nowak, and H.S. Halliday. 2017. ACT-America: L2 In Situ Atmospheric CO2, CO, CH4, and O3 Concentrations, Eastern USA. ORNL DAAC, Oak Ridge, Tennessee, USA. https://doi.org/10.3334/ORNLDAAC/1556
Miles, N.L., S.J. Richardson, D.K. Martins, K.J. Davis, T. Lauvaux, B.J. Haupt, and S.K. Miller. 2018. ACT-America: L2 In Situ CO2, CO, and CH4 Concentrations from Towers, Eastern USA. ORNL DAAC, Oak Ridge, Tennessee, USA. https://doi.org/10.3334/ORNLDAAC/1568
Acknowledgments
The Monroe, Magee, Millerville, and Panama City tower sites were supported by NASA grants NNX14AJ17G for 2015—2016, and NNX14AJ17G and NNX15AG76G for 2017. The Grenada tower site was supported by NASA grant NNX14AJ17G for 2015—2016. For 2017, it was funded by NASA grants NNX14AJ17G and NNX15AG76G and the NOAA grant RA-133R-18-SE-0020. The Greenfield, Mooresville, and Crawfordsville tower sites were supported by the National Institute of Standards and Technology grant 70NANB10H245. The Mildred tower site was supported by the DOE National Energy Technology Laboratory grant DE-FOA-0000894 for 2015—2016 and by NASA grant NNX15AG76G for 2017.
Data Characteristics
Spatial Coverage: Tower locations over eastern and central US
Spatial Resolution: Point measurements
Temporal Coverage: 2015-01-01 to 2019-12-31
Temporal Resolution: Approximately 2-3 seconds
Study Area: Latitude and longitude are given in decimal degrees.
| Site | Westernmost Longitude | Easternmost Longitude | Northernmost Latitude | Southernmost Latitude |
|---|---|---|---|---|
| Eastern and Central United States | -98.587972 | -76.4188 | 44.05015 | 30.1951 |
Table 1. Site Details and tower decommissioning dates.
| Site Name | Site Abbreviation | Latitude | Longitude | Installation | Decommissioning |
|---|---|---|---|---|---|
| Millerville, Alabama | AL-01 | 33.1759 | -85.8911 | 2015-03-19 | 2018-10-17 |
| Panama-City, Florida | FL-01 | 30.1951 | -85.8336 | 2015-03-20 | 2019-12-11 |
| Monroe, Louisiana | LA-01 | 32.469 | -92.2829 | 2015-03-22 | 2018-10-15 |
| Magee, MS | MS-01 | 31.8869 | -89.7276 | 2015-03-21 | 2017-10-15 |
| Grenada, MS | MS-02 | 33.7525 | -89.8539 | 2015-03-23 | 2019-10-03 |
| Danville, Virginia | DVV | 36.705806 | -79.436861 | 2016-07-13 | 2018-12-04 |
| Wessington, South Dakota | WSD | 44.05015 | -98.587972 | 2017-02-04 | 2019-09-20 |
| Marcellus South - Mildred, PA | MRC | 41.4662 | -76.4188 | 2015-05-07 | |
| Mooresville, IN | IN-01 | 39.5805 | -86.4207 | 2010-09-22 | |
| Greenfield, IN | IN-09 | 39.8627 | -85.7448 | 2012-03-30 | |
| Crawfordsville, IN | IN-14 | 39.9971 | -86.7396 | 2017-04-26 |
Data File Information
This dataset contains 28 data files in netCDF (*.nc) format following CF Conventions (v1.6). There can be multiple files per site but not all sites have data for all years.
File Naming Convention
Files are named according to the format <project>-<instrument>_<platform>-<level>_<station>_<instrument-id>_<startdate>_<enddate>.nc (e.g., ACTAMERICA-PICARRO_Tower-L1_Danville_CADS05_20180125_20181203.nc), where:
<project> = ACTAMERICA
<instrument> = PICARRO
<platform> = Tower
<level> = L1
<station> = tower site names (Crawfordsville, Danville, Greenfield, Grenada, Magee, Mildred, Monroe, Mooresville, Millerville, Panama-City, Wessington)
<instrument-id> = instrument ID
<startdate> = start date in UTC, in YYYYMMDD format
<enddate> = end date in UTC, YYYYMMDD format
Data File Details
Table 1. Variable names, units, and descriptions. Not all variables are available in all files.
FRAC_DAYS_SINCE_JAN1 solenoid_valves OutletValve
| Variable Name | Units | Description |
|---|---|---|
| Station Information | ||
| site_name | Site name (Stations: Crawfordsville, Danville, Greenfield, Grenada, Magee, Mildred, Monroe, Mooresville, Millerville, Panama-City, Wessington) | |
| latitude | decimal degrees north | Site latitude |
| longitude | decimal degrees east | Site longitude |
| altitude | meter | Elevation of tower base above sea level |
| sampling_height | meter | Sampling height above ground level |
| Time Series Variables | ||
| time | hours since 2015-01-01 00:00:00.0 UTC | |
| fractional days | fractional days | Fractional days since January 1 of the current year (add 1 to get day-of-year) |
| FRAC_HRS_SINCE_JAN1 * | hours | Fractional hours since January 1 (add 1x24 to get a day of the year in hours) |
| JULIAN_DAYS * | days | Julian days |
| EPOCH_TIME * | seconds | Number of seconds elasped since UNIX epoch |
| ALARM_STATUS | System alarm: 0=good, 1=bad | |
| CavityPressure | Torr | Pressure in the cavity of the instrument |
| CavityTemp | degrees Celsius | Temperature in the cavity of instrument |
| WarmBoxTemp * | degrees Celsius | Temperature of the instrument warm box |
| DasTemp | degrees Celsius | Room temperature |
| MPVPosition * | Rotary valve flag | |
| solenoid_valves | 0=air sample, 8=cal 1, 16=cal 2; inlets used for sampling different gas sources | |
| InletValve | The opening of inlet valve of cavity which is always kept open at a fixed position | |
| OutletValve | The opening of outlet valve of cavity which varies between fully closed and value fully opened to ensure stability of cavity pressure | |
| species | An indicator function of gas species update; 1 if CO2, 2 if CH4, 3 if H2O, and 4 if CO | |
| CH4 | ppmv | CH4 mixing ratio without vapor correction in parts per million by volume |
| CH4_dry | ppmv | Dry CH4 mixing ratio in parts per million by volume |
| CO | ppmv | Dry CO mixing ratio in parts per million by volume |
| CO2 | ppmv |
CO2 mixing ratio without vapor correction in parts per million by volume |
| CO2_dry | ppmv | Dry CO2 mixing ratio in parts per million by volume |
| H2O | percent | Water vapor mixing ratio of dried sample in parts per hundred by volume; useful only for diagnostic purposes |
| h2o_pct | percent | Percent concentration of water vapor, not recommended for use |
| h2o_reported | percent | Reported concentration of concentration of water vapor, used for vapor correction, not recommended for use |
| b_h2o_pct | percent | Absorption line of H2O that are adjacent to the line of CO, not recommended for use |
| Delta_iCH4_Raw * | per mil | Raw (not averaged) isotopic ratio of CH4 |
| HP_12CH4 * | ppmv | High precision 12CH4 |
| HP_Delta_iCH4_2min * | per mil | 2 minute mean of isotopic ratio of CH4 (high precision) |
| HP_Delta_iCH4_30s * | per mil | 30 second mean of isotopic ratio of CH4 (high precision) |
| HP_Delta_iCH4_5min * | per mil | 5 minute mean of isotopic ratio of CH4 (high precision) |
| HP_Delta_iCH4_Raw * | per mil | Raw (not averaged) isotopic ratio of CH4 (high precision) |
| HR_12CH4* | ppmv | High range 12CH4 |
| HR_Delta_iCH4_2min * | per mil | 2 minute mean of isotopic ratio of CH4 (high range) |
| HR_Delta_iCH4_30s * | per mil | 30 second mean of isotopic ratio of CH4 (high range) |
| HR_Delta_iCH4_5min * | per mil | 5 minute mean of isotopic ratio of CH4 (high range) |
| HR_Delta_iCH4_Raw * | per mil | Raw (not averaged) isotopic ratio of CH4 (high range) |
| ChemDetect * | Detection of possible contaminants | |
* Indicates that a variable is available for the Mildred site only.
Companion Files
Picarro instrument specifications are found in the files datasheet-g2301-crds-analyzer-co2-ch4-h2o-air-oct15.pdf and G2301-m+Manual+rev+2-11-11.pdf. Individual site/tank information is provided in the file Tank_log_raw_data.xlsx.
Data Center Processing
The ORNL DAAC transformed and combined ~15,000 files from the originally provided DAT format to 28 files in CF-compatible netCDF4 format to make them easier to understand and to use.
Application and Derivation
ACT-America, or Atmospheric Carbon and Transport - America, conducted five airborne campaigns across three regions in the eastern United States to study the transport and fluxes of atmospheric carbon. The eastern half of the United States is a region that includes a highly productive biosphere, vigorous agricultural activity, extensive gas and oil extraction and consumption, dynamic, seasonally varying weather patterns and the most extensive carbon cycle and meteorological observing networks on Earth, serves as an ideal setting for the mission.
Each 6-week campaign accurately and precisely quantified anomalies in atmospheric carbon, also known as carbon flux. Accurate carbon flux data is necessary to address all terrestrial carbon cycle science questions. ACT-America addressed the three primary sources of uncertainty in atmospheric inversions—transport error, prior flux uncertainty, and limited data density.
ACT-America advances society’s ability to predict and manage future climate change by enabling policy-relevant quantification of the carbon cycle. Sources and sinks of atmospheric carbon dioxide (CO2) and methane (CH4) are poorly known at regional to continental scales. ACT-America enables and demonstrates a new generation of atmospheric inversion systems for quantifying CO2 and CH4 sources and sinks.
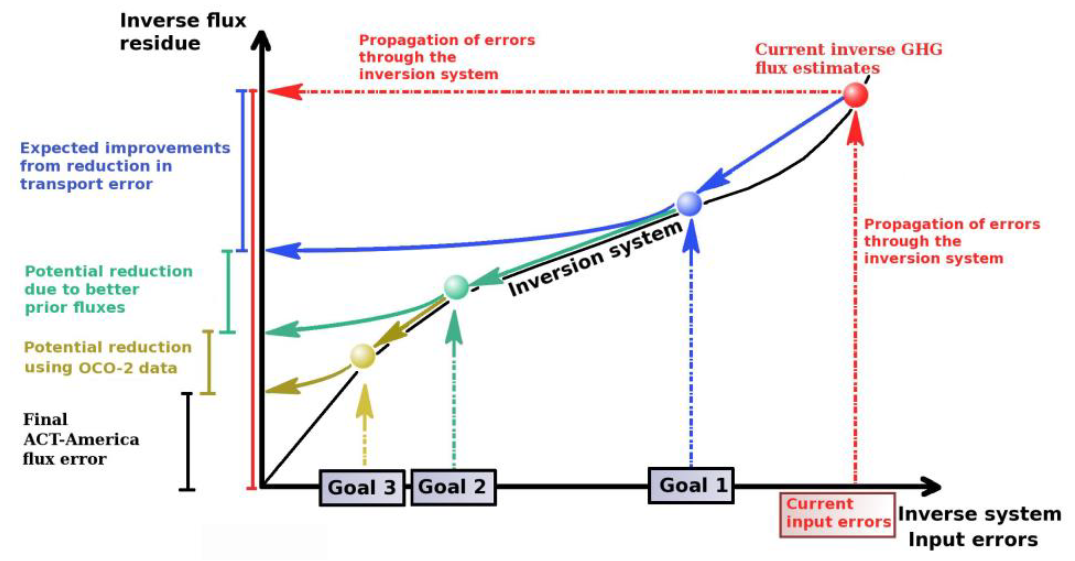
Figure 3. A schematic showing ACT-America mission goals.
ACT-America Goals
- To quantify and reduce atmospheric transport uncertainties.
- To improve regional-scale, seasonal prior estimates of CO2 and CH4 fluxes.
- To evaluate the sensitivity of Orbiting Carbon Observatory (OCO-2) column measurements to regional variability in tropospheric CO2.
ACT-America achieved these goals by deploying airborne and ground-based platforms to obtain data that were combined with data from existing measurement networks and integrated with an ensemble of atmospheric inversion systems. Aircraft instrumented with remote and in-situ sensors observed how mid-latitude weather systems interact with CO2 and CH4 sources and sinks to create atmospheric CO2/CH4 distributions. A model ensemble consisting of a mesoscale atmospheric transport model with multiple physics and resolutions options nested within global inversion models and surface CO2/CH4 flux ensembles was used to predict atmospheric CO2 and CH4 distributions.
Beyond the conclusion of the mission, the application of knowledge gained from this mission will improve diagnoses of the carbon cycle across the globe for decades.
Quality Assessment
Calibration: Prior to deployment, the instruments were calibrated in the laboratory using four NOAA-calibrated tanks. A field calibration tank was sampled daily and used to apply a zero-offset correction. Round robin tests using 3-4 NOAA-calibrated tanks were conducted every 1-2 years. NOAA flask measurements were used for comparison at the Mildred, Greenfield, and Mooresville sites. Individual site/tank information is provided in the file Tank_log_raw_data.xlsx found in the companion file for this dataset.
Uncertainty: Based on the flask to in-situ comparisons and round-robin testing presented in Richardson et al. (2017), the estimated compatibility of these measurements is approximately 0.18 ppm CO2 and 0.6 ppb CH4. Instrument precision specifications are available in the ACT-America proposal and replicated below (Fig. 3).
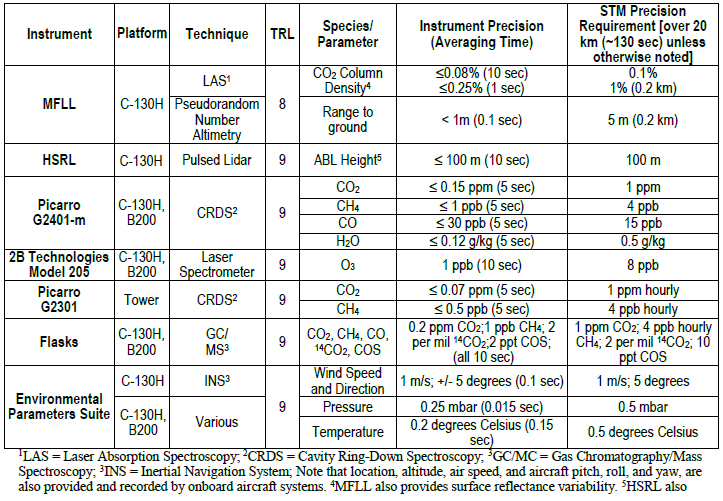
Figure 3. Instrument precision table as provided in the ACT-America proposal.
Data Acquisition, Materials, and Methods
ACT-America Overview
ACT-America deployed the NASA C-130 and B-200 aircraft to measure atmospheric CO2 and CH4 in the atmospheric boundary layer (ABL) and free troposphere (FT). In all five seasonal campaigns, a total of 121 days of research flights, more than 1,140 hours of observations, 570 level legs, and 1,363 vertical profiles were conducted. Flights concentrated observations on three study domains: Northeast, South-central, and Midwest. These flights were dedicated in a roughly 3:3:1 ratio among fair weather, stormy weather, and OCO-2 underpass flight patterns.
For fair and stormy weather flights, the C-130 flew at 3-8 km above ground, collecting in-situ measurements in the lower FT, remotely sensed, column-averaged CO2 measurements focused on the ABL, and occasional in-situ vertical profiles. The B-200 primarily sampled the ABL. For OCO-2 under flights, the C-130 flew at 8 km above ground with the B-200 flying in the ABL, both along the OCO-2 flight track. The existing in situ tower CO2/CH4 observing network was enhanced with five additional tower sites.
The mission delivered 2-3 times more high-quality lower tropospheric CO2 and CH4 observations than any previous airborne campaign.
Tower Sites
ACT-America utilized existing communications towers, filling gaps that existed in or near our three study regions in existing tower networks (Fig. 4). Specific sites were selected in science-critical locations based on tall tower and local Ethernet or cell phone data connection availability. Daily, automated data transfer to the Langley Atmospheric Science Data Center allowed for remote monitoring of instrument status and investigation planning.
NOTE: Data from 11 towers are provided, but not all towers have data for all years.
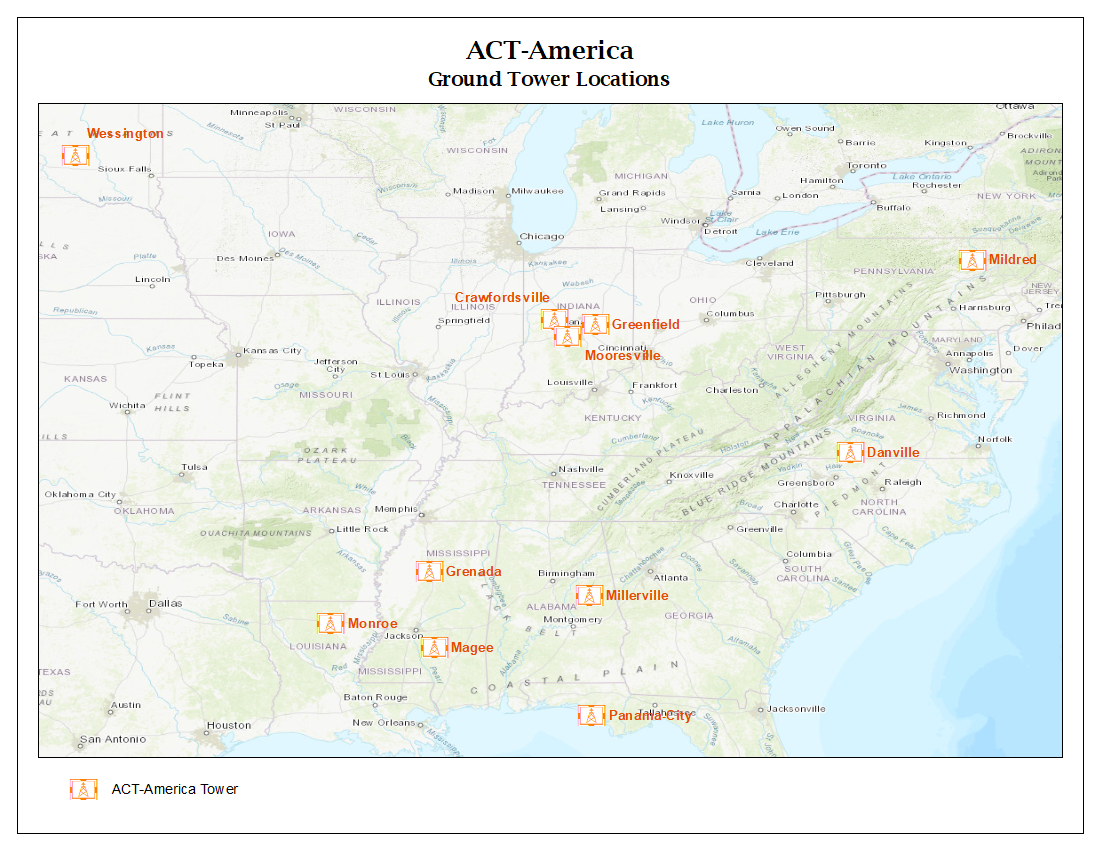
Figure 4. ACT-America atmospheric sampling tower locations.
Tower Instrumentation
Tower platforms utilized the Picarro G2301 CRDS for CO2, CO, CH4, and H2O measurements (Fig. 5). Instruments reported raw data every 2-3 seconds, but these data points were not independent because of the mixing volume. Other L1 species and isotropic measurements were available from the Picarro G2301 CRDS, but not necessarily used in the ACT-America analysis.
Instrument specifications are found in the files datasheet-g2301-crds-analyzer-co2-ch4-h2o-air-oct15.pdf and G2301-m+Manual+rev+2-11-11.pdf that are included as companion files for this dataset.
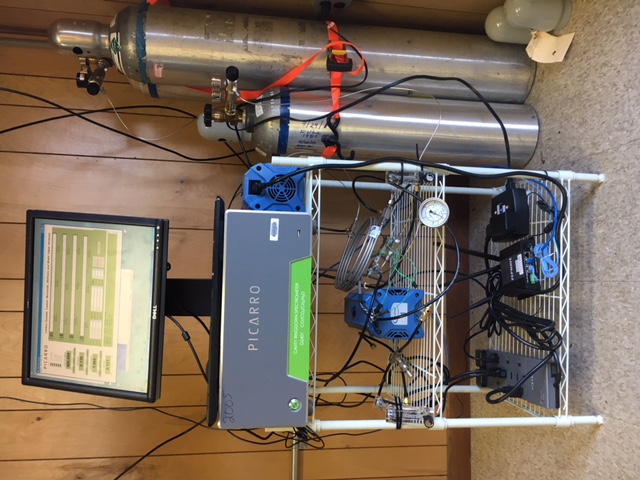
Figure 5. Instrumentation at one of the ACT-America tower sites.
Data Access
These data are available through the Oak Ridge National Laboratory (ORNL) Distributed Active Archive Center (DAAC).
ACT-America: L1 Raw, Uncalibrated In-Situ CO2, CO, and CH4 Mole Fractions from Towers
Contact for Data Center Access Information:
- E-mail: uso@daac.ornl.gov
- Telephone: +1 (865) 241-3952
References
Digangi, J.P., Y. Choi, J.B. Nowak, and H.S. Halliday. 2017. ACT-America: L2 In Situ Atmospheric CO2, CO, CH4, and O3 Concentrations, Eastern USA. ORNL DAAC, Oak Ridge, Tennessee, USA. https://doi.org/10.3334/ORNLDAAC/1556
Miles, N.L., S.J. Richardson, D.K. Martins, K.J. Davis, T. Lauvaux, B.J. Haupt, and S.K. Miller. 2018. ACT-America: L2 In Situ CO2, CO, and CH4 Concentrations from Towers, Eastern USA. ORNL DAAC, Oak Ridge, Tennessee, USA. https://doi.org/10.3334/ORNLDAAC/1568
Richardson SJ, Miles NL, Davis KJ, Lauvaux T, Martins DK, Turnbull JC, et al. 2017. Tower measurement network of in-situ CO2, CH4, and CO in support of the Indianapolis FLUX (INFLUX) Experiment. Elem Sci Anth. 5:59. http://doi.org/10.1525/elementa.140