Documentation Revision Date: 2021-11-23
Dataset Version: 1
Summary
Investigators performed an expert visual inspection of the measured time-height cross-section of the 2D field of aerosol backscatter profiles as compared with overlaid algorithm-derived ABL top heights and secondary aerosol layers. Based on observed/derived agreement, quality flag values were assigned to each observation of reported ABL top heights. The annotated results of the visual inspections are proved as companion files—one for each of the four campaigns.
There are 85 data files in comma-separated value (*.csv) files included in this dataset; one file for each day of the four field campaigns. Also included are four companion files in portable document format (*.pdf).
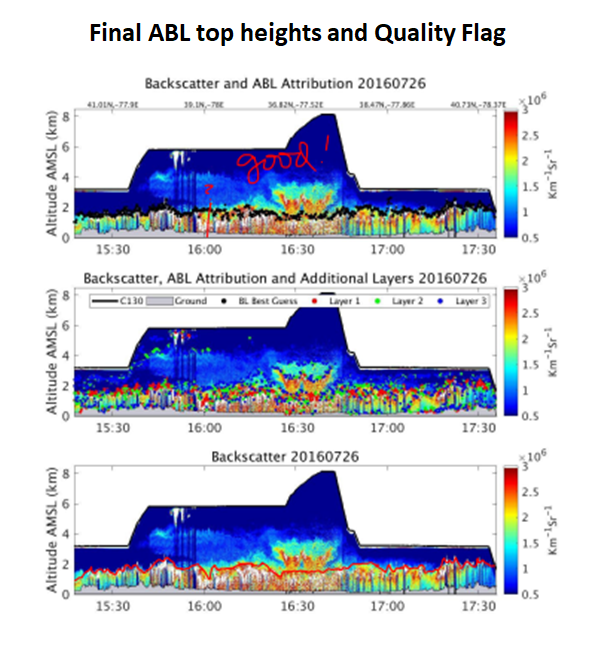
Figure 1. Top panel: As annotated during expert review, showing time-height cross-section of aerosol backscatter profiles measured using CPL onboard C-130 aircraft on 2016-07-26 during a frontal crossing research flight over the Mid-Atlantic region along with the wavelet-derived ABL top (black solid-circles) height overlaid. Blue to red color bar scale represents low to high normalized aerosol backscatter signal (in a.u.). Middle: Secondary aerosol layers overlaid on the top panel. Bottom: Final attributed ABL top heights. Temporal resolution of the ABL top heights and other aerosol layers is 8 seconds.
Citation
Pal, S., K.J. Davis, R.M. Pauly, M.J. McGill, L.J. Campbell, K. Hoffman, A.M. Alejandro, M. Rench, and H. Haas. 2021. ACT-America: CPL-derived Atmospheric Boundary Layer Top Height, Eastern US, 2016-2018. ORNL DAAC, Oak Ridge, Tennessee, USA. https://doi.org/10.3334/ORNLDAAC/1825
Table of Contents
- Dataset Overview
- Data Characteristics
- Application and Derivation
- Quality Assessment
- Data Acquisition, Materials, and Methods
- Data Access
- References
Dataset Overview
This dataset consists of the atmospheric boundary layer (ABL) top heights and the altitudes of the two additional aerosol layers (in km above mean sea level) derived from Cloud Physics Lidar (CPL) measurements using the Haar wavelet transform method. The CPL instrument was deployed onboard NASA's C-130 aircraft to obtain aerosol backscatter profiles during four ACT-America field campaigns (Summer 2016, Winter 2017, Fall 2017, and Spring 2018). CPL is a backscatter lidar designed to operate simultaneously at three wavelengths. The profiles were collected at 4-second temporal and 30 m vertical resolutions. The time resolution of the provided CPL-derived ABL top heights and other aerosol layers are 8 seconds.
Investigators performed an expert visual inspection of the measured time-height cross-section of the 2D field of aerosol backscatter profiles as compared with overlaid algorithm-derived ABL top heights and secondary aerosol layers. Based on observed/derived agreement, quality flag values were assigned to each observation of reported ABL top heights. The annotated results of the visual inspections are proved as companion files—one for each of the four campaigns.
Project: Atmospheric Carbon and Transport – America
The ACT-America, or Atmospheric Carbon and Transport - America, project was a NASA Earth Venture Suborbital-2 mission to study the transport and fluxes of atmospheric carbon dioxide and methane across three regions in the eastern United States. Each flight campaign measured how weather systems transport these greenhouse gases. Ground-based measurements of greenhouse gases were also-collected. Better estimates of greenhouse gas sources and sinks are needed for climate management and for prediction of future climate.
Related Dataset
Pal, S. 2019. ACT-America: Profile-based Planetary Boundary Layer Heights, Eastern USA. ORNL DAAC, Oak Ridge, Tennessee, USA. https://doi.org/10.3334/ORNLDAAC/1706
Acknowledgments
The Atmospheric Carbon and Transport-America (ACT-America) project was sponsored by NASA (grant NNX15AG76G). The lead author, Sandip Pal, was supported by NASA (grant 80NSSC19K0730) and Texas Tech University (grant 14A001-B5399P-200). Co-author Kylie Hoffman contributed to this work within her REU research work at the Pennsylvania State University in Summer 2017. The authors thank the data management teams at NASA LaRC and ORNL for their support.L (particularly, Gao Chen, Michael A. Shook, Ali Aknan, Alison Boyer, Yaxing Wei, John Jack McNelis, and Rupesh Shrestha).
Data Characteristics
Spatial Coverage: Flights over eastern and central U.S.
Spatial Resolution: Point measurements. With a typical aircraft speed of 130 m s-1 during the field campaigns, the horizontal resolution of ABL top heights reported would be ~1000 m.
Temporal Coverage: Periodic flights occurred during each intensive campaign.
| Campaign | Beginning and Ending Dates |
|---|---|
| Summer 2016 * | 2016-07-11 to 2016-08-28 |
| Winter 2017 | 2017-01-21 to 2017-03-10 |
| Fall 2017 | 2017-10-03 to 2017-11-13 |
| Spring 2018 | 2018-04-12 to 2018-05-20 |
| Summer 2019 ** | 2019-06-17 to 2019-07-27 |
* CPL derived ABL top heights are available beginning 2016-07-18
** CPL not included
Temporal Resolution: 8 seconds.
Study Area: Latitude and longitude are given in decimal degrees.
| Site | Northernmost Latitude | Southernmost Latitude | Westernmost Longitude | Easternmost Longitude |
|---|---|---|---|---|
| eastern and central U.S. | 50.550 | 27.230 | -106.494 | -71.911 |
Data File Information
There are 85 data files in comma-separated value (*.csv) files included in this dataset; one file for each day of the four field campaigns. Also included are four companion files in portable document format (*.pdf). The data files are named actamerica_CPL_Haar_C130_YYYYMMDD.csv (e.g., actamerica_CPL_Haar_C130_20160718.csv), where YYYYMMDD is the flight date.
Data File Details
Missing values have been set to -9999.
Table 1. Variable names and descriptions.
| Variable Name | Units | Description |
|---|---|---|
| date | yyyy-mm-dd | Collection date |
| time | hh:mm:ss | Sample time, aggregated to 8-second interval |
| lat | decimal degrees | Latitude |
| lon | decimal degrees | Longitude |
| c130_alt | km AMSL | Altitude of the C-130 along its ground track |
| groundht | km AMSL | Ground height along C-130 track. Reported negative and erroneous (-9999) values should be avoided when calculating height above ground level. |
| max1_alt_msl | km AMSL | ABL top height, maximum altitude |
| max2_alt_msl | km AMSL | Maximum altitude of selected other/secondary aerosol layer in the troposphere below the aircraft altitude. |
| max3_alt_msl | km AMSL | Maximum altitude of selected other/secondary aerosol layer in the troposphere below the aircraft altitude. |
| min1_alt_msl | km AMSL | ABL top height, minimum altitude |
| min2_alt_msl | km AMSL | Minimum altitude of selected other/secondary aerosol layer in the troposphere below the aircraft altitude. |
| min3_alt_msl | km AMSL | Minimum altitude of selected other/secondary aerosol layer in the troposphere below the aircraft altitude. |
| bl_best_msl | km AMSL | Best ABL top height per expert opinion. |
| bl_best_msl_flag | Quality flag of the ABL top heights based on as illustrated in Fig. 1. The reported flag values of 0, 1, and 2 correspond to bad, uncertain, and good data quality of reported ABL top heights, respectively. Users are highly recommended to use the ABL top heights with a flag value of 2. |
Application and Derivation
Based on the approach introduced by Davis et al. (2000), investigators applied the Haar wavelet transform method on the CPL-derived normalized aerosol backscatter profiles and determined the altitudes in kilometers above mean sea level (AMSL) of step-changes in the backscatter profile, often indicative of aerosol layers, using wavelet transform coefficient values. The aircraft altitude was determined by a radar altimeter onboard C-130 aircraft. Identifying the local maxima and local minima in wavelet transformed profiles is synonymous with picking out the top and bottom of atmospheric layers. The wavelet method allows for atmospheric layers to be picked out in an automated fashion, with relatively high precision. Using the formulation applied in Davis et al. (2000), once all the covariance coefficients are calculated for a single lidar profile, covariance coefficients and altitudes of local maxima and local minima are identified. Finally, a guided best estimate to identify the boundary layer top would be the local maxima with the largest coefficient, representing the highest vertical gradient in aerosol concentrations.
Quality Assessment
An intercomparison of ABL top heights was performed using the gradient-based method and the Haar wavelet method and with the aircraft profile of thermodynamic variables for summer 2016 flights (Pal, 2019). The intercomparison results indicated that the wavelet-based results were found to agree better with the thermodynamic profile-based results (R=0.64) than the gradient-based results (R=0.38). Also, intercomparison results suggest that the wavelet-derived ABL heights have fewer fluctuations around their mean values than the gradient method. Thermodynamic profile-based results were used as a reference (Koffi et al., 2016). Overall, a straightforward comparison between the wavelet-derived ABL heights versus thermodynamic profile-derived ABL heights yielded mean and median differences (wavelet minus thermodynamic) of 164 and 52 m, respectively. The RMSE of the differences was 484 m.
Data Acquisition, Materials, and Methods
Cloud Physics Lidar
The Cloud Physics Lidar (CPL) is a backscatter lidar designed to operate simultaneously at three wavelengths: 1064 nm, 532 nm, and 355 nm (McGill et al., 2004; McGill et al., 2007). During four ACT-America field campaigns (i.e., Summer 2016, Winter 2017, Fall 2017, and Spring 2018) CPL was deployed onboard NASA’s C-130 aircraft to obtain aerosol backscatter profiles to determine atmospheric boundary layer (ABL) top heights. During the ACT campaigns, aerosol backscatter profiles were collected with 4-second temporal and 30 m vertical resolutions. The primary deliverable of CPL for the ACT project was (1) ABL top heights and (2) heights of other/secondary aerosol layers in the troposphere below the aircraft altitude. For supplemental information and related datasets for cloud depth, frequency, and properties, users are recommended to access the ACT-America datasets archived on the LaRC site (https://www-air.larc.nasa.gov/missions/ACT-America/index.html).
ABL Top Height Datasets
There exist several methods in the literature to derive ABL top heights using lidar measurements of aerosol backscatter profiles. However, the Haar wavelet transform method has been found to be a reliable approach for the determination of ABL top heights for both airborne (Davis et al., 2000) and ground based-lidar measurements (Pal et al., 2010). The Haar wavelet transform method (Davis et al., 2000) was applied on the CPL-derived normalized aerosol backscatter profiles and determined the altitudes in km above mean sea level (AMSL) of step-changes in the backscatter profile, often indicative of aerosol layers, using wavelet transform coefficient values. The aircraft altitude was determined by a radar altimeter onboard C-130 aircraft. Identifying the local maxima and local minima in wavelet transformed profiles is synonymous with picking out the top and bottom of atmospheric layers. The wavelet method allowed for atmospheric layers to be picked out in an automated fashion, with relatively high precision. Using the formulation applied in Davis et al. (2000), once all the covariance coefficients were calculated for a single lidar profile, covariance coefficients and altitudes of local maxima and local minima were identified. Finally, a guided best estimate to identify the boundary layer top was the local maxima with the largest coefficient, representing the highest vertical gradient in aerosol concentrations.
Derived ABL top heights and the altitudes of the two additional aerosol layers (in km, AMSL) are provided. Users should use the elevation of the C-130 above ground along its ground-track (variable groundht in km AMSL). However, negative or erroneous groundht values reported should be avoided to obtain the ABL depths in km above ground level (AGL). The time resolution of CPL-derived ABL top heights and other aerosol layers reported in the archived CSV file is 8 seconds. With a typical aircraft speed of 130 m s-1 of C-130 during the ACT field campaigns, the horizontal resolution of ABL top heights reported would be ~1000 m.
Additionally, a quality flag of the ABL top heights were produced based on expert opinion (Fig. 2). Visual inspection and screening were performed of time-height cross-section of the 2-D field of aerosol backscatter profiles with ABL top heights and secondary aerosol layers overlaid. Flag values were provided for ABL top heights. Users are highly recommended to use the ABL top heights with a flag value of 2.
The details of this screening and the individual lidar images with comments (e.g., Fig. 2) are provided as companion files. Note that there are additional instances where CPL did observe ABL top clearly, but this was not captured by the algorithms. This is indicated in the expert screening images. Improvements are planned for the algorithms to increase the retrieval of good ABL depth data.
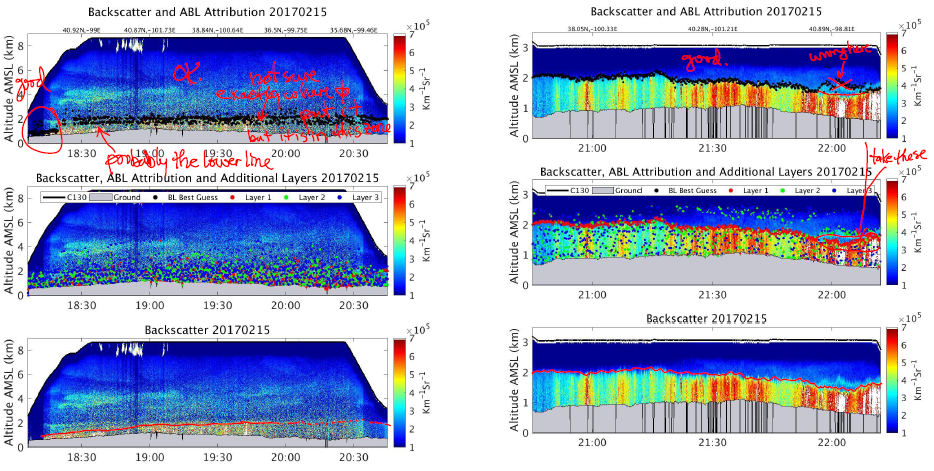
Figure 2. Results of expert visual inspection of time-height cross-section of 2D field of aerosol backscatter profiles compared with overlaid algorithm-derived ABL top heights and secondary aerosol layers. Based on agreement, quality flag values (0=bad, 1=uncertain, 2=good data quality) were assigned to each observation of reported ABL top heights. Users are highly recommended to use the ABL top heights with a flag value of 2 and the reported variable bl_best_msl.
Data Access
These data are available through the Oak Ridge National Laboratory (ORNL) Distributed Active Archive Center (DAAC).
ACT-America: CPL-derived Atmospheric Boundary Layer Top Height, Eastern US, 2016-2018
Contact for Data Center Access Information:
- E-mail: uso@daac.ornl.gov
- Telephone: +1 (865) 241-3952
References
Davis, K.J., N. Gamage, C.R. Hagelberg, C. Kiemle, D.H. Lenschow, and P.P. Sullivan. 2000. An Objective Method for Deriving Atmospheric Structure from Airborne Lidar Observations. Journal of Atmospheric and Oceanic Technology 17:1455–1468. https://doi.org/10.1175/1520-0426(2000)017%3C1455:AOMFDA%3E2.0.CO;2
Koffi, E.N., P. Bergamaschi, U. Karstens, M. Krol, A. Segers, M. Schmidt, I. Levin, A.T. Vermeulen, R.E. Fisher, V. Kazan, H. Klein Baltink, D. Lowry, G. Manca, H.A.J. Meijer, J. Moncrieff, S. Pal, M. Ramonet, H.A. Scheeren, and A.G. Williams. 2016. Evaluation of the boundary layer dynamics of the TM5 model over Europe. Geoscientific Model Development 9:3137–3160. https://doi.org/10.5194/gmd-9-3137-2016
McGill, M.J., M.A. Vaughan, C.R. Trepte, W.D. Hart, D.L. Hlavka, D.M. Winker, and R. Kuehn. 2007. Airborne validation of spatial properties measured by the CALIPSO lidar. Journal of Geophysical Research 112. https://doi.org/10.1029/2007JD008768
McGill, M.J. 2004. Combined lidar-radar remote sensing: Initial results from CRYSTAL-FACE. Journal of Geophysical Research 109. https://doi.org/10.1029/2003JD004030
Pal, S., A. Behrendt, and V. Wulfmeyer. 2010. Elastic-backscatter-lidar-based characterization of the convective boundary layer and investigation of related statistics. Annales Geophysicae 28:825–847. https://doi.org/10.5194/angeo-28-825-2010
Pal, S. 2019. ACT-America: Profile-based Planetary Boundary Layer Heights, Eastern USA. ORNL DAAC, Oak Ridge, Tennessee, USA. https://doi.org/10.3334/ORNLDAAC/1706.