Documentation Revision Date: 2021-11-22
Dataset Version: 1
Summary
The NASA Atmospheric Carbon and Transport (ACT) - America project conducted five airborne campaigns across three regions in the eastern United States to study the transport and fluxes of atmospheric carbon dioxide (CO2) and methane (CH4). Each six-week campaign measured how weather systems transport these greenhouse gases. The objective of the study is to enable more accurate and precise estimates of the sources and sinks of these gases.
There are 27,037 data files in netCDF (*.nc) format included in this dataset.
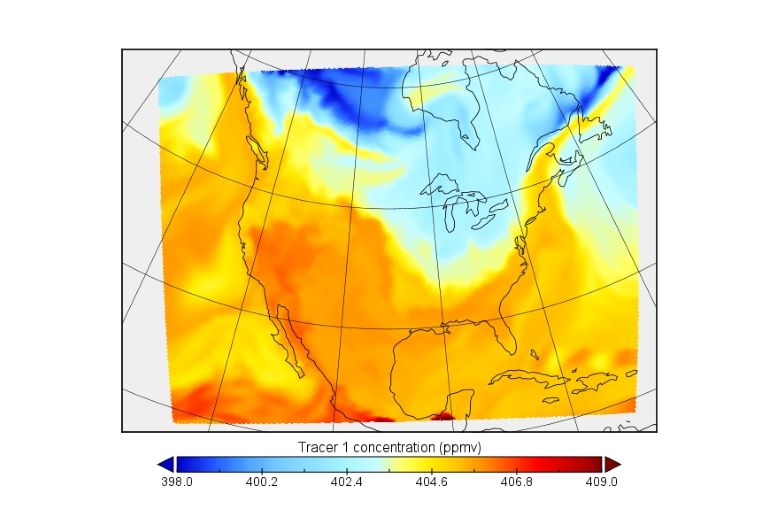
Figure 1. Simulated tracer 1 concentrations (ppmv) in vertical level 5 on 2016-06-29 at 12:00 pm. Output from WRF-Chem (v. 3.6.1) model. Source: wrfout_d01_2016-06-29_12:00:00.nc
Citation
Feng, S., T. Lauvaux, Z.R. Barkley, K.J. Davis, M.P. Butler, A. Deng, B. Gaudet, and D. Stauffer. 2021. ACT-America: WRF-Chem Baseline Simulations for North America, 2016-2019. ORNL DAAC, Oak Ridge, Tennessee, USA. https://doi.org/10.3334/ORNLDAAC/1884
Table of Contents
- Dataset Overview
- Data Characteristics
- Application and Derivation
- Quality Assessment
- Data Acquisition, Materials, and Methods
- Data Access
- References
Dataset Overview
This dataset includes hourly output from the WRF-Chem simulation model for North America at a resolution of 27 km for 2016-06-29 through 2019-07-31. WRF-Chem is the Weather Research and Forecasting (WRF) model coupled with Chemistry. The output provides baseline conditions for comparison to data from ACT-America airborne campaigns conducted to study atmospheric CO2 and CH4 from 2016 to 2019. The WRF-Chem (v. 3.6.1) model was driven by meteorological conditions and sea-surface temperatures. The output includes 50 vertical layers up to atmospheric pressure of 50 hPa with 20 levels in the lowest 1 km. It provides information for understanding the fluxes and atmospheric transport of carbon dioxide (CO2), methane (CH4), and ethane (C2H6).
The NASA Atmospheric Carbon and Transport (ACT) - America project conducted five airborne campaigns across three regions in the eastern United States to study the transport and fluxes of atmospheric carbon dioxide (CO2) and methane (CH4). Each six-week campaign measured how weather systems transport these greenhouse gases. The objective of the study is to enable more accurate and precise estimates of the sources and sinks of these gases.
Project: Atmospheric Carbon and Transport - America
The ACT-America, or Atmospheric Carbon and Transport - America, project is a NASA Earth Venture Suborbital-2 mission to study the transport and fluxes of atmospheric carbon dioxide and methane across three regions in the eastern United States. Flight campaigns measured transport of greenhouse gases by continental-scale weather systems. Ground-based measurements of greenhouse gases were also collected. Project goals include better estimates of greenhouse gas sources and sinks which are required for climate management and for prediction of future climate.
Related Publications
Feng, S., T., Lauvaux, C. A., Williams, K. J., Davis, Y., Zhou, I., Baker, et al. 2021. Joint CO2 mole fraction and flux analysis confirms missing processes in CASA terrestrial carbon uptake over North America. Global Biogeochemical Cycles, 35, e2020GB006914. https://doi.org/10.1029/2020GB006914
Feng, S., T. Lauvaux, K. Keller, K.J. Davis, P. Rayner, T. Oda, and K.R. Gurney. 2019. A Road Map for Improving the Treatment of Uncertainties in High-resolution Regional Carbon Flux Inverse Estimates. Geophysical Research Letters 46:13461–13469. https://doi.org/10.1029/2019GL082987
Acknowledgment
This work received financial support from NASA’s ACT-America program (grant NNX15AG76G).
Data Characteristics
Spatial Coverage: North America
Spatial Resolution: 27 km
Temporal Coverage: 2016-06-29 to 2019-07-31
Temporal Resolution: hourly
Study Area: Latitude and longitude are given in decimal degrees.
| Site | Northernmost Latitude | Southernmost Latitude | Easternmost Longitude | Westernmost Longitude |
|---|---|---|---|---|
| North America | 62.841 | 12.993 | -41.608 | 150.392 |
Data File Information
There are 27,037 data files in netCDF (*.nc) format included in this dataset. The files are named wrfout_d01_YYYY-MM-DD_hh:mm:ss.nc (e.g., wrfout_d01_2016-06-29_12:00:00.nc), where YYYY = year, MM = month, DD = day, hh = hour, mm = minute, and ss = second of data collection.
Data File Details
Missing values are variable and encoded in the metadata of each netCDF. Each file contains 184 rows and 249 columns. The Coordinate Reference System is "WGS84" (EPSG:4326).
Table 1. Variable names and descriptions. See documents provided at https://ruc.noaa.gov/wrf/wrf-chem/ for explanations of these 218 variables.
| Variable | Units | Description |
|---|---|---|
| ACGRDFLX | J m-2 | accumulated ground heat flux |
| ACSNOM | kg m-2 | accumulated melted snow |
| ALBBCK | 1 | background albedo |
| ALBEDO | 1 | albedo |
| ALPHA_VPRM | ||
| ALT | m3 kg-1 | inverse density |
| AVGFLX_RUM | Pa m s-1 | hist-time-averaged mu-coupled u |
| AVGFLX_RVM | Pa m s-1 | hist-time-averaged mu-coupled v |
| AVGFLX_WWM | Pa s-1 | hist-time-averaged mu-coupled eta-dot |
| BIOMT_PAR | g m-2 | biomass termite per vegetation type |
| CANWAT | kg m-2 | canopy water |
| CF1 | 1 | 2nd order extrapolation constant |
| CF2 | 1 | 2nd order extrapolation constant |
| CF3 | 1 | 2nd order extrapolation constant |
| CFD1 | kg m-2 s-1 | average downdraft mass flux from gd-scheme |
| CFN | 1 | extrapolation constant |
| CFN1 | 1 | extrapolation constant |
| CFU1 | kg m-2 s-1 | average updraft mass flux from gd-scheme |
| CLAT | degree_north | computational grid latitude |
| COSALPHA | 1 | local cosine of map rotation |
| COSZEN | 1 | cos of solar zenith angle |
| DFD1 | kg m-2 s-1 | average detrainment from downdraft from gd-scheme |
| DFU1 | kg m-2 s-1 | average detrainment from updraft from gd-scheme |
| DMS_0 | nM l-1 | dms oceanic concentrations |
| DN | 1 | d(eta) values between half (mass) levels |
| DNW | 1 | d(eta) values between full (w) levels |
| DZS | m | thicknesses of soil layers |
| E | s-1 | coriolis cosine latitude term |
| E_TRA1 | mol km-2 h-1 | Boundary tracer (zero) |
| E_TRA2 | mol km-2 h-1 | CT Miller fossil fuel emissions |
| E_TRA3 | mol km-2 h-1 | CT ODIAC fossil fuel emissions |
| E_TRA4 | mol km-2 h-1 | CT ocean fluxes |
| E_TRA5 | mol km-2 h-1 | CT fire emissions |
| E_TRA6 | mol km-2 h-1 | CT posterior biogenic fluxes |
| E_TRA7 | mol km-2 h-1 | CASA mean GPP |
| E_TRA8 | mol km-2 h-1 | CASA Para05 GPP |
| E_TRA9 | mol km-2 h-1 | CASA mean respiration |
| E_TRA10 | mol km-2 h-1 | CASA Para05 respiration |
| E_TRA11 | mol km-2 h-1 | SIB4 GPP |
| E_TRA12 | mol km-2 h-1 | SIB4 respiration |
| E_TRA13 | mol km-2 h-1 | EPA 2012 oil and gas |
| E_TRA14 | mol km-2 h-1 | EPA 2012 coal |
| E_TRA15 | mol km-2 h-1 | EPA 2012 enteric Fermentation and Manure management |
| E_TRA16 | mol km-2 h-1 | EPA 2012 landfills |
| E_TRA17 | mol km-2 h-1 | EPA 2012 other |
| E_TRA18 | mol km-2 h-1 | Anthropogenics outside US (Daniel Jacob Canada+Mexico for oil and gas, and EDGAR v. 4.3.2 for other) |
| E_TRA19 | mol km-2 h-1 | WetCHARTs V1.2 Extended ensemble (member 1913) |
| E_TRA20 | mol km-2 h-1 | WetCHARTs V1.2 Extended ensemble (member 1914) |
| E_TRA21 | mol km-2 h-1 | WetCHARTs V1.2 Extended ensemble (member 1923) |
| E_TRA22 | mol km-2 h-1 | CT-CH4 2010 |
| E_TRA23 | mol km-2 h-1 | CMS-CH4-NAD (averaged monthly) |
| E_TRA24 | mol km-2 h-1 | EDGAR v4.3.2 |
| E_TRA25 | mol km-2 h-1 | 2010 C2H6 Global Emissions Inventory (Tzompa Sosa) |
| EFD1 | kg m-2 s-1 | average entrainment into downdraft from gd-scheme |
| EFU1 | kg m-2 s-1 | average entrainment into updraft from gd-scheme |
| EMISS | 1 | surface emissivity |
| EMIT_PAR | 1 | |
| EROD | none | fraction of erodible surface in each grid cell (0-1) |
| F | s-1 | coriolis sine latitude term |
| FNM | 1 | upper weight for vertical stretching |
| FNP | 1 | lower weight for vertical stretching |
| GLW | W m-2 | downward long wave flux at ground surface |
| GRAUPELNC | mm | accumulated total grid scale graupel |
| GRDFLX | W m-2 | ground heat flux |
| GUST | m s-1 | gust at 10 m |
| HAILNC | mm | accumulated total grid scale hail |
| HFX | W m-2 | upward heat flux at the surface |
| HFX_FORCE | W m-2 | scm ideal surface sensible heat flux |
| HFX_FORCE_TEND | W m-2 s-1 | scm ideal surface sensible heat flux tendency |
| HGT | m | terrain height |
| ISLTYP | dominant soil category | |
| ITIMESTEP | 1 | I timestep |
| IVGTYP | dominant vegetation category | |
| LAI | 1 | leaf area index (m2 m-2) |
| LAI_VEGMASK | 1 | MODIS LAI vegetation mask for this date; 0=no dust produced (vegetation) |
| LAMBDA_VPRM | ||
| LANDMASK | 1 | land mask, 1=land |
| LH | W m-2 | latent heat flux at the surface |
| LH_FORCE | W m-2 | scm ideal surface latent heat flux |
| LH_FORCE_TEND | W m-2 s-1 | scm ideal surface latent heat flux tendency |
| LU_INDEX | land use category | |
| MAPFAC_M | 1 | map scale factor on mass grid |
| MAPFAC_MX | 1 | map scale factor on mass grid |
| MAPFAC_MY | 1 | map scale factor on mass grid |
| MAPFAC_U | 1 | map scale factor on u-grid |
| MAPFAC_UX | 1 | map scale factor on u-grid |
| MAPFAC_UY | 1 | map scale factor on u-grid |
| MAPFAC_V | 1 | map scale factor on v-grid |
| MAPFAC_VX | 1 | map scale factor on v-grid |
| MAPFAC_VY | 1 | map scale factor on v-grid |
| MAX_MSTFX | 1 | max map factor in domain |
| MAX_MSTFY | 1 | max map factor in domain |
| MF_VX_INV | 1 | inverse map scale factor on v-grid |
| MU | Pa | perturbation dry air mass in column |
| MUB | Pa | base state dry air mass in column |
| MUT | ||
| MUU | ||
| MUV | ||
| NEST_POS | ||
| NOAHRES | W m-2 | residual of the NOAH surface energy budget |
| OLR | W m-2 | TOA outgoing long wave |
| P | Pa | perturbation pressure |
| P_STRAT | Pa | base state pressure at bottom of stratosphere |
| P_TOP | Pa | pressure top of the model |
| P00 | Pa | base state pressure |
| PB | Pa | base state pressure |
| PBLH | m | pbl height |
| PH | m2 s-2 | perturbation geopotential |
| PHB | m2 s-2 | base-state geopotential |
| PREC_ACC_C | mm | accumulated cumulus precipitation over PREC_ACC_DT periods of time |
| PREC_ACC_NC | mm | accumulated grid scale precipitation over PREC_ACC_DT periods of time |
| PSFC | Pa | sfc pressure |
| Q2 | kg kg-1 | qv at 2 m |
| QCLOUD | 1 | cloud water mixing ratio (kg kg-1) |
| QFX | kg m-2 s-1 | upward moisture flux at the surface |
| QGRAUP | 1 | graupel mixing ratio (kg kg-1) |
| QICE | 1 | ice mixing ratio (kg kg-1) |
| QKE | m2 s-2 | twice TKE from mynn |
| QNICE | kg-1 | ice number concentration |
| QNRAIN | kg-1 | rain number concentration |
| QRAIN | 1 | rain water mixing ratio (kg kg-1) |
| QSNOW | 1 | snow mixing ratio (kg kg-1) |
| QVAPOR | 1 | water vapor mixing ratio (kg kg-1) |
| RAD_VPRM | ||
| RAINC | mm | accumulated total cumulus precipitation |
| RAINNC | mm | accumulated total grid scale precipitation |
| RAINSH | mm | accumulated shallow cumulus precipitation |
| RDN | 1 | inverse d(eta) values between half (mass) levels |
| RDNW | 1 | inverse d(eta) values between full (w) levels |
| RDX | 1 | inverse x grid length |
| RDY | 1 | inverse y grid length |
| RESM | 1 | time weight constant for small steps |
| RESP_VPRM | ||
| SAVE_TOPO_FROM_REAL | flag | flag, 1=original topo from real, 0=topo modified by WRF |
| SEAICE | flag | sea ice flag |
| SEED1 | 1 | random seed number 1 |
| SEED2 | 1 | random seed number 2 |
| SH2O | 1 | soil liquid water (m3 m-3) |
| SHDMAX | 1 | annual max veg fraction |
| SHDMIN | 1 | annual min veg fraction |
| SINALPHA | 1 | local sine of map rotation |
| SMCREL | 1 | relative soil moisture |
| SMOIS | 1 | soil moisture (m3 m-3) |
| SNOALB | 1 | annual max snow albedo in fraction |
| SNOW | kg m-2 | snow water equivalent |
| SNOW_ACC_NC | mm | accumulated snow water equivalent over prec_acc_dt periods of time |
| SNOWC | flag | flag indicating snow coverage, 1 = snow cover |
| SNOWH | m | physical snow depth |
| SNOWNC | mm | accumulated total grid scale snow and ice |
| SR | 1 | fraction of frozen precipitation |
| SST | K | sea surface temperature |
| SSTSK | K | skin sea surface temperature |
| SWDDIF | W m-2 | shortwave surface downward diffuse irradiance |
| SWDDIR | W m-2 | shortwave surface downward direct irradiance |
| SWDDNI | W m-2 | shortwave surface downward direct normal irradiance |
| SWDOWN | W m-2 | downward short wave flux at ground surface |
| SWNORM | W m-2 | normal short wave flux at ground surface (slope-dependent) |
| T | K | perturbation potential temperature (theta-t0) |
| T00 | K | base state temperature |
| T2 | K | temperature at 2 m |
| TH2 | K | pot temperature at 2 m |
| TISO | K | temp at which the base T turns const |
| TKE | m2 s-2 | turbulence kinetic energy |
| TKE_PBL | m2 s-2 | tke from pbl |
| TLP | 1 | base state lapse rate |
| TLP_STRAT | K | base state lapse rate (dt/d(ln(p)) in stratosphere |
| TMN | K | soil temperature at lower boundary |
| tracer_1 | ppmv | CO2 continental boundary inflow |
| tracer_2 | ppmv | CO2 signals due to CT Miller fossil fuel +300 |
| tracer_3 | ppmv | CO2 signals due to CT ODIAC fossil fuel +300 |
| tracer_4 | ppmv | CO2 signals due to CT ocean +300 |
| tracer_5 | ppmv | CO2 signals due to CT fire +300 |
| tracer_6 | ppmv | CO2 signals due to CT posterior biogenic +300 |
| tracer_7 | ppmv | CO2 signals due to CASA mean GPP +300 |
| tracer_8 | ppmv | CO2 signals due to CASA Para05 GPP +300 |
| tracer_9 | ppmv | CO2 signals due to CASA mean respiration +300 |
| tracer_10 | ppmv | CO2 signals due to CASA Para05 respiration +300 |
| tracer_11 | ppmv | CO2 signals due to SIB4 GPP +300 |
| tracer_12 | ppmv | CO2 signals due to SIB4 respiration +300 |
| tracer_13 | ppmv | (CH4 enhancement due to EPA 2012 oil and gas) x 109 + 300 |
| tracer_14 | ppmv | (CH4 enhancement due to EPA 2012 coal) x 109 + 300 |
| tracer_15 | ppmv | (CH4 enhancement due to EPA 2012 enteric Fermentation and Manure management) x 109 + 300 |
| tracer_16 | ppmv | (CH4 enhancement due to EPA 2012 landfills) x 109 + 300 |
| tracer_17 | ppmv | (CH4 enhancement due to EPA 2012 other) x 109 + 300 |
| tracer_18 | ppmv | (CH4 enhancement due to Anthropogenics outside US (Daniel Jacob Canada+Mexico for oil and gas, and EDGAR v4.3.2 for other) ) x 109 + 300 |
| tracer_19 | ppmv | (CH4 enhancement due to WetCHARTs V1.2 Extended ensemble (member 1913) ) x 109 + 300 |
| tracer_20 | ppmv | (CH4 enhancement due to WetCHARTs V1.2 Extended ensemble (member 1914) ) x 109 + 300 |
| tracer_21 | ppmv | (CH4 enhancement due to WetCHARTs V1.2 Extended ensemble (member 1923) ) x 109 + 300 |
| tracer_22 | ppmv | (CH4 enhancement due to CT-CH4 2010) x 109 + 300 |
| tracer_23 | ppmv | (CH4 enhancement due to CMS-CH4-NAD (averaged monthly) ) x 109 + 300 |
| tracer_24 | ppmv | (CH4 enhancement due to EDGAR v4.3.2) x 109 + 300 |
| tracer_25 | ppmv | (C2H6 enhancement due to 2010 C2H6 Global Emissions Inventory (Tzompa Sosa) ) x 109 + 300 |
| TSK | K | surface skin temperature |
| TSK_FORCE | W m-2 | scm ideal surface skin temperature |
| TSK_FORCE_TEND | W m-2 s-1 | scm ideal surface skin temperature tendency |
| TSLB | K | soil temperature |
| U | m s-1 | x-wind component |
| U10 | m s-1 | u at 10 m |
| UST | m s-1 | u* in similarity theory |
| UST_T | m s-1 | threshold friction velocity |
| V | m s-1 | y-wind component |
| V10 | m s-1 | v at 10 m |
| VAR | 1 | orographic variance |
| VAR_SSO | m2 | variance of subgrid-scale orography |
| VEGFRA | 1 | vegetation fraction |
| W | m s-1 | z-wind component |
| XLAND | flag | land mask, 1= land |
| XLAT | degree_north | latitude |
| XLAT_U | degree_north | latitude |
| XLAT_V | degree_north | latitude |
| XLONG | degree_east | longitude |
| XLONG_U | degree_east | longitude |
| XLONG_V | degree_east | longitude |
| XTIME | min | minutes since simulation start |
| ZETATOP | 1 | zeta at model top |
| ZNU | 1 | eta values on half (mass) levels |
| ZNW | 1 | eta values on full (w) levels |
| ZS | m | depths of centers of soil layers |
- To calculate total CT CO2 mole fractions, CO2_total (ppm) = tracer_1 + (tracer_2 + tracer_3)/2 – 300 + tracer_4 -300. + tracer_5-300. + tracer_6-300.
- CH4 and C2H6 tracers only provide the enhancement, not the mole fraction, and there are no boundary conditions in the model run.
- To calculate total anthropogenic CH4, add together tracers 13-18 (subtracting off 300 from each) and then divide by 1e9 to get an enhancement in ppm.
Application and Derivation
ACT-America, or Atmospheric Carbon and Transport - America, conducted five airborne campaigns across three regions in the eastern United States to study the transport and fluxes of atmospheric carbon. The eastern half of the United States is a region that includes a highly productive biosphere, vigorous agricultural activity, extensive gas and oil extraction and consumption, dynamic, seasonally varying weather patterns and the most extensive carbon cycle and meteorological observing networks on Earth, serves as an ideal setting for the mission.
Each 6-week campaign accurately and precisely quantified anomalies in atmospheric carbon, also known as carbon flux. Accurate carbon flux data is necessary to address all terrestrial carbon cycle science questions. ACT-America addressed the three primary sources of uncertainty in atmospheric inversions—transport error, prior flux uncertainty, and limited data density.
ACT-America advances society’s ability to predict and manage future climate change by enabling policy-relevant quantification of the carbon cycle. Sources and sinks of atmospheric carbon dioxide (CO2) and methane (CH4) are poorly known at regional to continental scales. ACT-America enables and demonstrates a new generation of atmospheric inversion systems for quantifying CO2 and CH4 sources and sinks.
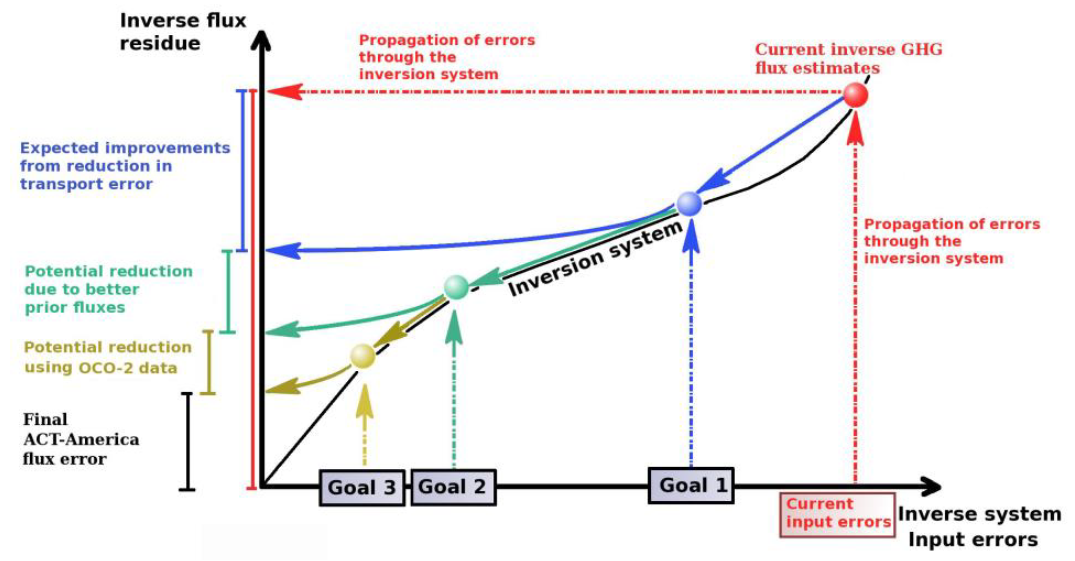
Figure 2. A schematic showing ACT-America mission goals.
ACT-America Goals:
- To quantify and reduce atmospheric transport uncertainties.
- To improve regional-scale, seasonal prior estimates of CO2 and CH4 fluxes.
- To evaluate the sensitivity of Orbiting Carbon Observatory (OCO-2) column measurements to regional variability in tropospheric CO2.
ACT-America achieved these goals by deploying airborne and ground-based platforms to obtain data that were combined with data from existing measurement networks and integrated with an ensemble of atmospheric inversion systems. Aircraft instrumented with remote and in-situ sensors observed how mid-latitude weather systems interact with CO2 and CH4 sources and sinks to create atmospheric CO2/CH4 distributions. A model ensemble consisting of a mesoscale atmospheric transport model with multiple physics and resolutions options nested within global inversion models and surface CO2/CH4 flux ensembles was used to predict atmospheric CO2 and CH4 distributions.
Beyond the conclusion of the mission, the application of knowledge gained from this mission will improve diagnoses of the carbon cycle across the globe for decades.
Quality Assessment
This dataset includes replication in space, time, and within model runs to allow users to compute relevant measures of variability and uncertainty. See Feng et al. (2019a; 2019b; 2021) for studies of uncertainty based on these WRF-Chem simulations.
Data Acquisition, Materials, and Methods
The objective of the study was to enable more accurate and precise estimates of the sources and sinks of greenhouse gases in order to support development of climate-focused management strategies and for prediction of future climate conditions. ACT-America addresses three primary sources of uncertainty in carbon dioxide and methane sources and sinks by accounting for transport error, prior flux uncertainty and limited data density. This WRF-Chem simulation is the baseline simulation in support of related research by the ACT-America team and broader scientific community. It serves as complementary information to the ACT-America field measurements and helps scientists interpret the data with a broader context in space and time.
These simulations were run with WRF-Chem version 3.6.1 (Grell et al., 2005; Skamarock et al., 2005) with the tracer modification described in Lauvaux et al. (2012). Specifically, fluxes from the CarbonTracker (Peters et al., 2007) CO2 components, CASA biogenic fluxes (Zhou et al., 2019), SiB4 biogenic fluxes (Haynes et al., 2019a, 2019b), CH4 EPA emissions (Maasakkers et al., 2016), CH4 wetland emissions (from WETCharts), CarbonTracker CH4, EDGAR (Janssens-Maenhout et al., 2019), and updated ethane (C2H6) emissions inventory (Tzompa-Sosa et al., 2017) were included.
The simulation domain contains most of North America at 27 km horizontal resolution. The model has 50 vertical levels up to 50 hPa, with 20 levels in the lowest 1 km. The model meteorology was initialized every five days and driven with ERA5 reanalysis every six hours at 25 km horizontal resolution. The WRF-Chem dynamic was relaxed to ERA5 meteorology every six hours using grid nudging. Sea surface temperature was updated every six hours at 12 km resolution. Choices of the model physics parameterizations used in this experiment are documented as the baseline setup in Feng et al. (2019a; 2019b; 2021).
Data Access
These data are available through the Oak Ridge National Laboratory (ORNL) Distributed Active Archive Center (DAAC).
ACT-America: WRF-Chem Baseline Simulations for North America, 2016-2019
Contact for Data Center Access Information:
- E-mail: uso@daac.ornl.gov
- Telephone: +1 (865) 241-3952
References
Feng, S., T. Lauvaux, K. Keller, K.J. Davis, P. Rayner, T. Oda, and K.R. Gurney. 2019. A Road Map for Improving the Treatment of Uncertainties in High-resolution Regional Carbon Flux Inverse Estimates. Geophysical Research Letters 46:13461–13469. https://doi.org/10.1029/2019GL082987
Feng, S., T. Lauvaux, K.J. Davis, K. Keller, Y. Zhou, C. Williams, A.E. Schuh, J. Liu, and I. Baker. 2019. Seasonal characteristics of model uncertainties from biogenic fluxes, transport, and large-scale boundary inflow in atmospheric CO2 simulations over North America. Journal of Geophysical Research: Atmospheres 124:14325–14346. https://doi.org/10.1029/2019JD031165
Feng, S., T., Lauvaux, C. A., Williams, K. J., Davis, Y., Zhou, I., Baker, et al. 2021. Joint CO2 mole fraction and flux analysis confirms missing processes in CASA terrestrial carbon uptake over North America. Global Biogeochemical Cycles, 35, e2020GB006914. https://doi.org/10.1029/2020GB006914
Grell G.A., S.E. Peckham, R. Schmitz, and S.A. McKeen, G. Frost, W.C. Skamarock, and B. Eder. 2005. Fully-coupled online chemistry within the WRF model. Atmospheric Environment 39:6957-6975. https://doi.org/10.1016/j.atmosenv.2005.04.027
Haynes, K.D., I.T. Baker, A.S. Denning, R. Stöckli, K. Schaefer, E.Y. Lokupitiya, and J.M. Haynes. 2019. Representing grasslands using dynamic prognostic phenology based on biological growth stages: 1. Implementation in the Simple Biosphere Model (SiB4). Journal of Advances in Modeling Earth Systems 11:4423–4439. https://doi.org/10.1029/2018MS001540
Haynes, K.D., I.T. Baker, A.S. Denning, S. Wolf, G. Wohlfahrt, G. Kiely, R.C. Minaya, and J.M. Haynes. 2019. Representing grasslands using dynamic prognostic phenology based on biological growth stages: Part 2. Carbon Cycling. Journal of Advances in Modeling Earth Systems 11:4440–4465. https://doi.org/10.1029/2018MS001541
Janssens-Maenhout, G., M. Crippa, D. Guizzardi, M. Muntean, E. Schaaf, F. Dentener, P. Bergamaschi, V. Pagliari, J.G. J. Olivier, J.A. H.W. Peters, J.A. van Aardenne, S. Monni, U. Doering, A.M. R. Petrescu, E. Solazzo, and G.D. Oreggioni. 2019. EDGAR v4.3.2 Global Atlas of the three major greenhouse gas emissions for the period 1970–2012. Earth System Science Data 11:959–1002. https://doi.org/10.5194/essd-11-959-2019
Lauvaux, T., A.E. Schuh, M. Uliasz, S. Richardson, N. Miles, A.E. Andrews, C. Sweeney, L.I. Diaz, D. Martins, P.B. Shepson, and K.J. Davis. 2012. Constraining the CO2 budget of the corn belt: exploring uncertainties from the assumptions in a mesoscale inverse system. Atmospheric Chemistry and Physics 12:337–354. https://doi.org/10.5194/acp-12-337-2012
Maasakkers, J.D., D.J. Jacob, M.P. Sulprizio, A.J. Turner, M. Weitz, T. Wirth, C. Hight, M. DeFigueiredo, M. Desai, R. Schmeltz, L. Hockstad, A.A. Bloom, K.W. Bowman, S. Jeong, and M.L. Fischer. 2016. Gridded national inventory of U.S. methane emissions. Environmental Science & Technology 50:13123–13133. https://doi.org/10.1021/acs.est.6b02878
Peters, W., A.R. Jacobson, C. Sweeney, A.E. Andrews, T.J. Conway, K. Masarie, J.B. Miller, L.M. P. Bruhwiler, G. Petron, A.I. Hirsch, D.E. J. Worthy, G.R. van der Werf, J.T. Randerson, P.O. Wennberg, M.C. Krol, and P.P. Tans. 2007. An atmospheric perspective on North American carbon dioxide exchange: CarbonTracker. Proceedings of the National Academy of Sciences 104:18925–18930. https://doi.org/10.1073/pnas.0708986104
Skamarock, W.C., J.B. Klemp, J. Dudhia, D.O. Gill, D.M. Barker, W. Wang, and J.G. Powers. 2005. A description of the Advanced Research WRF Version 2. National Center of Atmospheric Research, Boulder, CO, USA. http://dx.doi.org/10.5065/D6DZ069T
Tzompa-Sosa, Z.A., E. Mahieu, B. Franco, C.A. Keller, A.J. Turner, D. Helmig, A. Fried, D. Richter, P. Weibring, J. Walega, T.I. Yacovitch, S.C. Herndon, D.R. Blake, F. Hase, J.W. Hannigan, S. Conway, K. Strong, M. Schneider, and E.V. Fischer. 2017. Revisiting global fossil fuel and biofuel emissions of ethane. Journal of Geophysical Research: Atmospheres 122:2493–2512. https://doi.org/10.1002/2016JD025767
Zhou, Y., C.A. Williams, T. Lauvaux, K.J. Davis, S. Feng, I. Baker, S. Denning, and Y. Wei. 2020. A multiyear gridded data ensemble of surface biogenic carbon fluxes for North America: evaluation and analysis of results. Journal of Geophysical Research: Biogeosciences 125. https://doi.org/10.1029/2019JG005314