Documentation Revision Date: 2021-02-02
Dataset Version: 1.2
Summary
ACT-America's overall mission spanned five years and included field campaigns covering all four seasons over central and eastern regions of the United States. ACT-America's objectives were to study the transport and fluxes of atmospheric CO2 and CH4. Two instrumented aircraft platforms, the NASA Langley Beechcraft B-200 King Air and the NASA Wallops Flight Facility's C-130 Hercules, were used to collect high-quality in-situ measurements across a variety of continental surfaces and atmospheric conditions. At times they flew directly under Orbiting Carbon Observatory-2 (OCO-2) overpasses to evaluate the ability of OCO-2 to observe high-resolution atmospheric CO2 variations. The C-130 aircraft was also equipped with active remote sensing instruments for planetary boundary layer height detection and column greenhouse gas measurements.
This dataset contains 390 data files total; 195 files in netCDF (*.nc) format and 195 data files in ICARTT (*.ict) format. Each netCDF file has a corresponding file in ICARTT format that has identical trace gas data but the ICARTT file contains no aircraft navigation or meteorological data.
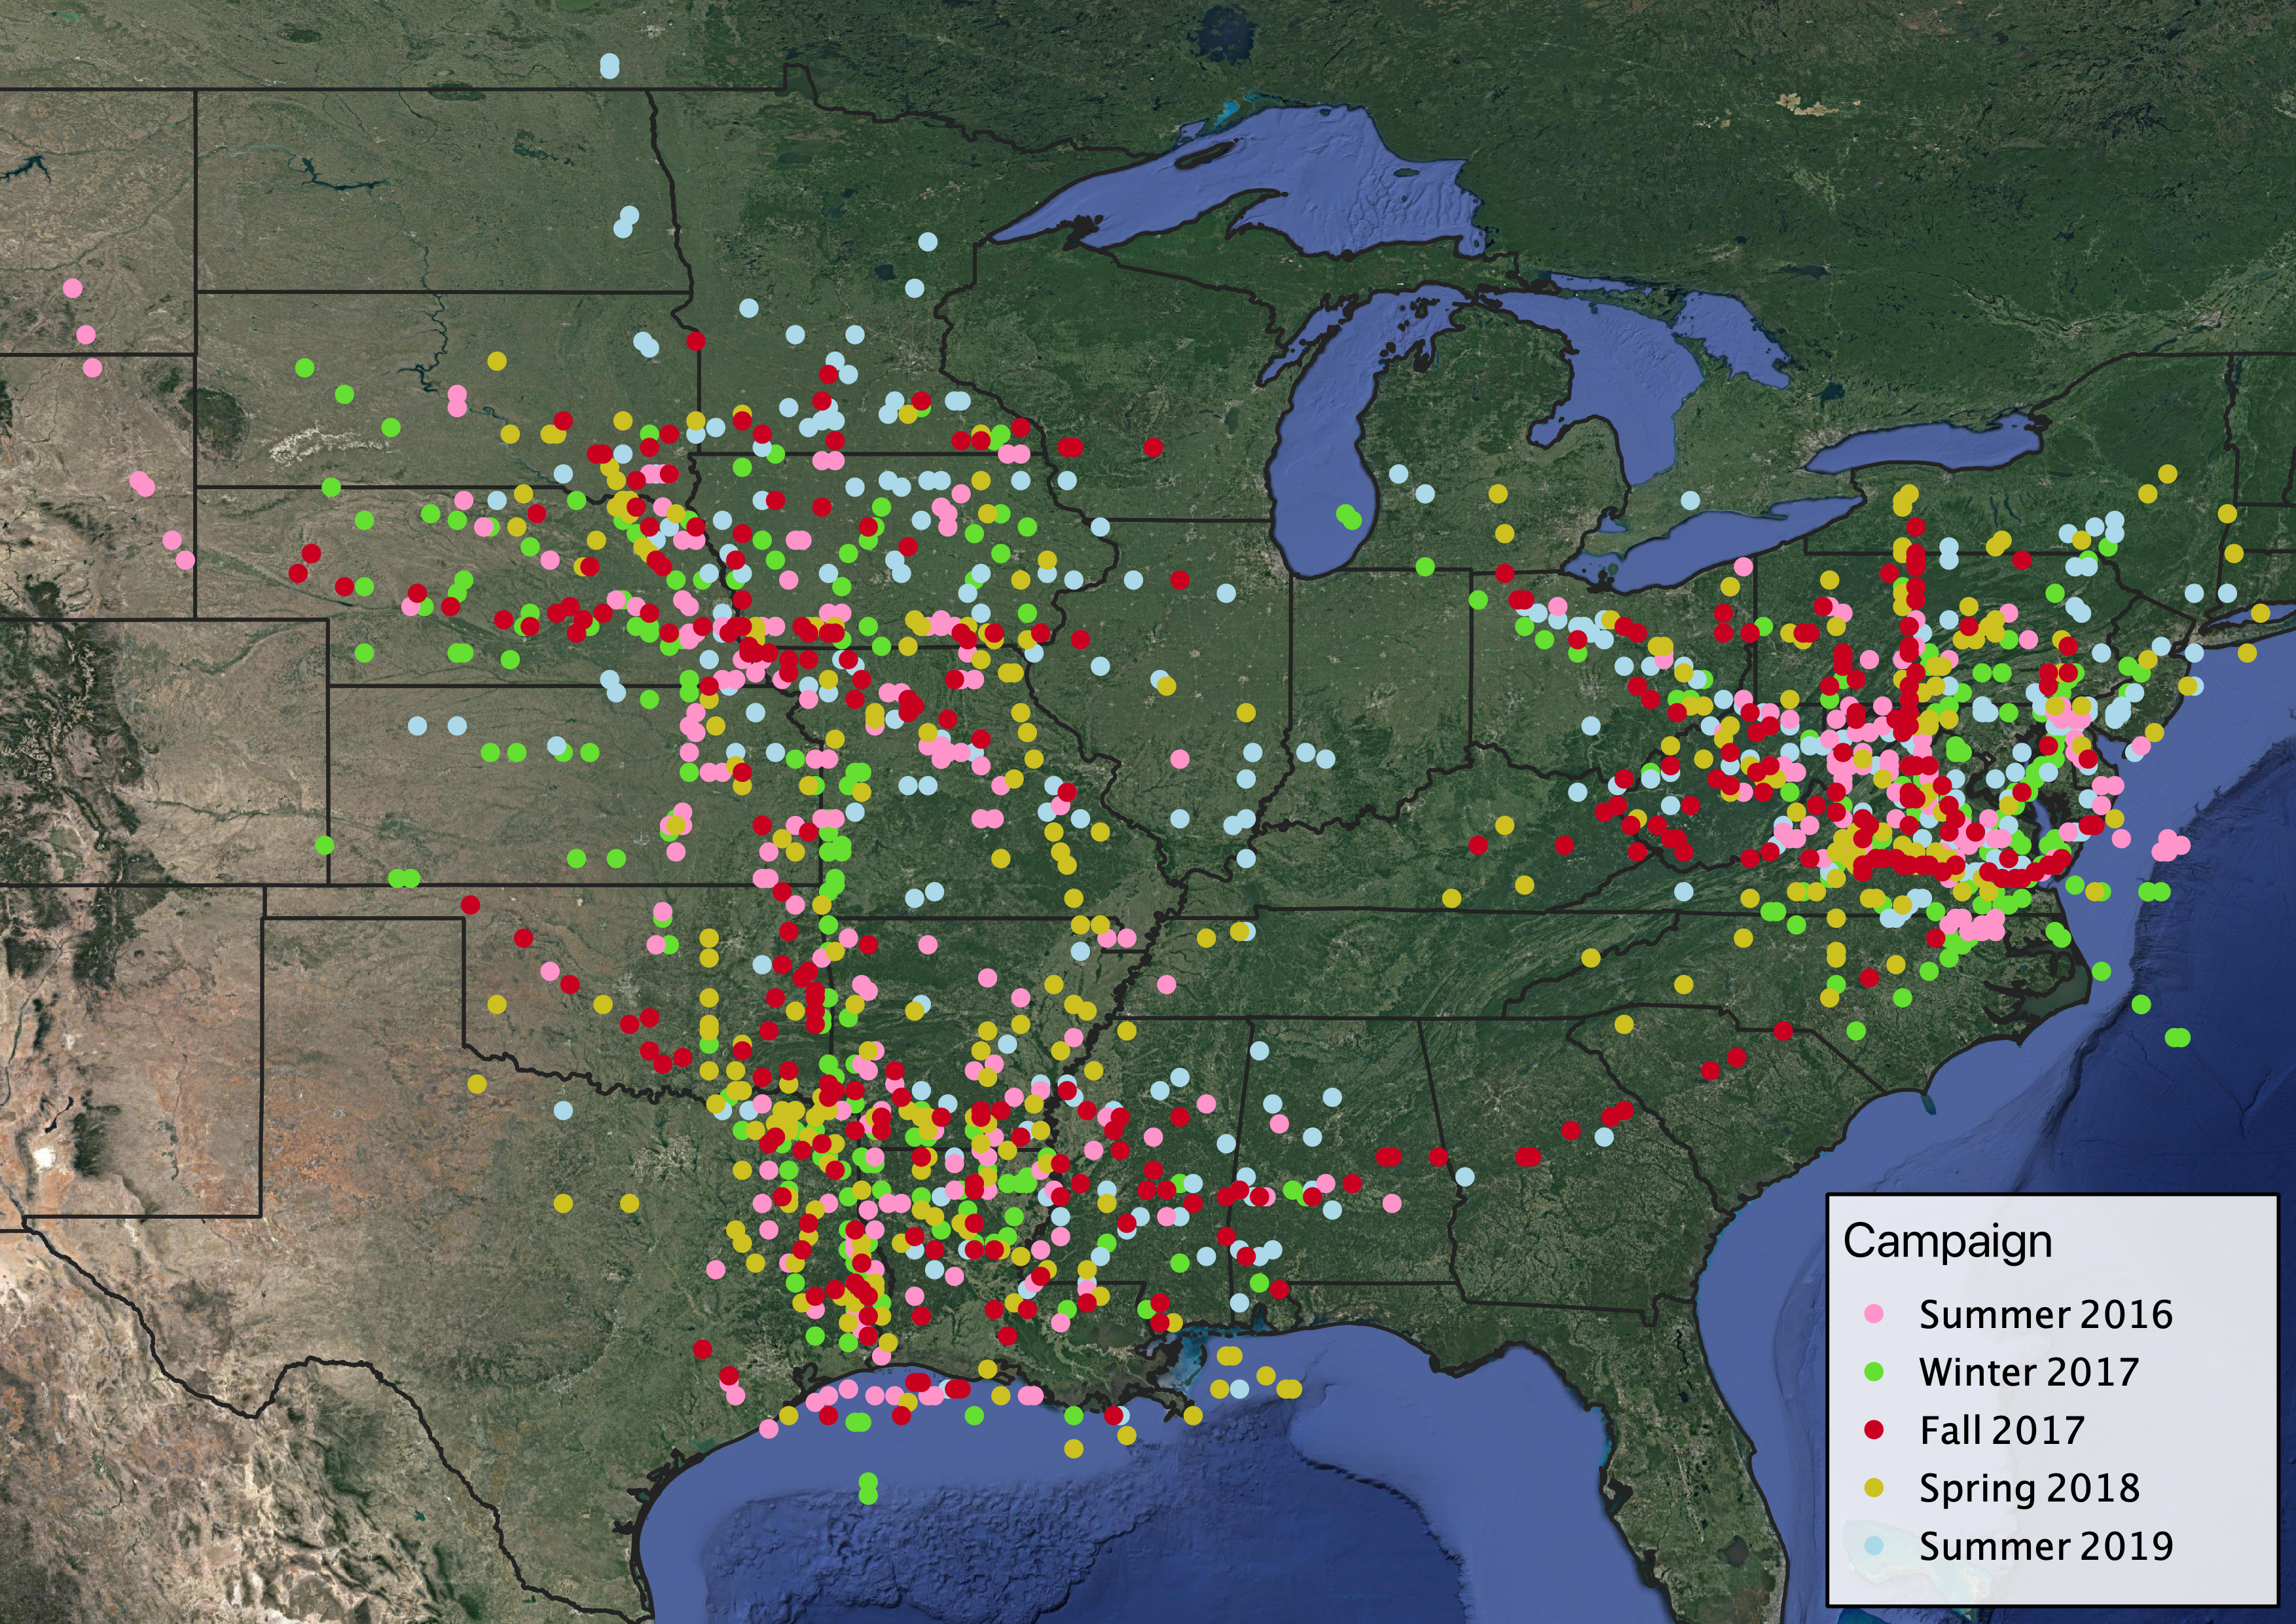
Figure 1. Locations of ACT-America flask air samples collected during all five airborne campaigns from 2016 to 2019.
Citation
Sweeney, C., B.C. Baier, J.B. Miller, P. Lang, B.R. Miller, S. Lehman, S.E. Michel, and M.M. Yang. 2018. ACT-America: L2 In Situ Atmospheric Gas Concentrations from Flasks, Eastern USA. ORNL DAAC, Oak Ridge, Tennessee, USA. https://doi.org/10.3334/ORNLDAAC/1575
Table of Contents
- Dataset Overview
- Data Characteristics
- Application and Derivation
- Quality Assessment
- Data Acquisition, Materials, and Methods
- Data Access
- References
- Dataset Revisions
Dataset Overview
This dataset provides atmospheric carbon dioxide (CO2), methane (CH4), carbon monoxide (CO), molecular hydrogen (H2), nitrous oxide (N2O), sulfur hexafluoride (SF6), and other trace gas mole fractions (i.e., concentrations) from airborne campaigns over North America for the NASA Atmospheric Carbon and Transport - America (ACT-America) project. ACT-America's mission spanned five years and includes five six-week field campaigns covering all four seasons and three regions of the central and eastern United States. Two instrumented aircraft platforms, the NASA Langley Beechcraft B-200 King Air and the NASA Goddard Space Flight Center's C-130 Hercules, were used to collect high-quality in situ measurements across a variety of continental surfaces and atmospheric conditions. The data were derived from laboratory measurements of whole air samples collected by Programmable Flask Packages (PFP) onboard the two ACT-America aircraft. Approximately 10 - 12 discrete flask samples were captured during each of the 195 flights. This dataset provides results from all five campaigns, including Summer 2016, Winter 2017, Fall 2017, Spring 2018, and Summer 2019.
ACT-America's overall mission spanned five years and included field campaigns covering all four seasons over central and eastern regions of the United States. ACT-America's objectives were to study the transport and fluxes of atmospheric CO2 and CH4. Two instrumented aircraft platforms, the NASA Langley Beechcraft B-200 King Air and the NASA Wallops Flight Facility's C-130 Hercules, were used to collect high-quality in-situ measurements across a variety of continental surfaces and atmospheric conditions. At times they flew directly under Orbiting Carbon Observatory-2 (OCO-2) overpasses to evaluate the ability of OCO-2 to observe high-resolution atmospheric CO2 variations. The C-130 aircraft was also equipped with active remote sensing instruments for planetary boundary layer height detection and column greenhouse gas measurements.
Project: Atmospheric Carbon and Transport - America
The ACT-America, or Atmospheric Carbon and Transport - America, project was a NASA Earth Venture Suborbital-2 mission to study the transport and fluxes of atmospheric carbon dioxide and methane across three regions in the eastern United States. ACT-America conducted five flight campaigns spanning all four seasons throughout 2016—2019 and measured how weather systems transported greenhouse gases. Ground-based measurements were also collected. The objective of the study was to enable more accurate and precise estimates of the sources and sinks of greenhouse gases, as better estimates are needed for climate management and for prediction of future climate. Three primary sources of uncertainty (i.e., transport error, prior flux uncertainty, and limited data density) were addressed to improve the inference of carbon dioxide and methane sources and sinks.
Related Publication
Sweeney, C., A. Karion, S. Wolter, T. Newberger, D. Guenther, J. A. Higgs, A. E. Andrews, P. M. Lang, D. Neff, E. Dlugokencky, J. B. Miller, S. A. Montzka, B. R. Miller, K. A. Masarie, S. C. Biraud, P. C. Novelli, M. Crotwell, A. M. Crotwell, K. Thoning, and P. P. Tans. 2015. Seasonal climatology of CO2 across North America from aircraft measurements in the NOAA/ESRL Global Greenhouse Gas Reference Network. Journal of Geophysical Research: Atmospheres 120:5155–5190. https://doi.org/10.1002/2014JD022591
Related Datasets
Davis, K.J., M.D. Obland, B. Lin, T. Lauvaux, C. O'Dell, B. Meadows, E.V. Browell, J.P. DiGangi, C. Sweeney, M.J. McGill, J.D. Barrick, A.R. Nehrir, M.M. Yang, J.R. Bennett, B.C. Baier, A. Roiger, S. Pal, T. Gerken, A. Fried, S. Feng, R. Shrestha, M.A. Shook, G. Chen, L.J. Campbell, Z.R. Barkley, and R.M. Pauly. 2018. ACT-America: L3 Merged In Situ Atmospheric Trace Gases and Flask Data, Eastern USA. ORNL DAAC, Oak Ridge, Tennessee, USA. https://doi.org/10.3334/ORNLDAAC/1593
Pal, S. 2019. ACT-America: Profile-based Planetary Boundary Layer Heights, Eastern USA. ORNL DAAC, Oak Ridge, Tennessee, USA. https://doi.org/10.3334/ORNLDAAC/1706
Yang, M.M., J.D. Barrick, C. Sweeney, J.P. Digangi, and J.R. Bennett. 2018. ACT-America: L1 Meteorological and Aircraft Navigational Data. ORNL DAAC, Oak Ridge, Tennessee, USA. https://doi.org/10.3334/ORNLDAAC/1574
Acknowledgments
This work was supported by NASA EVS-2 grant number NNX15AG76G.
Data Characteristics
Spatial Coverage: Flights over eastern and central United States
Spatial Resolution: Point measurements
Temporal Coverage: Periodic flights occurred during each intensive campaign
| Campaign | Beginning and Ending Dates |
|---|---|
| Summer 2016 | 2016-07-11 to 2016-08-28 |
| Winter 2017 | 2017-01-21 to 2017-03-10 |
| Fall 2017 | 2017-10-03 to 2017-11-13 |
| Spring 2018 | 2018-04-12 to 2018-05-20 |
| Summer 2019 | 2019-06-17 to 2019-07-27 |
Temporal Resolution: Approximately 10–12 flask samples were captured during each flight
Study Area: Latitude and longitude are given in decimal degrees.
| Site | Northernmost Latitude | Southernmost Latitude | Westernmost Longitude | Easternmost Longitude |
|---|---|---|---|---|
| Eastern and Central United States | 49.403 | 27.802 | -104.237 | -72.942 |
Data File Information
This dataset contains 390 data files total; 195 files in netCDF (*.nc) format and 195 data files in ICARTT (*.ict) format. Each netCDF file has a corresponding file in ICARTT format that has identical trace gas data but the ICARTT file contains no aircraft navigation or meteorological data.
NetCDF files follow the standards of the NetCDF Climate and Forecast (CF) Metadata Conventions V1.6. Variables are structured as GeoTrajectory, where the observations for a flight segment are connected along a one-dimensional track in space and with time increasing monotonically along the track. These files contain gas concentrations and data from the respective aircraft’s flight navigation system and meteorological instruments for approximately 10–12 discrete flask samples collected during each of the 195 flights.
ICARTT files follow ICARTT File Format Standards V1.1. The ICARTT files contain the same gas concentration data as the netCDF files (i.e., Start_UTC, Stop_UTC, Mid_UTC, gas concentrations) but no navigational or meteorological information.
Companion File Information
Additional information on the aircraft platforms deployed by ACT-America is provided in Platform_B200.pdf and Platform_C130.pdf.
Data File Details
File Naming Convention
Files are organized by instrument and aircraft for the flights on a given date. The naming convention is the same for netCDF and ICARTT files. Files are named according to the format ACTAMERICA-PFP-<aircraft>_<YYYYMMDD>_<R#>_<L#>.<ext> (e.g., ACTAMERICA-PFP_C130_20190727_R0.nc), where
<aircraft> is either 'B200' or 'C130',
<YYYYMMDD> is the flight date in UTC time,
<R#> is the revision number of the data, where a higher number indicates a more recent revision (e.g., R1 = first revision),
<L#> is the launch number as some flights had more than one launch (e.g., L1 = first launch),
<ext> is the file extension, either '.nc' (netCDF) or '.ict' (ICARTT).
Quality Flags
Missing values: All missing data are flagged with a value of -9999.
LOD flags: If a reported result is a Limit of Detection (LOD) value for a given measurement, the value is marked with a LOD flag.
- Measurements above the upper LOD are flagged with -7777.
- Measurements below the lower LOD are flagged with -8888.
The measurement upper and lower LOD values (or N/A) are provided in the netCDF global attributes and ICARTT header as applicable.
Table 1. Names and descriptions for flask variables. These variables are present in both netCDF and ICARTT files.
| Variable Name | Units | Description |
|---|---|---|
| CHLF_MoleFraction_PFP | part per trillion | Chloroform mole fraction |
| BRFM_MoleFraction_PFP | part per trillion | BRFM mole fraction |
| C2H6_CAMS2 | part per trillion | Ethane mole fraction |
| CCl4_MoleFraction_PFP | part per trillion | CCI4 mole fraction |
| CS2_MoleFraction_PFP | part per trillion | CS2 mole fraction |
| F112_MoleFraction_PFP | part per trillion | F112 mole fraction |
| F124_MoleFraction_PFP | part per trillion | F124 mole fraction |
| F141B_MoleFraction_PFP | part per trillion | Dichlorofluoroethane mole fraction |
| HF21_MoleFraction_PFP | part per trillion | HF21 mole fraction |
| NF3_MoleFraction_PFP | part per trillion | NF3 mole fraction |
| SF6_MoleFraction_PFP | part per trillion | Sulfur Hexafloride mole fraction |
| HF22_MoleFraction_PFP | part per trillion | HF22 mole fraction |
| nC6H14_MoleFraction_PFP | part per trillion | n-Hexane mole fraction |
| PCE_MoleFraction_PFP | part per trillion | Perchloroethylene mole fraction |
| SF6_CCGG_MoleFraction_PFP | part per trillion | Sulfur Hexafloride mole fraction |
| BENZ_MoleFraction_PFP | part per trillion | Benzene mole fraction |
| C2F6_MoleFraction_PFP | part per trillion | Hexafluorethane mole fraction |
| C2H2_MoleFraction_PFP | part per trillion | Acetylene mole fraction |
| C2H6_MoleFraction_PFP | part per trillion | Ethane mole fraction |
| C3H8_MoleFraction_PFP | part per trillion | Propane mole fraction |
| CF4_MoleFraction_PFP | part per trillion | Carbon Tetrafloride mole fraction |
| CH2BrCl_MoleFraction_PFP | part per trillion | Bromochloromethane mole fraction |
| CH3I_MoleFraction_PFP | part per trillion | Methyl Iodide mole fraction |
| CH4_MoleFraction_PFP | part per billion | Methane mole fraction |
| CH4C13_PFP | part per million | C-13 of CH4 |
| CO_MoleFraction_PFP | part per billion | Carbon Monoxide mole fraction |
| CO2_MoleFraction_PFP | part per million | Carbon Dioxide mole fraction |
| DIBR_MoleFraction_PFP | part per trillion | Dibromomethane mole fraction |
| DICL_MoleFraction_PFP | part per trillion | Dimethyl Chloride mole fraction |
| F113_MoleFraction_PFP | part per trillion | F113 mole fraction |
| F115_MoleFraction_PFP | part per trillion | F115 mole fraction |
| F11B_MoleFraction_PFP | part per trillion | F11 mole fraction |
| F125_MoleFraction_PFP | part per trillion | Pentafluoroethane mole fraction |
| F13_MoleFraction_PFP | part per trillion | F13 mole fraction |
| F134A_MoleFraction_PFP | part per trillion | Tetrafluoroethane mole fraction |
| F143a_MoleFraction_PFP | part per trillion | 1-1-1-Trifluoroethane mole fraction |
| F152A_MoleFraction_PFP | part per trillion | 1-1-Difluoroethane mole fraction |
| F227e_MoleFraction_PFP | part per trillion | F227 mole fraction |
| F23_MoleFraction_PFP | part per trillion | Fluoroform mole fraction |
| F236fa_MoleFraction_PFP | part per trillion | F236fa mole fraction |
| F32_MoleFraction_PFP | part per trillion | F32 mole fraction |
| F365m_MoleFraction_PFP | part per trillion | Pentafluorobutane mole fraction |
| FC12_MoleFraction_PFP | part per trillion | FC12 mole fraction |
| H1211_MoleFraction_PFP | part per trillion | Halon 1211 mole fraction |
| H1301_MoleFraction_PFP | part per trillion | Halon 1301 mole fraction |
| H2_MoleFraction_PFP | part per billion | Hydrogen mole fraction |
| H2402_MoleFraction_PFP | part per trillion | Halon 2402 mole fraction |
| HF133a_MoleFraction_PFP | part per trillion | HF133a mole fraction |
| iC4H10_MoleFraction_PFP | part per trillion | isoButane mole fraction |
| iC5H12_MoleFraction_PFP | part per trillion | isoPentane mole fraction |
| MCFA_MoleFraction_PFP | part per trillion | MCFA mole fraction |
| MEBR_MoleFraction_PFP | part per trillion | Methyl Bromide mole fraction |
| MECL_MoleFraction_PFP | part per trillion | Methyl Chloride mole fraction |
| N2O_MoleFraction_PFP | part per billion | Nitrous Oxide mole fraction |
| nC4H10_MoleFraction_PFP | part per trillion | neoButane mole fraction |
| nC5H12_MoleFraction_PFP | part per trillion | neoPentane mole fraction |
| OCS_MoleFraction_PFP | part per trillion | Carbonyl Sulfide mole fraction |
| P218_MoleFraction_PFP | part per trillion | P218 mole fraction |
| SO2F2_MoleFraction_PFP | part per trillion | Sulfuryl Fluoride mole fraction |
| TCE_MoleFraction_PFP | part per trillion | Trichloroethylene mole fraction |
| TOL_MoleFraction_PFP | part per trillion | Toluene mole fraction |
Table 2. Names and descriptions of navigation and meteorological variables. These variables are present in only netCDF files.
| Variable Name | Units | Description |
|---|---|---|
| time | seconds | seconds since 2016-01-01 00:00:00.0 UTC |
| time_bnds | boundary (start and end time) of each time step | |
| Start_UTC | seconds | start UTC time of day for measurement |
| Stop_UTC | seconds | stop UTC time of day for measurement interval |
| Mid_UTC | seconds | mean UTC time of day of measurement interval |
| Flight_ID | Flight identification (aircraft and flight date) | |
| Aircraft_Sun_Azimuth | degree | Platform azimuth angle |
| Aircraft_Sun_Elevation | degree | Solar elevation angle |
| Cabin_Pressure | millibars | Air pressure of cabin |
| Day_of_Year | day | Day of year starting Jan 1 UTC |
| Dew_Point | Celsius | Dew point temperature |
| Drift_Angle | degree | Drift angle |
| GPS_Altitude | meters | Global Positioning System altitude |
| GPS_Time | hours since 2016-01-01 00:00:00.0 UTC | Time |
| Ground_Speed | meters per second | Platform speed with respect to ground |
| Indicated_Air_Speed | knots | Indicated airspeed |
| Latitude | degrees north | Latitude, EPSG: 4326 |
| Longitude | degrees east | Longitude, EPSG: 4326 |
| Mach_Number | Mach number | |
| Mixing_Ratio | grams per kilogram | H2O mixing ratio |
| Part_Press_Water_Vapor | millibars | Water vapor partial pressure in air |
| Pitch_Angle | degree | Platform pitch angle |
| Potential_Temp | Celsius | Potential temperature |
| Pressure_Altitude | feet | Barometric altitude |
| Relative_Humidity | percent | Relative humidity |
| Roll_Angle | degree | Platform roll angle |
| Sat_Vapor_Press_H2O | millibars | H2O saturation vapor pressure of water |
| Sat_Vapor_Press_Ice | millibars | H2O saturation vapor pressure of ice |
| Solar_Zenith_Angle | degree | Solar zenith angle |
| Static_Air_Temp | Celsius | Static air temperature |
| Static_Pressure | millibars | Air pressure |
| Sun_Azimuth | degree | Solar azimuth angle |
| Total_Air_Temp | Celsius | Total air temperature |
| Track_Angle | degree | Track angle |
| True_Air_Speed | knots | Platform speed with respect to air |
| True_Heading | degree | Platform yaw angle |
| Vertical_Speed | feet per minute | Vertical speed |
| Wind_Direction | degree | Wind direction |
| Wind_Speed | meters per second | Wind speed |
| Altitude_AGL_m | meters | Aircraft altitude above ground level |
| Ground_Elevation_m | meters | Ground elevation above mean sea level |
Data Center Processing
The ORNL DAAC created netCDF files for each of the provided ICARTT files. Aircraft navigation and meteorological information were added to the netCDF files from Pal (2019) for B-200 flights and Yang et al. (2018) for C-130 flights.
Application and Derivation
ACT-America, or Atmospheric Carbon and Transport - America, conducted five airborne campaigns across three regions in the eastern United States to study the transport and fluxes of atmospheric carbon. The eastern half of the United States is a region that includes a highly productive biosphere, vigorous agricultural activity, extensive gas and oil extraction and consumption, dynamic, seasonally varying weather patterns and the most extensive carbon cycle and meteorological observing networks on Earth, serves as an ideal setting for the mission.
Each 6-week campaign accurately and precisely quantified anomalies in atmospheric carbon, also known as carbon flux. Accurate carbon flux data is necessary to address all terrestrial carbon cycle science questions. ACT-America addressed the three primary sources of uncertainty in atmospheric inversions—transport error, prior flux uncertainty, and limited data density.
ACT-America advances society’s ability to predict and manage future climate change by enabling policy-relevant quantification of the carbon cycle. Sources and sinks of atmospheric carbon dioxide (CO2) and methane (CH4) are poorly known at regional to continental scales. ACT-America enables and demonstrates a new generation of atmospheric inversion systems for quantifying CO2 and CH4 sources and sinks.
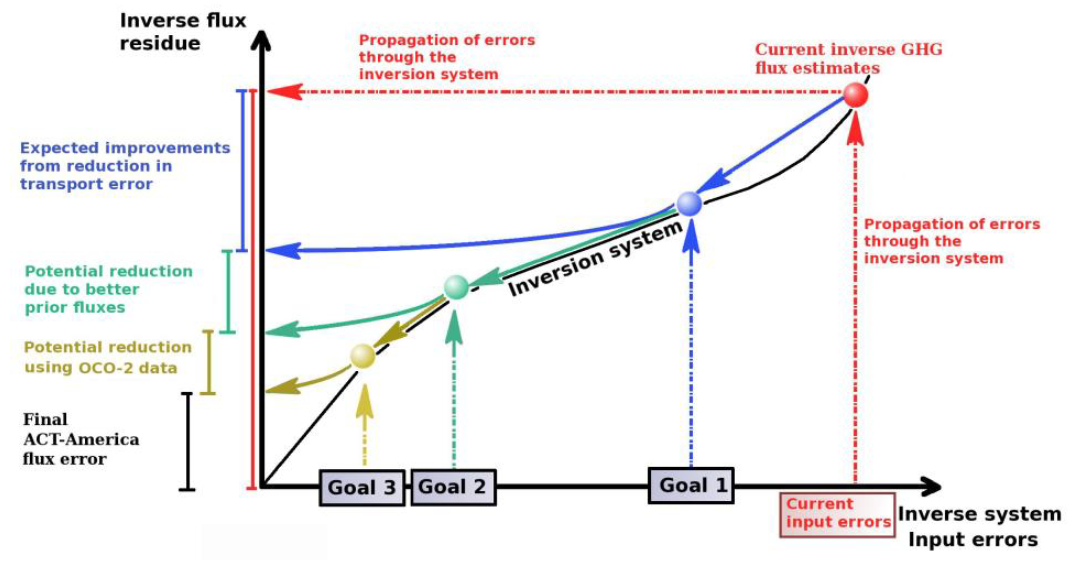
Figure 2. A schematic showing ACT-America mission goals.
ACT-America Goals:
- To quantify and reduce atmospheric transport uncertainties.
- To improve regional-scale, seasonal prior estimates of CO2 and CH4 fluxes.
- To evaluate the sensitivity of Orbiting Carbon Observatory (OCO-2) column measurements to regional variability in tropospheric CO2.
ACT-America achieved these goals by deploying airborne and ground-based platforms to obtain data that were combined with data from existing measurement networks and integrated with an ensemble of atmospheric inversion systems. Aircraft instrumented with remote and in-situ sensors observed how mid-latitude weather systems interact with CO2 and CH4 sources and sinks to create atmospheric CO2/CH4 distributions. A model ensemble consisting of a mesoscale atmospheric transport model with multiple physics and resolutions options nested within global inversion models and surface CO2/CH4 flux ensembles was used to predict atmospheric CO2 and CH4 distributions.
Beyond the conclusion of the mission, the application of knowledge gained from this mission will improve diagnoses of the carbon cycle across the globe for decades.
Quality Assessment
There are multiple levels of quality control for 12-pack flask samples taken at each aircraft site, however, there are also multiple sources of errors that need to be assessed. Sources of error to the 12-pack flask measurement fall into three different categories: flask induced bias, sampling errors, and analysis errors. Details on instrument quality control information are available at https://www.esrl.noaa.gov/gmd/ccgg/aircraft/qc.html.
Table 3. Instrument precision as provided in the ACT-America proposal.
| Instrument | Platform | Technique | Species/Parameter | Instrument Precision (Averaging Time) | STM Precision Requirement [over 20 km (~130 sec) unless otherwise noted] |
|---|---|---|---|---|---|
| Flasks | C-130H, B-200 | GC/MS3 | CO2, CH4, 14CO2, COS | 0.2 ppm CO2 1 ppb CH4 2 per mil 14CO2 2 ppt COS (all 10 sec) |
1 ppm CO2 4 ppb hourly CH4 2 per mil 14CO2 10 ppt COS |
Data Acquisition, Materials, and Methods
ACT-America Overview
ACT-America deployed the NASA C-130 and B-200 aircraft to measure atmospheric CO2 and CH4 in the atmospheric boundary layer (ABL) and free troposphere (FT). In all five seasonal campaigns, a total of 121 days of research flights, more than 1,140 hours of observations, 570 level legs, and 1,363 vertical profiles were conducted. Flights concentrated observations on three study domains: Northeast, South-central, and Midwest. These flights were dedicated in a roughly 3:3:1 ratio among fair weather, stormy weather, and OCO-2 underpass flight patterns (Crisp et al., 2004, Crisp et al., 2008).
For fair and stormy weather flights, the C-130 flew at 3–8 km above ground, collecting in-situ measurements in the lower FT, remotely sensed, column-averaged CO2 measurements focused on the ABL, and occasional in-situ vertical profiles. The B-200 primarily sampled the ABL. For OCO-2 under flights, the C-130 flew at 8 km above ground with the B-200 flying in the ABL, both along the OCO-2 flight track. The existing in situ tower CO2/CH4 observing network was enhanced with five additional tower sites.
The mission delivered 2-3 times more high-quality lower tropospheric CO2 and CH4 observations than any previous airborne campaign.
Flight Plans
Data from the fair-weather flights are intended to quantify regional CO2 and CH4 fluxes, and to evaluate fair weather atmospheric C transport processes. The flight pattern is designed to provide extensive sampling of the ABL and lower FT in source/sink regions, meeting the requirements for the fair weather investigation. The C-130 aircraft will fly a U-shape pattern with flight legs perpendicular to the wind, sampling FT and ABL properties downwind of the sources and sinks of C. The C-130 will fly at roughly two times the midday ABL depth, (3–4 km above ground level) with periodic descents and ascents (5–10 times in a 6–8 hr flight) to sample the ABL. Although clear sky conditions will be targeted, the C-130 will conduct more profiling if low-altitude clouds interfere with the remote sensors. The B-200 aircraft will partake in two flights per day and will sample a subset of the C-130 flight path focusing on long transects in the ABL with periodic ascents to the FT. The two aircraft will operate over the same time period, but precise coordination is not required.
Data from stormy-weather flights will be used in combination with the data from fair-weather flights to evaluate the transport of C in the mid-latitudes. The flight plans include flight legs parallel to and crossing frontal boundaries at two or more altitudes, and crossing the frontal zone at two or more locations, meeting the requirements for the stormy weather investigation.
The pattern for the OCO-2 inter-comparison flights is designed to obtain data to evaluate the degree to which OCO-2 column CO2 measurements capture true spatial variability in column CO2 content over the continents. Two OCO-2 under flights will be conducted during each campaign and will be selected to cover varying surface reflectance, topography, and aerosol and cloud cover, all possible sources of bias in the OCO-2 measurements. The C-130 flights will be 1,000 km in length and flown at 8 km (28 ft) altitude to maximize the fraction of the atmospheric column sampled by the MFLL. The B-200 aircraft will sample a shorter (~360 km) leg in the ABL, often the largest source of variability in column CO2. The B-200 flight will be centered with the C-130 and both aircraft will be vertically stacked during the OCO-2 overpass.
Airborne Instruments
ACT-America deployed high-quality, field-tested trace gas and meteorological instruments. This dataset includes measurements from discrete air samples captured by the flask sampling system onboard the aircraft. The two air-sampling devices, the Programmable Flask Package (PFP) and Programmable Compressor Package (PCP) systems are used routinely on aircraft as part of the NOAA/ESRL Greenhouse Gas Reference Network (Sweeney et al., 2015).
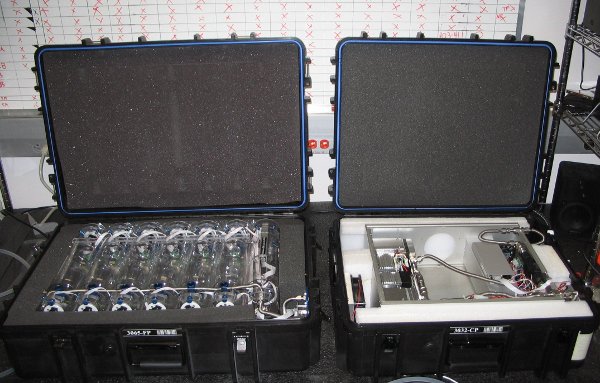
Figure 3. Flask sampling system for aircraft measurements. Left: Programmable Flash Package (PFP) containing 12 flasks. Right: Programmable Compressor Package (PCP) containing pumps for pressurizing the flasks. Source: NOAA Global Monitoring Laboratory
Programmable Flask Package
The 12-pack is composed of twelve, 0.7 L borosilicate glass flasks, a stainless-steel manifold system, glass valves sealed with Teflon O-rings, and a data logging and control system. The 7.5 cm diameter cylindrical flasks have glass valves at each end and are stacked in two rows of six. A flexible stainless-steel manifold connects all of the flasks in parallel on the inlet side of the flasks. The valves at both ends of the flasks can be opened and closed with motor-controlled valves. The valve mechanism is made of a glass rod and Teflon O-rings, which seals against a beveled glass valve seat when inserted into the valve body. The data logging and control system in the 12-pack provide the interface for controlling the sampling valves, as well as for storing a sampling plan and target flush volume and fill pressure for the samples. Actual sample flush volumes and fill pressures during sampling are recorded by the data logger, along with system status and a time stamp. When GPS position, ambient temperature, pressure, and relative humidity are available from external sensors, these values are also recorded by the data logger at 10-second intervals.
Programmable Compressor Package
The PCP includes two pumps that have been plumbed in series. The first-stage pump (KNF Model N828 with aluminum head and Viton diaphragm) is designed to ensure flow rates of at least 5 L/min at 8,000 masl and 15 L/min at sea level. The second-stage pump (KNF Model N814 with aluminum head and Viton diaphragm) is designed to ensure that samples can be reliably compressed to 40 psia at altitudes up to 8,000 masl. The PCP is powered by a nickel-metal hydride (NiMH) rechargeable battery, which enables the pumps to fill up to four 12-packs (48 flasks) before recharging.
Sampling
A typical sampling routine uses one PCP and one or more PFP(s) that are pre-programmed with a flight-specific sampling plan of target altitudes for each sample. Sampling is timed to coincide with the overflight of a ground site of interest, or when interesting geophysical conditions are encountered. The PCP is connected to an LED display that communicates target sampling altitudes to the pilot. The pilot maintains the aircraft at a consistent altitude for the duration of each sample collection, typically under 40 seconds. For each sample, the inlet line and compression manifold are flushed with about 5 liters of ambient air. Valves on both ends of the current flask are then opened and the flask is flushed with about 10 more liters of ambient air to displace the dry, low CO2 fill gas with which the flasks are shipped. The sample flush air is measured by a mass flow meter to ensure that a sufficient volume passes through the manifold and flask before the downstream valve is closed and pressurization begins. Sample flush volumes and fill pressures during sampling are recorded by the data logger, along with ambient temperature, pressure, and relative humidity. GPS position and time stamp are also recorded with each sample.
Data Access
These data are available through the Oak Ridge National Laboratory (ORNL) Distributed Active Archive Center (DAAC).
ACT-America: L2 In Situ Atmospheric Gas Concentrations from Flasks, Eastern USA
Contact for Data Center Access Information:
- E-mail: uso@daac.ornl.gov
- Telephone: +1 (865) 241-3952
References
Crisp, D., R.M. Atlas, F.-M. Breon, L.R. Brown, J.P. Burrows, P. Ciais, B.J. Connor, S.C. Doney, I.Y. Fung, D.J. Jacob, C.E. Miller, D. O’Brien, S. Pawson, J.T. Randerson, P. Rayner, R.J. Salawitch, S.P. Sander, B. Sen, G.L. Stephens, P.P. Tans, G.C. Toon, P.O. Wennberg, S.C. Wofsy, Y.L. Yung, Z. Kuang, B. Chudasama, G. Sprague, B. Weiss, R. Pollock, D. Kenyon, and S. Schroll. 2004. The Orbiting Carbon Observatory (OCO) mission. Advances in Space Research 34:700–709. https://doi.org/10.1016/j.asr.2003.08.062
Crisp, D. 2008. NASA Orbiting Carbon Observatory: measuring the column averaged carbon dioxide mole fraction from space. Journal of Applied Remote Sensing 2:023508. https://doi.org/10.1117/1.2898457
Davis, K.J., M.D. Obland, B. Lin, T. Lauvaux, C. O'Dell, B. Meadows, E.V. Browell, J.P. DiGangi, C. Sweeney, M.J. McGill, J.D. Barrick, A.R. Nehrir, M.M. Yang, J.R. Bennett, B.C. Baier, A. Roiger, S. Pal, T. Gerken, A. Fried, S. Feng, R. Shrestha, M.A. Shook, G. Chen, L.J. Campbell, Z.R. Barkley, and R.M. Pauly. 2018. ACT-America: L3 Merged In Situ Atmospheric Trace Gases and Flask Data, Eastern USA. ORNL DAAC, Oak Ridge, Tennessee, USA. https://doi.org/10.3334/ORNLDAAC/1593
Pal, S. 2019. ACT-America: Profile-based Planetary Boundary Layer Heights, Eastern USA. ORNL DAAC, Oak Ridge, Tennessee, USA. https://doi.org/10.3334/ORNLDAAC/1706
Sweeney, C., A. Karion, S. Wolter, T. Newberger, D. Guenther, J.A. Higgs, A.E. Andrews, P.M. Lang, D. Neff, E. Dlugokencky, J.B. Miller, S.A. Montzka, B.R. Miller, K.A. Masarie, S.C. Biraud, P.C. Novelli, M. Crotwell, A.M. Crotwell, K. Thoning, and P.P. Tans. 2015. Seasonal climatology of CO2 across North America from aircraft measurements in the NOAA/ESRL Global Greenhouse Gas Reference Network. Journal of Geophysical Research: Atmospheres 120:5155–5190. https://doi.org/10.1002/2014JD022591
Yang, M.M., J.D. Barrick, C. Sweeney, J.P. Digangi, and J.R. Bennett. 2018. ACT-America: L1 Meteorological and Aircraft Navigational Data. ORNL DAAC, Oak Ridge, Tennessee, USA. https://doi.org/10.3334/ORNLDAAC/1574
Dataset Revisions
| Version | Release Date | Description of Changes |
|---|---|---|
| 1.2 | 2021-02-22 | Updated earlier campaign data and added Summer 2019 campaign data. |
| 1.1 | 2019-03-27 | Updated earlier campaign data and added Fall 2017 and Spring 2018 campaign data. |
| 1.0 | 2018-06-26 | Initial data added for Summer 2016 and Winter 2017 campaigns. |