Documentation Revision Date: 2020-07-01
Dataset Version: 1.2
Summary
There are a total of 1256 files in this dataset. There are 628 data files in NetCDF (*.nc) file format and 628 data files in ICARTT (*.ict) file format. Note that files in both formats contain the same atmospheric gas concentration data but the netCDF files contain additional variables (e.g., metadata flag information) and consistent variable names across campaigns and aircrafts.
This dataset currently includes results from the Summer 2016, Winter 2017, Fall 2017, Spring 2018, and Summer 2019 campaigns.
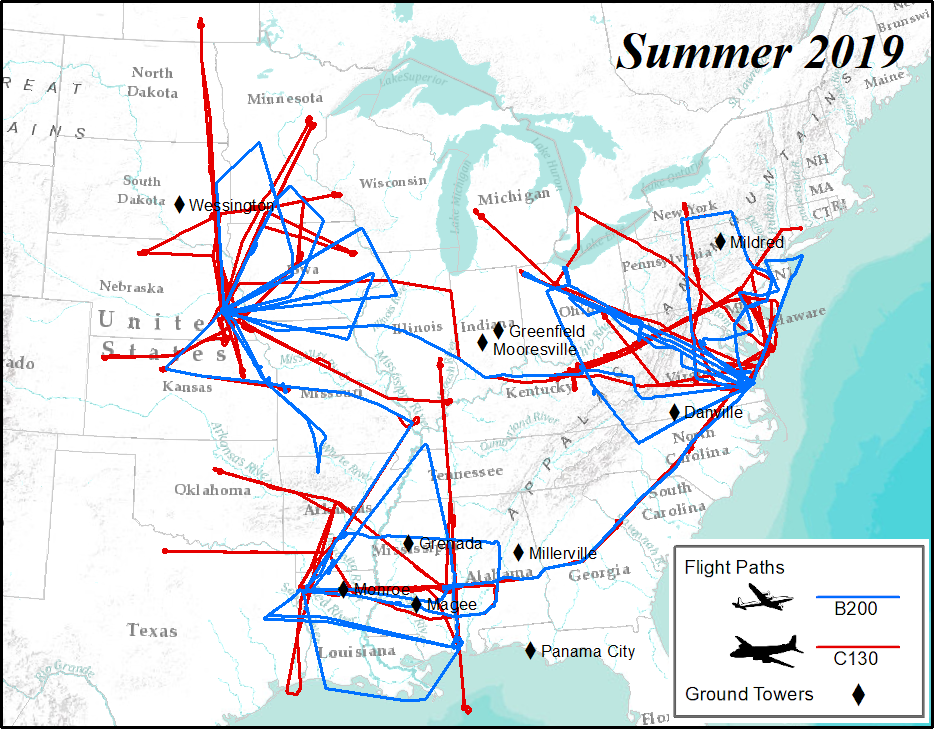
Figure 1. ACT-America 2019 summer airborne campaign showing the flight paths for the two aircrafts and location of ground towers. Flights were concentrated on three study domains: northeast, south-central, and midwest regions of the United States.
Citation
Davis, K.J., M.D. Obland, B. Lin, T. Lauvaux, C. O'Dell, B. Meadows, E.V. Browell, J.P. DiGangi, C. Sweeney, M.J. McGill, J.D. Barrick, A.R. Nehrir, M.M. Yang, J.R. Bennett, B.C. Baier, A. Roiger, S. Pal, T. Gerken, A. Fried, S. Feng, R. Shrestha, M.A. Shook, G. Chen, L.J. Campbell, Z.R. Barkley, and R.M. Pauly. 2018. ACT-America: L3 Merged In Situ Atmospheric Trace Gases and Flask Data, Eastern USA. ORNL DAAC, Oak Ridge, Tennessee, USA. https://doi.org/10.3334/ORNLDAAC/1593
Table of Contents
- Dataset Overview
- Data Characteristics
- Application and Derivation
- Quality Assessment
- Data Acquisition, Materials, and Methods
- Data Access
- References
- Dataset Revisions
Dataset Overview
This dataset provides three merged data products acquired during flights over the central and eastern United States as part of the Atmospheric Carbon and Transport - America (ACT-America) project. Two aircraft platforms, the NASA Langley Beechcraft B200 King Air and the NASA Goddard Space Flight Center's C-130H Hercules, were used to collect high-quality in situ measurements across a variety of continental surfaces and atmospheric conditions. The merged data products are composed of continuous in situ measurements of atmospheric carbon dioxide (CO2), methane (CH4), carbon monoxide (CO), ozone (O3), and ethane (C2H6, B200 aircraft only) that were averaged to uniform intervals and merged with trace gas concentrations from discrete flask samples collected with the Programmable Flask Package (PFP) and the aircraft navigation and meteorological variables. These merged data products provide integrated measurements at intervals useful to the modeling community for studying the transport and fluxes of atmospheric carbon dioxide and methane across North America.
Project: Atmospheric Carbon and Transport (ACT-America)
The ACT-America, or Atmospheric Carbon and Transport - America, project is a NASA Earth Venture Suborbital-2 mission to study the transport and fluxes of atmospheric carbon dioxide and methane across three regions in the eastern United States. Each flight campaign will measure how weather systems transport these greenhouse gases. Ground-based measurements of greenhouse gases were also-collected. Better estimates of greenhouse gas sources and sinks are needed for climate management and for prediction of future climate.
Related Datasets
The original Level 2 data from the portable flask package system, cavity ring-down spectrometers, and ozone instruments are available in their native sampling intervals as independent datasets:
Digangi, J.P., Y. Choi, J.B. Nowak, and H.S. Halliday. 2017. ACT-America: L2 In Situ Atmospheric CO2, CO, CH4, and O3 Concentrations, Eastern USA. ORNL DAAC, Oak Ridge, Tennessee, USA. https://doi.org/10.3334/ORNLDAAC/1556
Sweeney, C., B. Baier, J.B. Miller, P. Lang, B. Miller, S. Lehman, S. Englund-Michel, and M.M. Yang. 2018. ACT-America: L2 In Situ Atmospheric Gas Concentrations from Flasks, Eastern USA. ORNL DAAC, Oak Ridge, Tennessee, USA. https://doi.org/10.3334/ORNLDAAC/1575
Yang, M.M., J.D. Barrick, C. Sweeney, J.P. Digangi, and J.R. Bennett. 2018. ACT-America: L1 Meteorological and Aircraft Navigational Data. ORNL DAAC, Oak Ridge, Tennessee, USA. https://doi.org/10.3334/ORNLDAAC/1574
Data Characteristics
Spatial Coverage: Flights over eastern and central United States
Spatial Resolution: Point measurements
Temporal Coverage: Periodic flights took place during each intensive campaign.
| Campaign | Beginning and ending dates |
|---|---|
| Summer 2016 | 2016-07-11 to 2016-08-28 |
| Winter 2017 | 2017-01-21 to 2017-03-10 |
| Fall 2017 | 2017-10-03 to 2017-11-13 |
| Spring 2018 | 2018-04-12 to 2018-05-20 |
| Summer 2019 | 2019-06-11 to 2019-07-27 |
Temporal Resolution: 1-seconds, 5-seconds, and intervals coinciding with flask samples
Study Area: (These coordinates are the approximate locations of the study sites and may not match the extent of the data files. All latitude and longitude are given in decimal degrees.)
| Site | Northern Extent | Southern Extent | Western Extent | Eastern Extent |
|---|---|---|---|---|
| Central and Eastern United States | 50.55 | 27.230 | -106.494 | -72.662 |
Dataset Information
There are a total of 1256 files in this dataset. Files are organized by flight date, aircraft (B200 and C130), and the time interval on which the data were merged (1 or 5 seconds or flask sampling intervals).
Format: NetCDF
There are 628 data files in NetCDF trajectory version 4 (*.nc) format following CF Conventions 1.6. NetCDF files are structured as GeoTrajectory files, where the observations for a flight segment are connected along a one-dimensional track in space, with time increasing monotonically along the track.
These files contain gas concentrations and data from the respective aircraft's flight navigation system. The flight and altitude data were imported from the ACT-America P3-B Data System PDS (for B200 flights) and Housekeeping data (for C130 flights). Flight variables are listed in Table 1 of the Data Dictionary section below.
Format: ICARTT
There are 628 data files in ICARTT file format (*.ict) following the ICARTT standard. The files contain the same atmospheric gas concentration data as the NetCDF files, but no metadata flag information.
The structure of the merged data products is described in the table below.
| Data Product | Reporting Frequency | File Organization | Merge Protocol - Continuous | Merge Protocol Discrete |
|---|---|---|---|---|
| Continuous one-second merge | 1-second |
For both NetCDF and ICARTT file formats, files are organized by: aircraft (B-200 or C-130), flight date, revision number, and optionally flight segment (number) for flights with more than one segment. |
L2 data from Picarro CRDS and ozone monitoring instruments (2B Technologies) were averaged to 1-second intervals | PFP sample results were added to the 1-second continuous reporting time observation that was nearest the middle of the flask sample collection period |
| Continuous 5-second merge | 5-seconds |
For both NetCDF and ICARTT file formats, files are organized by: aircraft (B-200 or C-130), flight date, revision number, and optionally flight segment (number) for flights with more than one segment. |
L2 data from Picarro CRDS and ozone monitoring instruments (2B Technologies) were averaged to 5-second intervals | PFP sample results were added to the 5-second continuous reporting time observation that was nearest the middle of the flask sample collection period |
| Discrete Flask-based Merge | Variable; total PFP fill time |
For both NetCDF and ICARTT file formats, files are organized by: aircraft (B-200 or C-130), flight date, revision number, and optionally flight segment (number) for flights with more than one segment. |
L2 data from Picarro CRDS and ozone monitoring instruments (2B Technologies) were averaged to the 15-second interval surrounding each flask sample | Flask samples are presented at their native temporal resolution |
Readme files for each of the merged products were also generated and are provided as companion files. The methods used to combine the data points for each time interval are described in Section 3 of the documentation for the Toolsets for Airborne Data (NASA ASDC), also included as a companion file (TAD-Documentation.pdf).
Data Sources
Atmospheric Trace Gas Analyses
- the two Cavity Ring-Down Spectrometers (CRDS; Picarro Inc.): PICARRO G2301-m on C-130 and PICARRO G2401-m on B-200
- the continuous ozone monitoring instrument (2B Technologies)
- the Compact Atmospheric Multi-Species Spectrometer (CAMS-2; B-200 flights only)
- results of Portable Flask Package (PFP) sample analyses
Digangi, J.P., Y. Choi, J.B. Nowak, and H.S. Halliday. 2017. ACT-America: L2 In Situ Atmospheric CO2, CO, CH4, and O3 Concentrations, Eastern USA. ORNL DAAC, Oak Ridge, Tennessee, USA. https://doi.org/10.3334/ORNLDAAC/1556
Sweeney, C., B. Baier, J.B. Miller, P. Lang, B. Miller, S. Lehman, S. Englund-Michel, and M.M. Yang. 2018. ACT-America: L2 In Situ Atmospheric Gas Concentrations from Flasks, Eastern USA. ORNL DAAC, Oak Ridge, Tennessee, USA. https://doi.org/10.3334/ORNLDAAC/1575
Flight Navigational and Meteorological Data
- flight and altitude data from the ACT-America P3-B Data System PDS (for B-200 flights)
- flight and altitude data from Housekeeping data (for C-130 flights)
Yang, M.M., J.D. Barrick, C. Sweeney, J.P. Digangi, and J.R. Bennett. 2018. ACT-America: L1 Meteorological and Aircraft Navigational Data. ORNL DAAC, Oak Ridge, Tennessee, USA. https://doi.org/10.3334/ORNLDAAC/1574
Data Quality Flags
The 1- and 5-second merged data products were generated by averaging the measurement values across each time interval.
If any portion of the averaging period contains a Limit of Detection (LOD) value for a given measurement, the average is marked with an LOD flag.
- measurements above the upper LOD are flagged with -777777;
- measurements below the lower LOD are flagged with -888888;
- all missing data are flagged with a value of -999999;
File Naming Convention:
Variable names have been modified from those in the source datasets to include the instrument;
e.g. CH4_MoleFraction -> CH4_MoleFraction_PFP
ACTAMERICA-<interval>-<aircraft>-merge_<YYYYMMDD>_<revision number>.<ext>
where:
<interval> : time interval of the merged measurements; mrg01 = 1-second, mrg05 = 5-second, mrgPFP = Flask intervals
<aircraft> : either B200 or C130
<YYYYMMDD> : flight date (UTC)
<revision number> : revision number of the data. A higher number indicates a more recent revision; e.g. R1 = revision 1
<ext> : file extension; either nc (NetCDF) or ict (ICARTT)
Data Dictionary
The files contain atmospheric trace gas concentration data and data from the respective aircraft's flight navigation system.
Table 1. Name, instrument, description, and units for each of the variables in the merged in the NetCDF files.
|
Variable name |
Description |
Units1 |
|---|---|---|
|
Instrument: Portable Flask Package |
||
|
BENZ_MoleFraction_PFP |
benzene mole fraction |
ppt |
|
C2F6_MoleFraction_PFP |
hexafluorethane mole fraction |
ppt |
|
C2H2_MoleFraction_PFP |
acetylene mole fraction |
ppt |
|
C2H6_MoleFraction_PFP |
ethane mole fraction |
ppt |
|
C3H8_MoleFraction_PFP |
propane mole fraction |
ppt |
|
CF4_MoleFraction_PFP |
carbon tetrafloride mole fraction |
ppt |
|
CH2BrCl_MoleFraction_PFP |
bromochloromethane mole fraction |
ppt |
|
CH3I_MoleFraction_PFP |
methyl iodide mole fraction |
ppt |
|
CH4C13_MoleFraction_PFP |
C-13 of CH4 mole fraction |
per mil |
|
CH4_MoleFraction_PFP |
methane mole fraction |
ppb |
|
CHLF_MoleFraction_PFP |
chloroform mole fraction |
ppt |
|
CO2C14_MoleFraction_PFP |
C-14 of CO2 mole fraction |
per mil |
|
CO2_MoleFraction_PFP |
carbon dioxide mole fraction |
ppm |
|
CO_MoleFraction_PFP |
carbon monoxide mole fraction |
ppb |
|
DIBR_MoleFraction_PFP |
dibromomethane mole fraction |
ppt |
|
DICL_MoleFraction_PFP |
dimethyl chloride mole fraction |
ppt |
|
F113_MoleFraction_PFP |
CFC113 mole fraction |
ppt |
|
F115_MoleFraction_PFP |
CFC115 mole fraction |
ppt |
|
F11B_MoleFraction_PFP |
F11 mole fraction |
ppt |
|
F125_MoleFraction_PFP |
pentafluoroethane mole fraction |
ppt |
|
F134A_MoleFraction_PFP |
Tetrafluoroethane mole fraction |
ppt |
|
F13_MoleFraction_PFP |
F13 mole fraction |
ppt |
|
F143a_MoleFraction_PFP |
1-1-1-trifluoroethane mole fraction |
ppt |
|
F152A_MoleFraction_PFP |
1-1-difluoroethane mole fraction |
ppt |
|
F227e_MoleFraction_PFP |
F227 mole fraction |
ppt |
|
F236fa_MoleFraction_PFP |
F236fa mole fraction |
ppt |
|
F23_MoleFraction_PFP |
fluoroform mole fraction |
ppt |
|
F32_MoleFraction_PFP |
F32 mole fraction |
ppt |
|
F365m_MoleFraction_PFP |
pentafluorobutane mole fraction |
ppt |
|
FC12_MoleFraction_PFP |
FC12 mole fraction |
ppt |
|
H1211_MoleFraction_PFP |
halon 1211 mole fraction |
ppt |
|
H1301_MoleFraction_PFP |
halon 1301 mole fraction |
ppt |
|
H2402_MoleFraction_PFP |
halon 2402 mole fraction |
ppt |
|
H2_MoleFraction_PFP |
hydrogen mole fraction |
ppb |
|
HF133a_MoleFraction_PFP |
HF133a mole fraction |
ppt |
|
HF22_MoleFraction_PFP |
HF22 mole fraction |
ppt |
|
MCFA_MoleFraction_PFP |
methyl chloroform mole fraction |
ppt |
|
MEBR_MoleFraction_PFP |
methyl bromide mole fraction |
ppt |
|
MECL_MoleFraction_PFP |
methyl chloride mole fraction |
ppt |
|
N2O_MoleFraction_PFP |
nitrous oxide mole fraction |
ppb |
|
OCS_MoleFraction_PFP |
carbonyl sulfide mole fraction |
ppt |
|
P218_MoleFraction_PFP |
P218 mole fraction |
ppt |
|
PCE_MoleFraction_PFP |
perchloroethylene mole fraction |
ppt |
|
SF6_MoleFraction_PFP |
sulfur hexafloride mole fraction |
ppt |
|
SO2F2_MoleFraction_PFP |
sulfuryl fluoride mole fraction |
ppt |
|
TCE_MoleFraction_PFP |
trichloroethylene mole fraction |
ppt |
|
TOL_MoleFraction_PFP11 |
toluene mole fraction |
ppt |
|
iC4H10_MoleFraction_PFP |
isoButane mole fraction |
ppt |
|
iC5H12_MoleFraction_PFP |
isoPentane mole fraction |
ppt |
|
nC4H10_MoleFraction_PFP |
neoButane mole fraction |
ppt |
|
nC5H12_MoleFraction_PFP |
neoPentane mole fraction |
ppt |
|
nC6H14_MoleFraction_PFP |
n-Hexane mole fraction |
ppt |
|
Instrument: Picarro CRDS |
||
|
CH4_DryMoleFraction_PICARRO |
Methane dry mole fraction |
ppm |
|
CO2_DryMoleFraction_PICARRO |
carbon dioxide dry mole fraction |
ppm |
|
CO_DryMoleFraction_PICARRO |
Carbon monoxide dry mole fraction |
ppm |
|
Dewpoint_PICARRO |
dew point |
K |
|
H2O_MassMixingRatio_PICARRO6 |
Water vapor mass mixing ratio |
g kg-1 |
|
H2O_VaporPressure_PICARRO6 |
Derived water vapor pressure |
hPa |
|
H2O_VolMixingRatio_PICARRO6 |
Water vapor volume mixing ratio |
percent |
|
RHi_PICARRO6 |
Derived relative humidity wrt ice |
percent |
|
RHw_PICARRO6 |
Derived relative humidity wrt liquid water |
percent |
|
Instrument: CAMS2 Spectrometer4 |
||
|
C2H6_MixingRatio_CAMS2 |
C2H6 mixing ratio by volume |
ppbv |
|
Instrument: Cloud Physics Lidar5 |
||
|
MLH-AMSL_CPL |
derived mixed layer height in ASL |
m |
|
GroundHeight-AMSL_CPL |
derived ground height above MSL |
m |
|
Instrument: 2B Technologies Continuous O3 |
||
|
O3_DryMoleFraction |
ozone mole fraction |
ppb |
|
Instrument: In Situ Quantum Cascade Laser Spectrometer (QCLS) 7 |
||
|
C2H6_MixingRatio_QCLS |
C2H6 dry mixing ratio |
ppbv |
|
Aircraft navigation and meteorological variables |
||
|
ALTP |
pressure altitude |
m |
|
AircraftSunAzimuth |
aircraft sun azimuth |
degree |
|
AircraftSunElevation |
aircraft sun elevation |
degree |
|
CabinPressure |
cabin pressure |
hPa |
|
Dewpoint_Nav |
dew point |
K |
|
DifferentialPressure8 |
differential pressure |
hPa |
|
DriftAngle9 |
drift angle |
degree |
|
GPS_ALT |
global positioning system altitude |
m |
|
GRD_SPD |
ground speed |
m s-1 |
|
H2O_MixingRatio_Nav |
H2O mixing ratio |
g kg-1 |
|
H2O_RelativeHumidity_Nav |
relative humidity |
percent |
|
H2O_SatVaporPressureIce_Nav |
H2O sat vapor pressure ice |
hPa |
|
H2O_SatVaporPressureWater_Nav |
H2O sat vapor pressure water |
hPa |
|
H2O_VaporPressure_Nav |
H2O vapor pressure |
hPa |
|
HDG |
true heading |
degree |
|
IAS |
indicated air speed |
m s-1 |
|
LATITUDE |
latitude |
degree_north |
|
LOCAL_SUN_TIME |
local sun time |
h |
|
LONGITUDE |
longitude |
degree_east |
|
MachNumber |
mach number |
1 |
|
PITCH |
pitch angle |
degree |
|
PRESSURE |
static pressure |
hPa |
|
PotentialTemp_Nav |
potential temperature |
K |
|
Radar_ALT3 |
radar altitude |
m |
|
ROLL |
roll angle |
degree |
|
SZA |
solar azimuth angle |
degree |
|
SolarZenithAngle |
solar zenith angle |
degree |
|
StaticPressure10 |
static pressure |
hPa |
|
SunAzimuth |
sun azimuth |
degree |
|
TAS |
true air speed |
m s-1 |
|
TEMPERATURE |
static air temperature |
K |
|
THETA |
potential temperature |
K |
|
TRK |
track angle |
degree |
|
TotalAirTemp |
total air temperature |
K |
|
VerticalSpeed |
vertical speed |
m s-1 |
|
U_WINDS |
U wind direction |
m s-1 |
|
V_WINDS |
V wind direction |
m s-1 |
|
Wind_Direction |
wind direction |
degree |
|
Wind_Speed |
wind speed |
m s-1 |
|
Metadata flag information2 |
||
|
Air_flag |
Warm/Cold air flag |
|
|
BL_FT_flag |
Boundary layer or free troposphere flag |
|
|
Flight_flag |
Flight pattern flag |
|
|
Maneuver_flag |
Maneuver flag |
|
|
Maneuver_flagQC |
Maneuver flag QC |
|
|
Extracted ground elevation |
||
|
Altitude_AGL |
Aircraft altitude above ground level from Google Maps API |
m |
|
GroundElevation-AMSL_GoogleMaps |
ground elevation above mean sea level from Google Maps API |
m |
1 ppm: parts per million; ppb: parts per billion; ppt: parts per trillion; ppbv: parts per billion by volume;
2 Metadata flag information is only available for 5-second merge files.
3 Radar altitude is only available for the 2018 Spring and 2019 Summer campaigns on C-130 aircraft.
4 CAMS2 instrument on B-200 aircraft only.
5 CPL instrument on C-130 aircraft only.
6 H2O PICARRO variables are available starting Winter 2017 on C-130 aircraft only.
7 QCLS instrument flown on C-130 aircraft for the 2019 Summer campaign only.
8 DifferentialPressure available B-200 aircraft only.
9 DriftAngle not available for 2017 and 2019 campaigns.
10 StaticPressure only available for 2016 and 2018 campaigns.
11 TOL_MoleFraction_PFP not available for 2019 campaign.
Application and Derivation
ACT-America, or Atmospheric Carbon and Transport – America, will conduct five airborne campaigns across three regions in the eastern United States to study the transport of atmospheric carbon. The eastern half of the United States is a region that includes a highly productive biosphere, vigorous agricultural activity, extensive gas and oil extraction and consumption, dynamic, seasonally varying weather patterns and the most extensive carbon cycle and meteorological observing networks on Earth, serves as an ideal setting for the mission.
Each 6-week campaign will accurately and precisely quantify anomalies in atmospheric carbon, also known as Carbon Flux. Accurate carbon flux data is necessary to address all terrestrial carbon cycle science questions. ACT-America addresses the three primary sources of uncertainty in atmospheric inversions — transport error, prior flux uncertainty and limited data density.
ACT-America will advance society’s ability to predict and manage future climate change by enabling policy-relevant quantification of the carbon cycle. Sources and sinks of atmospheric carbon dioxide (CO2) and methane (CH4) are poorly known at regional to continental scales. ACT-America will enable and demonstrate a new generation of atmospheric inversion systems for quantifying CO2 and CH4 sources and sinks.
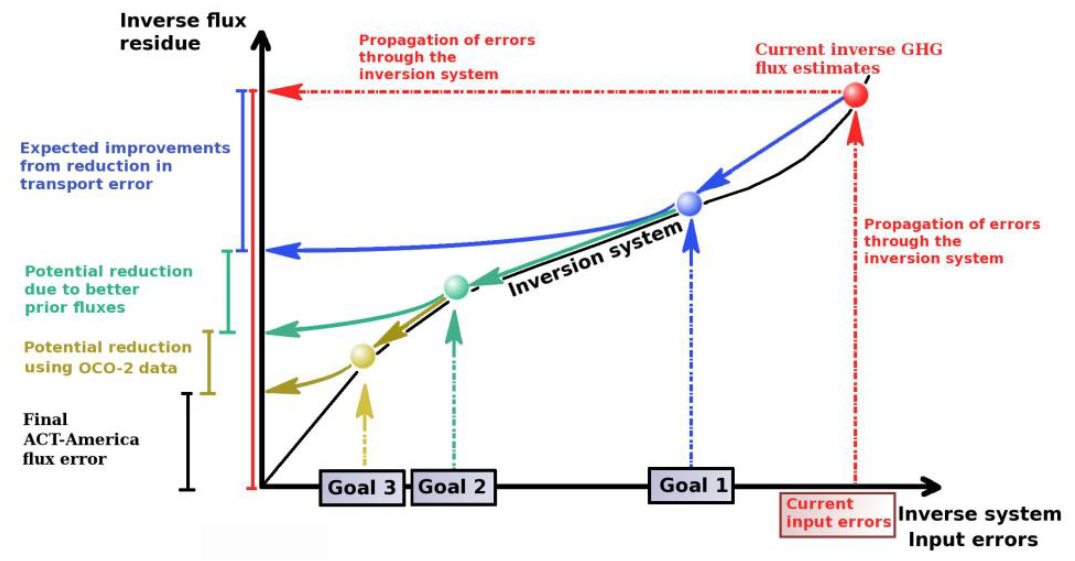 Figure 2. A schematic showing ACT-America project goals.
ACT-America Goals:
- To quantify and reduce atmospheric transport uncertainties.
- To improve regional-scale, seasonal prior estimate of CO2 and CH4 fluxes.
- To evaluate the sensitivity of Orbiting Carbon Observatory (OCO-2) column measurements to regional variability in tropospheric CO2.
ACT-America will achieve these goals by deploying airborne and ground-based platforms to obtain data that will be combined with data from existing measurement networks and integrated with an ensemble of atmospheric inversion systems. Aircraft instrumented with remote and in situ sensors will observe how mid-latitude weather systems interact with CO2 and CH4 sources and sinks to create atmospheric CO2/CH4 distributions. A model ensemble consisting of a mesoscale atmospheric transport model with multiple physics and resolutions options nested within global inversion models and surface CO2/CH4 flux ensembles will be used to predict atmospheric CO2 and CH4 distributions.
Beyond the conclusion of the mission, application of the knowledge gained from this mission will improve diagnoses of the carbon cycle across the globe for decades.
Quality Assessment
Picarro continuous CO2/CH4/H2O/CO: These instruments exceed the precision requirements of the baseline science objective for the mission for all four gases (Karion et al., 2013). Accuracies of 0.2 ppm for CO2 and 2 ppb for CH4 also exceed mission accuracy requirements of 1 ppm for CO2 and 4 ppb for CH4.
2B Technologies Continuous O3: The O3 monitor has been previously flown on tropospheric chemistry field missions and meets the accuracy and precision requirements for the baseline science objectives of the mission (Bertschi et al. 2004).
Within the data, nodata and out-of-range values are provided in the dataset as described. Instrument precision specifications are available in the ACT-America proposal and replicated below (Fig 3.)
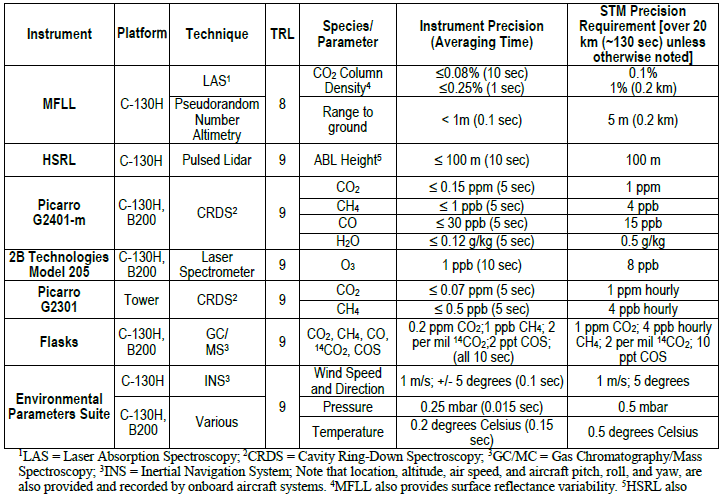
Figure 3. Instrument precision table as provided in the ACT-America proposal.
See additional instrument quality control discussion here: https://www.esrl.noaa.gov/gmd/ccgg/aircraft/qc.html
Data Acquisition, Materials, and Methods
ACT-America Overview
The eastern half of the United States, a region that includes a highly productive biosphere, vigorous agricultural activity, extensive gas and oil extraction, dynamic, seasonally varying weather patterns and the most extensive carbon cycle and meteorological observing networks on Earth, serves as an ideal setting for the mission. Flights will concentrate observations on three study domains: Northeast, South-central, and Midwest.
ACT-America will deploy the NASA C-130 and B-200 aircraft to measure atmospheric CO2 and CH4 in the atmospheric boundary layer (ABL) and free troposphere (FT). The mission proposes a total of 70 science flights, 528 hours for the C-130 and 396 hours for the B-200, dedicated in a roughly 3:3:1 ratio among fair weather, stormy weather, and OCO-2 underpass flight patterns.
For fair and stormy weather flights, the C-130 will fly at 3-8 km above ground, collecting in situ measurements in the lower FT, remotely sensed, column-averaged CO2 measurements focused on the ABL, and occasional in situ vertical profiles. The B-200 will primarily sample the ABL. For OCO-2 underflights, the C-130 will fly at 8 km above ground with the B-200 flying in the ABL, both along the OCO-2 flight track. The existing in situ tower CO2/CH4 observing network will be enhanced with five additional tower sites.
The mission will deliver 2-3 times more high-quality lower tropospheric CO2 and CH4 observations than any previous airborne campaign.
Flight Plans
Data from the fair-weather flights are intended to quantify regional CO2 and CH4 fluxes, and to evaluate fair weather atmospheric C transport processes. The flight pattern is designed to provide extensive sampling of the ABL and lower FT in source/sink regions, meeting the requirements for the fair weather investigation. The C-130 aircraft will fly a U-shape pattern with flight legs perpendicular to the wind, sampling FT and ABL properties downwind of the sources and sinks of C. The C-130 will fly at roughly two times the midday ABL depth, (~3-4 km above ground level (AGL)) with periodic descents and ascents (5 to 10 times in a 6-8-hr flight) to sample the ABL. Although clear sky conditions will be targeted, the C-130 will conduct more profiling if low-altitude clouds interfere with the remote sensors. The B-200 aircraft will partake in two flights per day and will sample a subset of the C-130 flight path focusing on long transects in the ABL with periodic ascents to the FT. The two aircraft will operate over the same time period, but precise coordination is not required.
Data from stormy-weather flights will be used in combination with the data from fair-weather flights to evaluate the transport of C in the mid-latitudes. The flight plans include flight legs parallel to and crossing frontal boundaries at two or more altitudes, and crossing the frontal zone at two or more locations, meeting the requirements for the stormy weather investigation.
The pattern for the OCO-2 inter-comparison flights is designed to obtain data to evaluate the degree to which OCO-2 column CO2 measurements capture true spatial variability in column CO2 content over the continents. Two OCO-2 under flights will be conducted during each campaign and will be selected to cover varying surface reflectance, topography, and aerosol and cloud cover, all possible sources of bias in the OCO-2 measurements. The C-130 flights will be 1000 km in length and flown at 8 km (28 kft) altitude to maximize the fraction of the atmospheric column sampled by the MFLL. The B-200 aircraft will sample a shorter (~360 km) leg in the ABL, often the largest source of variability in column CO2. The B-200 flight will be centered with the C-130 and both aircraft will be vertically stacked during the OCO-2 overpass.
Airborne Instruments
ACT-America deployed high-quality, field-tested trace gas and meteorological instruments. This dataset includes measurements from discrete air samples captured by the onboard flask sampling system, in situ measurements of trace gas mole fractions from a cavity ring-down spectroscopy (CRDS) instrument (Picarro Inc.), and ozone measurements by a continuous O3 monitor (2B Technologies), as well as in situ pressure, temperature and wind measurements.
Flask air sampling system
The two air-sampling devices, the Programmable Flask Package (PFP) and Programmable Compressor Package (PCP) systems, are used routinely on aircraft as part of the NOAA/ESRL Greenhouse Gas Reference network (Sweeney et al., 2015).
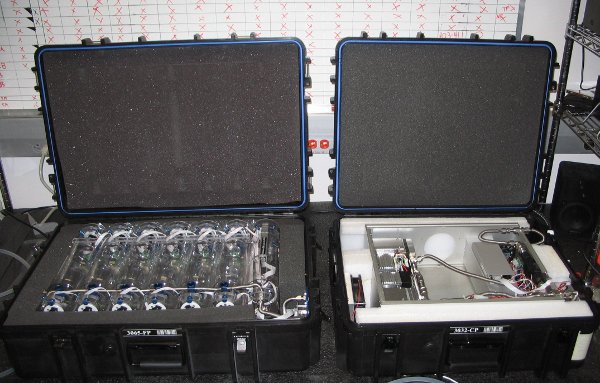 Figure 4. Flask sampling system for aircraft measurements. Left: Programmable Flash Package (PFP) containing 12 flasks. Right: Programmable Compressor Package (PCP) containing pumps for pressurizing the flasks. (Image courtesy: http://www.esrl.noaa.gov/gmd/ccgg/aircraft/sampling.html)
A typical sampling routine uses one PCP and one or more PFP(s) that are pre-programmed with a flight-specific sampling plan of target altitudes for each sample. Sampling is timed to coincide with the overflight of a ground site of interest, or when interesting geophysical conditions are encountered. A map of flask sample locations is depicted in Figure 1. The PCP is connected to an LED display that communicates target sampling altitudes to the pilot. The pilot maintains the aircraft at a consistent altitude for the duration of each sample collection, typically under 40 seconds. For each sample, the inlet line and compression manifold are flushed with about 5 liters of ambient air. Valves on both ends of the current flask are then opened and the flask is flushed with about 10 more liters of ambient air to displace the dry, low CO2 fill gas with which the flasks are shipped. The sample flush air is measured by a mass flow meter to ensure that a sufficient volume passes through the manifold and flask before the downstream valve is closed and pressurization begins. Sample flush volumes and fill pressures during sampling are recorded by the data logger, along with ambient temperature, pressure, and relative humidity. GPS position and time stamp are also recorded with each sample.
The PFP samples were sent back to NOAA/ESRL in Boulder, CO, for analysis of trace gases. The gases fall into four broad categories including: greenhouse gases, carbon isotopes, halocarbons and hydrocarbons. Quantities of CO2 in flask air samples were detected using a non-dispersive infrared analyzer and reported in parts per million (ppm). Because detector response is non-linear in the range of atmospheric levels, ambient samples are bracketed during analysis by a set of reference standards used to calibrate detector response. CH4 was isolated from constituent gases through gas chromatography and quantified with flame ionization detection. Measurements are reported in parts per billion (ppb). CO was isolated from constituent gases with gas chromatography and detected by resonance fluorescence at ~150 nm, or by reaction with HgO to produce mercury and detection through Hg resonance absorption, and reported in ppb. H2 was isolated using gas chromatography, reacted with HgO, and detected through Hg resonance absorption. H2 quantities are reported in ppb. The N2O and SF6 sample components were isolated using gas chromatography and quantified with electron capture detection. N2O and SF6 are reported in ppb and parts per trillion (ppt), respectively.
More detailed description of sample analyses is provided at the NOAA ESRL PFP page.
Picarro Instruments
Picarro CRDS instruments were flown aboard both the C-130 and B-200. The Picarro instruments have been extensively tested on aircraft flights (Karion et al., 2013; Mays et al., 2009; Turnbull et al., 2011). Picarro analyzers are based on Wavelength-Scanned Cavity Ring Down Spectroscopy (WS-CRDS), a time-based measurement utilizing a near-infrared laser to measure a spectral signature of molecular absorption. Gas flows through a 35 35-cc optical cavity with an effective path length of up to 20 km and pressure of 140 Torr. Extremely stable and high-precision measurements are achieved through cavity temperature, pressure, and wavelength laser frequency control to better than 0.002°C, 0.00003 atm and 1 MHz, respectively. Aircraft instruments are similar to surface-based sensors, but use faster flow rates, solid-state data storage, and additional vibration isolation. These instruments exceed the precision requirements of the baseline science objectives for all four gases (Karion et al., 2013). Accuracies of 0.2 ppm for CO2 and 2 ppb for CH4 (Karion et al., 2013) also exceed mission accuracy requirements of 1 ppm for CO2 and 4 ppb for CH4.
2B Technologies Continuous O3
The Model 205 O3 monitor uses two ultraviolet beams in two cells to simultaneously measure O3-scrubbed air and unscrubbed air. This model has been approved by the Environmental Protection Agency as a Federal Equivalent Method (FEM) and is the fastest UV-based O3 monitor available. The O3 monitor has been previously flown on tropospheric chemistry field missions and meets the accuracy and precision requirements laid out in the STM (Bertschi et al. 2004).
CAMS-2
The Compact Atmospheric Multi-Species Spectrometer (CAMS-2) instrument was flown aboard the B-200 aircraft (Richter et al. 2017). CAMS-2 is a compact, laser-based mid-IR absorption spectrometer and performs continuous airborne sampling for CO2, CH4, and Ethane (C2H6). For ACT-America, the CAMS-2 instrument measured ethane at 1-second intervals with a detection sensitivity of ~30 to 62 pptv. Ethane measurements from the CAMS-2 instrument are included in data files for B-200 flights only.
Merged Data Products
Three merged data products were generated from source measurements and samples acquired during flights over the central and eastern United States between August 2016 and March 2017. Two aircraft platforms, the NASA Langley Beechcraft B200 King Air and the NASA Goddard Space Flight Center's C-130H Hercules, were used to collect high-quality in situ measurements across a variety of continental surfaces and atmospheric conditions.
- The 1- and 5-second merge products are composed of
- (1) continuous in situ instrument measurements of atmospheric carbon dioxide (CO2), methane (CH4), carbon monoxide (CO), ozone (O3), and ethane (C2H6, B200 aircraft only)
- (2) the results of the analyses of ~50 CO2, CO, molecular hydrogen (H2), halocarbons, hydrocarbons and sulfur containing trace gases in discrete flask samples collected with the Programmable Flask Package (PFP)
- (3) the aircraft navigation and meteorological variables.
- The discrete flask-based merge product is composed of
- (1) the results of the analyses of the discrete PFP flask samples (~50 CO2, CO, H2, halocarbons, hydrocarbons and sulfur containing trace gases)
- (2) the continuous in situ instrument measurements of atmospheric CO2, CH4, CO, O3, and C2H6 (B200 aircraft only) averaged for the 15-second period surrounding each flask sample's timestamp
- (3) the aircraft navigation and meteorological variables averaged to the individual flask sample's collection time.
The methods used to combine the data points for each time interval are described in Section 3 of the documentation for the Toolsets for Airborne Data (NASA ASDC), also included as a companion file (TAD-Documentation.pdf).
Data Access
These data are available through the Oak Ridge National Laboratory (ORNL) Distributed Active Archive Center (DAAC).
ACT-America: L3 Merged In Situ Atmospheric Trace Gases and Flask Data, Eastern USA
Contact for Data Center Access Information:
- E-mail: uso@daac.ornl.gov
- Telephone: +1 (865) 241-3952
References
Bertschi, I. T., D. A . Jaffe, L. Jaegle, H. U. Price, J. B. and Dennison (2004). PHOBEA/ITCT 2002 airborne observations of transpacific transport of ozone, CO, volatile organic compounds, and aerosols to the northeast Pacific: Impacts of Asian anthropogenic and Siberian boreal fire emissions, J. Geophys. Res. 109, D23S12, https://doi.org/10.1029/2003JD004328
Crisp, D (2004), The Orbiting Carbon Observatory (OCO) mission. Advances in Space Research, 34 (4), 700-709, https://doi.org/10.1016/j.asr.2003.08.062.
Crisp, D., Miller, C. E., and DeCola, P. L. (2008). NASA Orbiting Carbon Observatory: measuring the column averaged carbon dioxide mole fraction from space, J. Appl. Remote Sens., 2, 023508, https://doi.org/10.1117/1.2898457
Crosson, E.R. A cavity ring-down analyzer for measuring atmospheric levels of methane, carbon dioxide, and water vapour. Appl. Phys. B92, 403-408, 2008. https://doi.org/10.1007/s00340-008-3135-y
ICARTT files have detailed header information and follow the standards established and summarized in the ICARTT File Format Standards V2.0. https://earthdata.nasa.gov/esdis/eso/standards-and-references/icartt-file-format
Karion, C. Sweeney, G. Pétron, G. Frost, J. Kofler, B. R. Miller, T. Newberger, S. Wolter, R. Banta, W. A. Brewer, E. Dlugokencky, M. Hardesty, P. Lang, S. A. Montzka, R. Schnell, P. Tans, M. Trainer, R. Zamora, (2013) Methane emissions estimate from airborne measurements over a western US natural gas field, Geophys. Res. Lett., 40, https://doi.org/10.1002/grl.50811.
Mays, K. L. , P. B. Shepson, B. H. Stirm, A. Karion, C. Sweeney and K. R. Gurney (2009). “Aircraft-Based Measurements of the Carbon Footprint of Indianapolis”. Environmental Science & Technology 43(20): 7816-7823 https://doi.org/10.1021/es901326b.
Richter, D., P. Weibring, J. Walega, A. Fried, J.P. DiGangi, and Y. Choi. 2017. Airborne Measurements of Ethane during the NASA ACT-America Campaign using CAMS-2. EW2B.3 Optics and Photonics for Energy and the Environment. 6–9 November 2017, Boulder, Colorado, United States.
Turnbull, J. C., A. Karion, M. L. Fischer, I. Faloona, T. Guilderson, S. J. Lehman, B. R. Miller, J. B. Miller, S. Montzka, T. Sherwood, S. Saripalli, C. Sweeney and P. P. Tans (2011). Assessment of fossil fuel carbon dioxide and other anthropogenic trace gas emissions from airborne measurements over Sacramento, California in spring 2009. Atmospheric Chemistry and Physics 11(2): 705-721. https://doi.org/10.5194/acp-11-705-2011
Dataset Revisions
Version 1.2 (released 2020-06-10) updated data files for the first 4 campaigns and added data files for the 2019 summer campaign.
Version 1.1 (released 2019-02-25) updated all merge data from Summer 2016 and Winter 2017 campaigns to fully science quality data. Data from the Fall 2017 and Spring 2018 campaign were also released.
Version 1.0 (released 2018-06-25) provided the merge data from Summer 2016 and Winter 2017 campaigns, including some data flagged as preliminary (filename contains "RD").