Documentation Revision Date: 2021-01-03
Dataset Version: 1
Summary
ACT-America's overall mission spanned five years and included field campaigns covering all four seasons over central and eastern regions of the United States. ACT-America's objectives were to study the transport and fluxes of atmospheric CO2 and CH4. Two instrumented aircraft platforms, the NASA Langley Beechcraft B-200 King Air and the NASA Wallops Flight Facility's C-130 Hercules, were used to collect high-quality in situ measurements across a variety of continental surfaces and atmospheric conditions. At times they flew directly under Orbiting Carbon Observatory-2 (OCO-2) overpasses to evaluate the ability of OCO-2 to observe high-resolution atmospheric CO2 variations. The C-130 aircraft was also equipped with active remote sensing instruments for planetary boundary layer height detection and column greenhouse gas measurements.
This dataset contains 88 files (one per flight) in netCDF (*.nc) format.
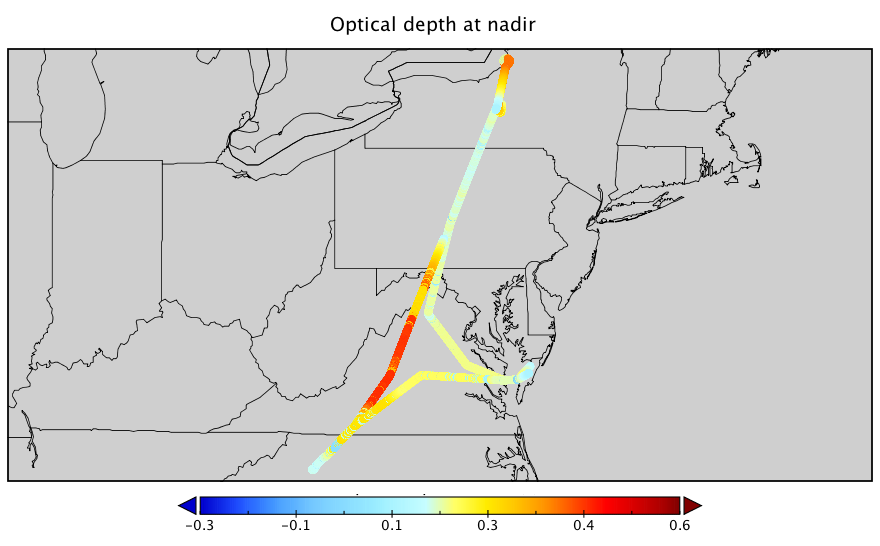
Figure 1. Optical depth (at nadir) measured during the flight on May 11 during the Spring 2018 campaign.
Citation
Lin, B., J.F. Campbell, J. Dobler, E.V. Browell, S.A. Kooi, S. Pal, T. Fan, W. Erxleben, D. Mcgregor, M.D. Obland, and C. O'Dell. 2020. ACT-America: L1 DAOD Measurements by Airborne CO2 Lidar, Eastern USA. ORNL DAAC, Oak Ridge, Tennessee, USA. https://doi.org/10.3334/ORNLDAAC/1817
Table of Contents
- Dataset Overview
- Data Characteristics
- Application and Derivation
- Quality Assessment
- Data Acquisition, Materials, and Methods
- Data Access
- References
Dataset Overview
This dataset provides Level 1 (L1) remotely sensed differential absorption optical depth (DAOD) measurements made through the Multi-Functional Fiber Laser Lidar (MFLL; Harris Corporation) during airborne campaigns in Summer 2016, Winter 2017, Fall 2017, and Spring 2018 conducted over central and eastern regions of the United States for the Atmospheric Carbon and Transport (ACT-America) project. DAOD were measured at 0.1-second frequency during flights of the C-130 Hercules aircraft at altitudes up to 8 km with MFLL. The MFLL is a set of Continuous-Wave (CW) lidar instruments consisting of an intensity-modulated multi-frequency single-beam synchronous-detection Laser Absorption Spectrometer (LAS) operating at 1571 nm to measure the column amount of CO2 number density and range between the aircraft and the surface or to cloud tops, and surface reflectance and a Pseudo Random Noise (PRN) altimeter at 1596 nm to measure the path length from the aircraft to the scattering surface and/or cloud tops. The MFLL was onboard all ACT-America seasonal campaigns, except Summer 2019. Complete aircraft flight information, interpolated to the 0.1-second column CO2 reporting frequency, are included, but not limited to, latitude, longitude, altitude, and attitude. Data users should note that a Level 2 (L2) MFLL data product is available that contains all data variables included in this L1 MFLL data product plus the column-average CO2 and has undergone additional processing and calibrations and is recommended for most use cases.
ACT-America's overall mission spanned five years and included field campaigns covering all four seasons over central and eastern regions of the United States. ACT-America's objectives were to study the transport and fluxes of atmospheric CO2 and CH4. Two instrumented aircraft platforms, the NASA Langley Beechcraft B-200 King Air and the NASA Wallops Flight Facility's C-130 Hercules, were used to collect high-quality in situ measurements across a variety of continental surfaces and atmospheric conditions. At times they flew directly under Orbiting Carbon Observatory-2 (OCO-2) overpasses to evaluate the ability of OCO-2 to observe high-resolution atmospheric CO2 variations. The C-130 aircraft was also equipped with active remote sensing instruments for planetary boundary layer height detection and column greenhouse gas measurements.
Project: Atmospheric Carbon and Transport - America
The ACT-America, or Atmospheric Carbon and Transport - America, project was a NASA Earth Venture Suborbital-2 mission to study the transport and fluxes of atmospheric carbon dioxide and methane across three regions in the eastern United States. ACT-America conducted five flight campaigns spanning all four seasons throughout 2016—2019 and measured how weather systems transported greenhouse gases. Ground-based measurements were also collected. The objective of the study was to enable more accurate and precise estimates of the sources and sinks of greenhouse gases, as better estimates are needed for climate management and for prediction of future climate. Three primary sources of uncertainty (i.e., transport error, prior flux uncertainty, and limited data density) were addressed to improve the inference of carbon dioxide and methane sources and sinks.
Related Dataset
Lin, B., J.F. Campbell, J. Dobler, E.V. Browell, S.A. Kooi, S. Pal, T. Fan, W. Erxleben, D. Mcgregor, M.D. Obland, and C. O'Dell. 2018. ACT-America: L2 Remotely Sensed Column-average CO2 by Airborne Lidar, Eastern USA. ORNL DAAC, Oak Ridge, Tennessee, USA. https://doi.org/10.3334/ORNLDAAC/1649
Acknowledgments
This work was supported by NASA EVS-2 grant number NNX15AG76G.
Data Characteristics
Spatial Coverage: Flights over the eastern and central US
Spatial Resolution: Point measurements along C-130 flight tracks
Temporal Coverage: Periodic flights occurred during each intensive campaign
| Campaign | Data Beginning and Ending Dates |
|---|---|
| Summer 2016 | 2016-05-27 to 2016-08-29 |
| Winter 2017 | 2017-01-21 to 2017-03-10 |
| Fall 2017 | 2017-09-22 to 2017-11-13 |
| Spring 2018 | 2018-03-28 to 2018-05-20 |
Temporal Resolution: 0.1 second (10 Hz)
Study Area: Three regions in the eastern United States. Coordinates are the approximate locations of the study sites and may not match the extent of the data files. Latitude and longitude are given in decimal degrees.
| Site | Westernmost Longitude | Easternmost Longitude | Northernmost Latitude | Southernmost Latitude |
|---|---|---|---|---|
| Eastern United States | -106.5 | -71.5 | 49.2 | 27.2 |
Data File Information
This dataset contains 88 data files (one per flight) in netCDF (*.nc) format following CF Conventions (v1.6). The files employ the GeoTrajectory data structure, where observations for a flight segment are connected along a one-dimensional track in space. The files contain ancillary measurements that were used in the column-average CO2 calculation (see Related Datasets above).
NOTE: Time does not increase monotonically along the flight path. Gaps exist for segments of the flight when measurements were not being recorded. Reference the time variable (seconds since 2016-01-01 00:00:00 UTC).
File Naming Convention
Files are named according to the format <project>-<instrument>-<processing_level>_<aircraft>_<YYYY-MM-DDTHHMMSS>_<R#>.nc (e.g., ACTAmerica-MFLL-lev1_C130_2016-07-11T162406_R2.nc), where:
<project> = ACTAmerica
<instrument> = MFLL
<processing_level> = lev1 (the only part of the file name that distinguishes L1 from L2 MFLL products)
<aircraft> = C130
<YYYY-MM-DDTHHMMSS> = flight start date and time UTC
<R#> = data revision number (a higher number indicates a more recent revision)
Data File Details
Table 1. Variable names, descriptions, and units.
| Variable Name | Units | Description |
|---|---|---|
| Derived Measurements | ||
| Range_nadir | meters | Range at nadir |
| OD_nadir | NA | Optical depth at nadir |
| OD_bias_corr | NA | Optical depth at nadir with bias corrections |
| Native Measurements | ||
| Amplitude_ref_ch1 | count | Channel 1 reference amplitude |
| Amplitude_ref_ch2 | count | Channel 2 reference amplitude |
| Amplitude_ref_ch3 | count | Channel 3 reference amplitude |
| Amplitude_sci_ch1 | count | Channel 1 processed amplitude for the primary scatterer |
| Amplitude_sci_ch2 | count | Channel 2 processed amplitude for the primary scatterer |
| Amplitude_sci_ch3 | count | Channel 3 processed amplitude for the primary scatterer |
| Range_ref_ch1 | meter | Channel 1 reference range |
| Range_ref_ch2 | meter | Channel 2 reference range |
| Range_ref_ch3 | meter | Channel 3 reference range |
| Range_sci_ch1 | meter | Channel 1 processed range for the primary scatterer |
| Range_sci_ch2 | meter | Channel 2 processed range for the primary scatterer |
| Range_sci_ch3 | meter | Channel 3 processed range for the primary scatterer |
| Amplitude_2nd_scatter | count | Amplitude for secondary the scatterer |
| Range_2nd_scatter | meter | Range for secondary the scatterer |
| Processing Parameters | ||
| Range_offset | meter | Range offset |
| Calibration_coeff | Zero-path calibration coefficient | |
| Ancillary Data * | ||
| time | seconds | UTC time in seconds since 2016-01-01 00:00:00 |
| Latitude | decimal degrees north | Latitude |
| Longitude | decimal degrees east | Longitude |
| Mask | Mask flag values indicate if the measured sample had any quality issues. Users can screen data to quickly remove questionable Column_CO2 values. Mask values: “1” indicates a good Column_CO2 value; “0” indicates that the Column_CO2 value may not be of good quality. | |
| GPS_Altitude | meter | GPS altitude of aircraft |
| Pitch | degree | Pitch angle of aircraft |
| Roll | degree | Roll angle of aircraft |
| Ground_elevation | meter | Ground elevation |
| Wavelength_ch1 | nanometer | Channel 1 (on-line) signal wavelength |
| Wavelength_ch2 | nanometer | Channel 2 (off-line) signal wavelength off-short at -50 pm |
| Wavelength_ch3 | nanometer | Channel 3 (off-line signal wavelength off-long at +50 pm |
| Flags | ||
| Data_quality_flag | see Table 2 | Data quality flag |
| Cloud_Ground_flag | see Table 3 | Cloud-ground flag |
| Flag_2nd_scatter | see Table 4 | Second backscatter flag |
* Ancillary data have been interpolated to the 10 Hz measurement interval.
Criteria used to set “Mask” as 0 or 1: If pitch<=5 deg and roll<=5 deg and altitude-nadir_range-elevation<20 m and Flag_ 2nd_scatter=0 and amplitude/400000<15, then mask=1. Otherwise mask=0. The mask criteria is different in level 2 data as the pitch and roll corrections changed among other things.
Data Quality Flags
Table 2. Data quality flag descriptions. This flag is defined by a signal amplitude threshold and airplane pitch and roll angles.
| Value | Signal Strength | Pitch Angle < 5° | Roll Angle < 5° |
|---|---|---|---|
| 0 | good | yes | yes |
| 1 | good | yes | no |
| 2 | good | no | yes |
| 3 | good | no | no |
| 4 | bad | yes | yes |
| 5 | bad | yes | no |
| 6 | bad | no | yes |
| 7 | bad | no | no |
Cloud-ground Flags
The cloud-ground flag is set based on the comparison of calculated surface height to the GLOBE (1999) digital elevation model to determine whether a peak is from a cloud or ground/ocean. The processing algorithm retains information on up to two peaks from each 10 Hz sample waveform of the off-short signal (channel 2). The processed ranges and amplitudes for the primary scatterer (Range_sci_ch2, Amplitude_sci_ch2) are from the stronger of the two peaks. The secondary backscatter parameters (Range_2nd_scatter, Amplitude_2nd_scatter) report information about the secondary peak if one exists.
- The calculated surface height (GPS_Altitude – Range_nadir) is compared to that from the GLOBE (1999) digital elevation model to determine whether a peak is from a cloud or ground/ocean.
- If the range to the secondary peak is less than the range to the primary peak, then intermediate backscatters exist between the aircraft and the primary scatterer, which could impact the differential absorption optical depth measurement.
Table 3. Cloud-ground flag descriptions.
| Value | Clear/Cloudy | Description |
|---|---|---|
| 0 | Clear | One signal peak from ground |
| 1 | Cloudy | One signal peak from cloud |
| 2 | Cloudy | Two signal peaks; data are from the ground; secondary peak is intermediate backscatter |
| 3 | Cloudy | Two signal peaks; data are from clouds; secondary peak is intermediate backscatter |
| 4 | Cloudy | Two signal peaks; data are from clouds; secondary peak is ground |
| 5 | Cloudy | Two signal peaks; data are from clouds; secondary peak is cloud below first peak |
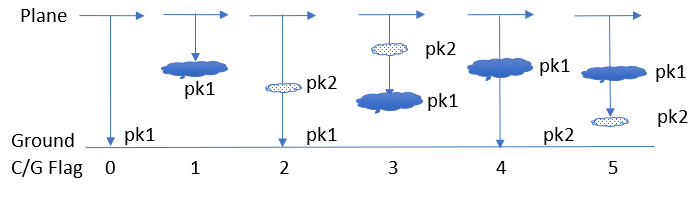
Figure 2. Diagram depicting cloud/ground flag value determination. Solid blue-filled clouds represent an optically moderately-thick or even thick cloud; dot-filled clouds represent an optically-thin cloud.
Second Backscatter Flags
The backscatter profile that results from the cross-correlation of the returned signal with the modulation waveform for the off-short wavelength is used to determine whether a secondary scattering layer exists along the path of the aircraft and the primary scatterer. The location of the secondary peak with respect to the primary peak is used to set this flag.
Table 4. Second backscatter flag descriptions.
| Value | Description |
|---|---|
| 0 | No secondary scatterer and no intervening scatterer between aircraft and primary scatterer |
| 1 | Secondary scatter present between primary scatter and aircraft |
| 2 | Primary scatter closest to aircraft, secondary scatter farther away |
Data Center Processing
The ORNL DAAC converted the data files from the originally provided HDF5 format to CF-compatible netCDF4 format to make them easier to understand and to use.
Application and Derivation
ACT-America, or Atmospheric Carbon and Transport - America, conducted five airborne campaigns across three regions in the eastern United States to study the transport and fluxes of atmospheric carbon. The eastern half of the United States is a region that includes a highly productive biosphere, vigorous agricultural activity, extensive gas and oil extraction and consumption, dynamic, seasonally varying weather patterns and the most extensive carbon cycle and meteorological observing networks on Earth, serves as an ideal setting for the mission.
Each 6-week campaign accurately and precisely quantified anomalies in atmospheric carbon, also known as carbon flux. Accurate carbon flux data is necessary to address all terrestrial carbon cycle science questions. ACT-America addressed the three primary sources of uncertainty in atmospheric inversions—transport error, prior flux uncertainty, and limited data density.
ACT-America advances society’s ability to predict and manage future climate change by enabling policy-relevant quantification of the carbon cycle. Sources and sinks of atmospheric carbon dioxide (CO2) and methane (CH4) are poorly known at regional to continental scales. ACT-America enables and demonstrates a new generation of atmospheric inversion systems for quantifying CO2 and CH4 sources and sinks.
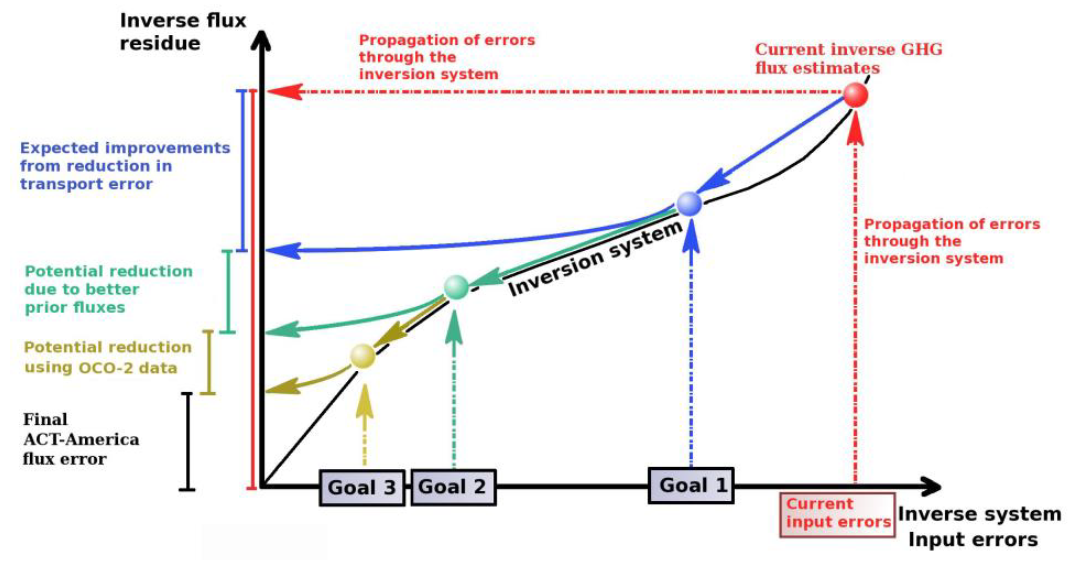
Figure 3. A schematic showing ACT-America mission goals.
ACT-America Goals
- To quantify and reduce atmospheric transport uncertainties.
- To improve regional-scale, seasonal prior estimates of C)2 and CH4 fluxes.
- To evaluate the sensitivity of Orbiting Carbon Observatory (OCO-2) column measurements to regional variability in tropospheric CO2.
ACT-America achieved these goals by deploying airborne and ground-based platforms to obtain data that were combined with data from existing measurement networks and integrated with an ensemble of atmospheric inversion systems. Aircraft instrumented with remote and in situ sensors observed how mid-latitude weather systems interact with CO2 and CH4 sources and sinks to create atmospheric CO2/CH4 distributions. A model ensemble consisting of a mesoscale atmospheric transport model with multiple physics and resolutions options nested within global inversion models and surface CO2/CH4 flux ensembles was used to predict atmospheric CO2 and CH4 distributions.
Beyond the conclusion of the mission, the application of knowledge gained from this mission will improve diagnoses of the carbon cycle across the globe for decades.
Quality Assessment
Harris Corporation Multi-functional Fiber Laser Lidar: The MFLL instrument, developed by Harris Corporation in 2004, has been extensively evaluated in 1000+ hours of ground testing and in 13 multi-day flight campaigns conducted over a variety of meteorological conditions and surface types during both days and nights. The laser absorption spectroscopy (LAS) CO2 column measurements have a precision equivalent to relative CO2 mole fraction precisions of about 0.30 ppm over land and 0.72 ppm over water. Absolute comparisons of CO2 remote and in situ measurements showed an absolute accuracy of 0.65 ppm of CO2 (Dobler et al., 2013; Browell et al., 2012), meeting the 1 ppm CO2 accuracy requirement (Fig. 4). Based on this extensive flight testing, the instrument meets the CO2 column measurement requirements of the mission and is considered to be at Technology Readiness Level (TRL) 8.
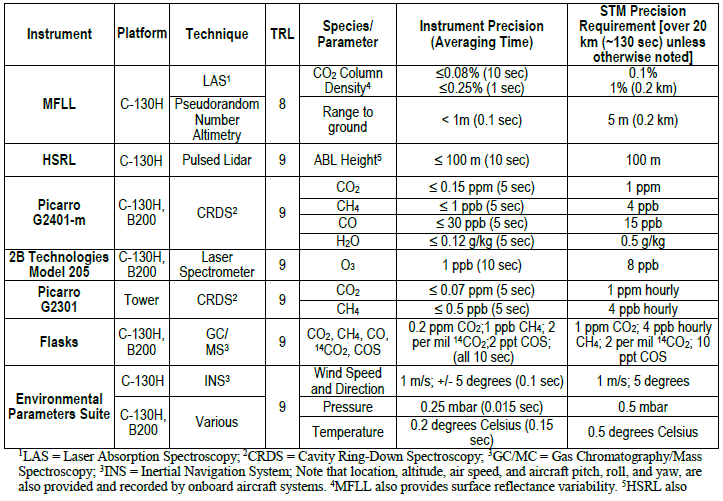
Figure 4. Instrument precision as provided in the ACT-America implementation plan.
Data Acquisition, Materials, and Methods
ACT-America Overview
ACT-America deployed the NASA C-130 and B-200 aircraft to measure atmospheric CO2 and CH4 in the atmospheric boundary layer (ABL) and free troposphere (FT). In all five seasonal campaigns, a total of 121 days of research flights, more than 1,140 hours of observations, 570 level legs, and 1,363 vertical profiles were conducted. Flights concentrated observations on three study domains: Northeast, South-central, and Midwest. These flights were dedicated in a roughly 3:3:1 ratio among fair weather, stormy weather, and OCO-2 underpass flight patterns.
For fair and stormy weather flights, the C-130 flew at 3-8 km above ground, collecting in situ measurements in the lower FT, remotely sensed, column-averaged CO2 measurements focused on the ABL, and occasional in situ vertical profiles. The B-200 primarily sampled the ABL. For OCO-2 under flights, the C-130 flew at 8 km above ground with the B-200 flying in the ABL, both along the OCO-2 flight track. The existing in situ tower CO2/CH4 observing network was enhanced with five additional tower sites.
The mission delivered 2-3 times more high-quality lower tropospheric CO2 and CH4 observations than any previous airborne campaign.
Flight Plans
Data from the fair-weather flights are intended to quantify regional CO2 and CH4 fluxes and to evaluate fair-weather atmospheric carbon transport processes. The flight pattern was designed to provide an extensive sampling of the ABL and lower FT in source/sink regions, meeting the requirements for the fair-weather investigation. The C-130 aircraft flew a U-shape pattern with flight legs perpendicular to the wind, sampling FT and ABL properties downwind of the sources and sinks of carbon. The C-130 flew at roughly two times the midday ABL depth, (~3-4 km AGL) with periodic descents and ascents (5-10 times in a 6-8 hr flight) to sample the ABL. Although clear sky conditions were targeted, the C-130 conducted more profiling if low-altitude clouds interfered with the remote sensors. The B-200 aircraft partook in two flights per day and sampled a subset of the C-130 flight path focusing on long transects in the ABL with periodic ascents to the FT. The two aircraft operated over the same time period, but precise coordination was not required.
Data from stormy-weather flights will be used in combination with the data from fair-weather flights to evaluate the transport of carbon in the mid-latitudes. The flight plans include flight legs parallel to and crossing frontal boundaries at two or more altitudes, and crossing the frontal zone at two or more locations, meeting the requirements for the stormy weather investigation.
The pattern for the OCO-2 inter-comparison flights is designed to obtain data to evaluate the degree to which OCO-2 column CO2 measurements capture true spatial variability in column CO2 content over the continents. Two OCO-2 under flights will be conducted during each campaign and will be selected to cover varying surface reflectance, topography, and aerosol and cloud cover, all possible sources of bias in the OCO-2 measurements. The C-130 flights will be 1000 km in length and flown at 8 km (28 kft) altitude to maximize the fraction of the atmospheric column sampled by the MFLL. The B-200 aircraft will sample a shorter (~360 km) leg in the ABL, often the largest source of variability in column CO2. The B-200 flight will be centered with the C-130 and both aircraft will be vertically stacked during the OCO-2 overpass.
Multi-functional Fiber Laser Lidar
ACT-America deployed high-quality, field-tested trace gas and meteorological instruments. For this dataset, the C-130 aircraft carried the Multi-functional Fiber Laser Lidar (MFLL); an intensity-modulated continuous-wave (IM-CW) lidar instrument developed jointly between the NASA Langley Research Center and the Harris Space and Intelligence Systems Corporation (Harris Corp.) to demonstrate the capability for remote CO2 column measurements. The MFLL estimates remote CO2 column concentrations by measuring the atmospheric optical depth at a wavelength that is absorbed by CO2. Additional data required for the retrieval of CO2 concentration is also collected by the instrument. These data include altimetry, environmental (temperatures, position/velocity) information, laser wavelengths, and a log of activity that transpires during instrument operation and flight.
The MFLL operates in the 1.57 mm CO2 absorption band with one laser wavelength positioned on the CO2 absorption line center (on-line) at 1571.112 nm, and two other laser wavelengths (off-lines) positioned ±50 pm on either side of the absorption line. Each wavelength is modulated with a unique orthogonal waveform before being combined for simultaneous transmission through the atmosphere. The individual wavelengths are then separated from the combined received signal through cross-correlating the received signal by each orthogonal waveform. The result of this cross-correlation allows the determination of a backscatter profile for each wavelength. From this, the range to a scattering surface and signal amplitude was determined. The MFLL instrument currently uses orthogonal linear swept-frequency waveforms. A systematic method for choosing these waveforms has been developed (Campbell 2013; Campbell et al. 2014A). CO2 column differential absorption optical depth (DAOD) values are estimated from combined online and offline measurements using the Integrated Path Differential Absorption (IPDA) approach (Dobler et al. 2013; Lin et al. 2013; Lin et al. 2015; Campbell 2014A; Campbell et al. 2014B).
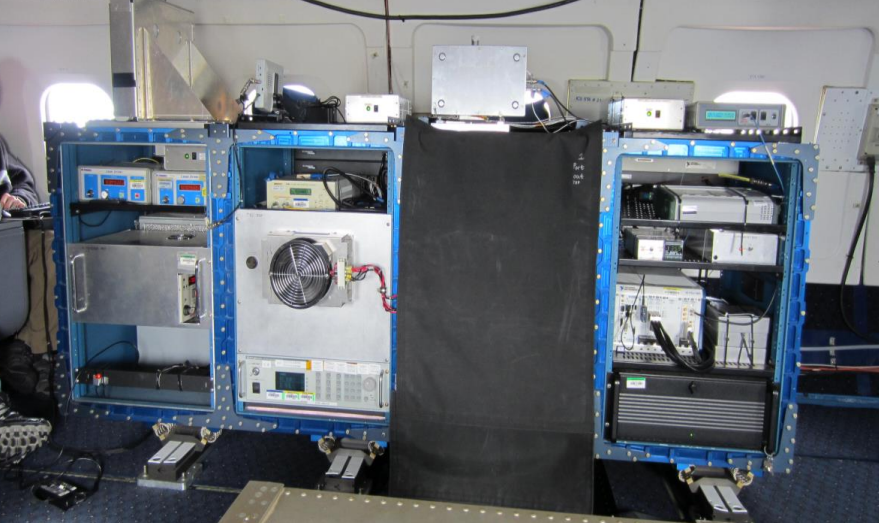
Figure 5. MFLL instrument aboard the NASA DC-8.
The simultaneously-detected backscattered signals at all three wavelengths were processed using the NASA Langley interpolate and reorder algorithm (Campbell et al., 2014C) which reorders the array elements in the frequency domain to convert a series of repeating synthetic pulses to a single, highly interpolated pulse. This computationally efficient technique provides high precision range and amplitude measurements for each wavelength.
In this data release, native range and signal amplitude are reported for each transmitted wavelength at 10 Hz resolution for on-line (channel 1), off-short at -50 pm (channel 2), and off-long at +50 pm (channel 3). Best estimates of DAOD and range to the surface calculated from the native data and key processing parameters are also reported. The DAOD listed as the OD_nadir parameter in the table was calculated from the on and off-short wavelength signals and adjusted for the off-nadir pointing of the measurement, which takes into account the aircraft attitude (pitch and roll) and instrument orientation relative to the aircraft axis. The range nadir parameter in the table also is calculated from the measurement range using the same adjustment as for the OD_nadir. The signal from off-short is used for range nadir because it is most representative of the true range due to refractive index changes for the on-line and, to a lesser degree, the off-line signals.
Key Processing Information
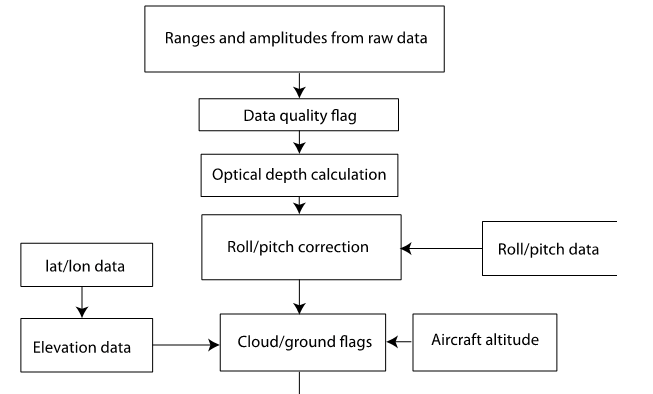
Figure 6. Flow chart for L1 MFLL data processing.
Summer 2016 Campaign Processing Details
Modulation cross-talk correction: The MFLL instrument team determined that cross-talk existed in the Summer 2016 campaign data between the different wavelength modulations which affected the determination of the on-line and off-long signal amplitudes. Harris Corp. performed optical loopback tests to measure the amount of modulation-induced cross-talk and provided the following correction coefficients and algorithm. The algorithm subtracts a fraction of the on-line signal from the off-short signal, and a different fraction of the cross-talk corrected online signal from the off-long signal. Note that the off-short signal required no cross-talk correction. This algorithm has been applied to both science and reference signals in this data release.
- fraction1 = 0.002738544937
- fraction2 = 0.009033499959
- Ampitude_sci_ch1_corrected = Amplitude_sci_ch1 – Amplitude_sci_ch2* fraction1
- Ampitude_sci_ch2_corrected = Ampitude_sci_ch2
- Ampitude_sci_ch3_corrected = Ampitude_sci_ch3 – Ampitude_sci_ch1_corrected*fraction2
Zero-path Calibrations: A “zero-path” test is employed to determine the end-to-end calibration of the relative wavelength dependence in the optical transmittance of the transmitted beams and received signals. It is based on the assumption that the optical depth calculated from each on/off wavelength pair from this very short, or zero-length path, will be zero. These multiplicative factors, when applied to the off-line reference signals, will produce a differential optical depth of zero for the test data. Due to configuration changes during the experiment, the following set of campaign mean zero-path calibration factors have been applied to the off-line reference signals:
- May 25 through Aug. 16: 0.99857367 * off-short and 0.98825053 * off-long
- Aug. 17 through Aug. 20: 1.00024877 * off-short and off-long not operational
- Aug. 21 through Aug. 28: 0.9980162 * off-short and 0.9978131 * off-long
Range Offsets: The “zero-path” calibration data are also used to determine range offset values for each wavelength which account for the length of the optical fibers within the MFLL instrument. The campaign mean values are 8.74, 8.77, and 8.88 meters for on, off-short, and off-long range estimates, respectively. Flight specific range offsets, which vary from the means by a fraction of a meter, were used in this data set. The range offset is subtracted from the measured range of each channel. For example, the calibrated range from the aircraft to the surface is calculated as Range_ch2 = Range_sci_ch2 - Range_ref_ch2 - Range_offset(2).
Aircraft Pitch Adjustment: The aircraft pitch and roll are from the REVEAL housekeeping data of the NASA C-130, and they are adjusted to account for the orientation of the MFLL instrument within the aircraft. For this campaign, 3.3° was subtracted from the aircraft pitch.
Wavelength Calibration: The MFLL instrument measures the three transmitted wavelengths and that of the wavelength reference (WR) laser. During this campaign, fluctuations in wavelengths were observed that were correlated with changes in ambient cabin pressure and temperature. These were attributed to uncertainties in the wavelength measuring hardware and thus not representative of actual changes in the wavelength of the transmitted light. The difference between the WR laser’s measured wavelength and the known wavelength of this laser was used to remove these fluctuations from the transmitted wavelengths. To minimize this source of uncertainty in the measured wavelengths, the old WR laser was replaced during the 2016 campaign. Thus the calibrated measured wavelength for each channel is calculated as:
- Before 8/14/16: Cal wavelength = measured wavelength in nm – (measured WR in nm – 1571.15008 nm)
- From 8/14/16 onward: Cal wavelength = measured wavelength in nm – (measured WR in nm – 1530.37096 nm)
Bias Correction: An empirical data calibration procedure is applied to Level 1B DAOD data to remove altitude-dependent systematic DAOD bias errors using calibration data obtained during designated atmospheric profiling test flights. The bias correction that was applied to the slant-path on/off-short DAOD is:
- delta_od_pct = -2.8169549 * DAOD + 2.3737678
- daod_corr = DAOD – ( delta_od_pct * 1e-2 * DAOD)
Data Access
These data are available through the Oak Ridge National Laboratory (ORNL) Distributed Active Archive Center (DAAC).
ACT-America: L1 DAOD Measurements by Airborne CO2 Lidar, Eastern USA
Contact for Data Center Access Information:
- E-mail: uso@daac.ornl.gov
- Telephone: +1 (865) 241-3952
References
Campbell, Joel F, "Nonlinear swept frequency technique for CO2 measurements using a CW laser system," Appl. Opt. 52, 3100-3107 (2013) https://doi.org/10.1364/AO.52.003100
Campbell, J., B. Lin, A. Nehrir, F.W. Harrison, M. Obland Super-resolution technique for CW lidar using Fourier transform reordering and Richardson–Lucy deconvolution, Optics Letters, 39, 6981-6984 (2014A). https://doi.org/10.1364/OL.39.006981
Campbell, Joel F., Bing Lin, Amin R. Nehrir, F. Wallace Harrison, and Michael D. Obland, "Binary phase shift keying on orthogonal carriers for multi-channel CO2 absorption measurements in the presence of thin clouds," Opt. Express 22, A1634-A1640 (2014B) https://doi.org/10.1364/OE.22.0A1634
Campbell, Joel F., Bing Lin, Amin R. Nehrir, F. Wallace Harrison, and Michael D. Obland, "High-resolution CW lidar altimetry using repeating intensity-modulated waveforms and Fourier transform reordering," Opt. Lett. 39, 6078-6081 (2014C) https://doi.org/10.1364/OL.39.006078
Dobler, Jeremy T., F. Wallace Harrison, Edward V. Browell, Bing Lin, Doug McGregor, Susan Kooi, Yonghoon Choi, and Syed Ismail, "Atmospheric CO2 column measurements with an airborne intensity-modulated continuous wave 1.57 μm fiber laser lidar," Appl. Opt. 52, 2874-2892 (2013) https://doi.org/10.1364/AO.52.002874
Global Land One-kilometer Base Elevation (GLOBE) GLOBE Task Team and others (Hastings, David A., Paula K. Dunbar, Gerald M.Elphingstone, Mark Bootz, Hiroshi Murakami, Hiroshi Maruyama, Hiroshi Masaharu, Peter Holland, John Payne, Nevin A. Bryant, Thomas L. Logan, J.-P. Muller, Gunter Schreier, and John S. MacDonald), eds., 1999. The Global Land One-kilometer Base Elevation (GLOBE) Digital Elevation Model, Version 1.0. National Oceanic and Atmospheric Administration, National Geophysical Data Center, 325 Broadway, Boulder, Colorado 80303, U.S.A. Digital data base on the World Wide Web (URL: http://www.ngdc.noaa.gov/mgg/topo/globe.html) and CD-ROMs.
Lin, B., J.F. Campbell, J. Dobler, E.V. Browell, S.A. Kooi, S. Pal, T. Fan, W. Erxleben, D. Mcgregor, M.D. Obland, and C. O'Dell. 2018. ACT-America: L2 Remotely Sensed Column-average CO2 by Airborne Lidar, Eastern USA. ORNL DAAC, Oak Ridge, Tennessee, USA. https://doi.org/10.3334/ORNLDAAC/1649
Lin, Bing, Syed Ismail, F. Wallace Harrison, Edward V. Browell, Amin R. Nehrir, Jeremy Dobler, Berrien Moore, Tamer Refaat, and Susan A. Kooi, "Modeling of intensity-modulated continuous-wave laser absorption spectrometer systems for atmospheric CO2 column measurements," Appl. Opt. 52, 7062-7077 (2013) https://doi.org/10.1364/AO.52.007062
Lin, Bing, Amin R. Nehrir, F. Wallace Harrison, Edward V. Browell, Syed Ismail, Michael D. Obland, Joel Campbell, Jeremy Dobler, Byron Meadows, Tai-Fang Fan, and Susan Kooi, "Atmospheric CO2 column measurements in cloudy conditions using intensity-modulated continuous-wave lidar at 1.57 micron," Opt. Express 23, A582-A593 (2015) https://doi.org/10.1364/OE.23.00A582