Documentation Revision Date: 2020-06-10
Dataset Version: 1.1
Summary
ACT-America's objectives are to study the transport and fluxes of atmospheric CO2 and CH4. At times they flew directly under Orbiting Carbon Observatory-2 (OCO-2) overpasses to evaluate the ability of OCO-2 to observe high-resolution atmospheric CO2 variations.
This dataset provides results from all five campaigns (i.e. the Summer 2016, Winter and Fall 2017, Spring 2018, and Summer 2019) of the ACT-America project and contains 289 ICARTT files and 289 netCDF files, one file of each type per flight.
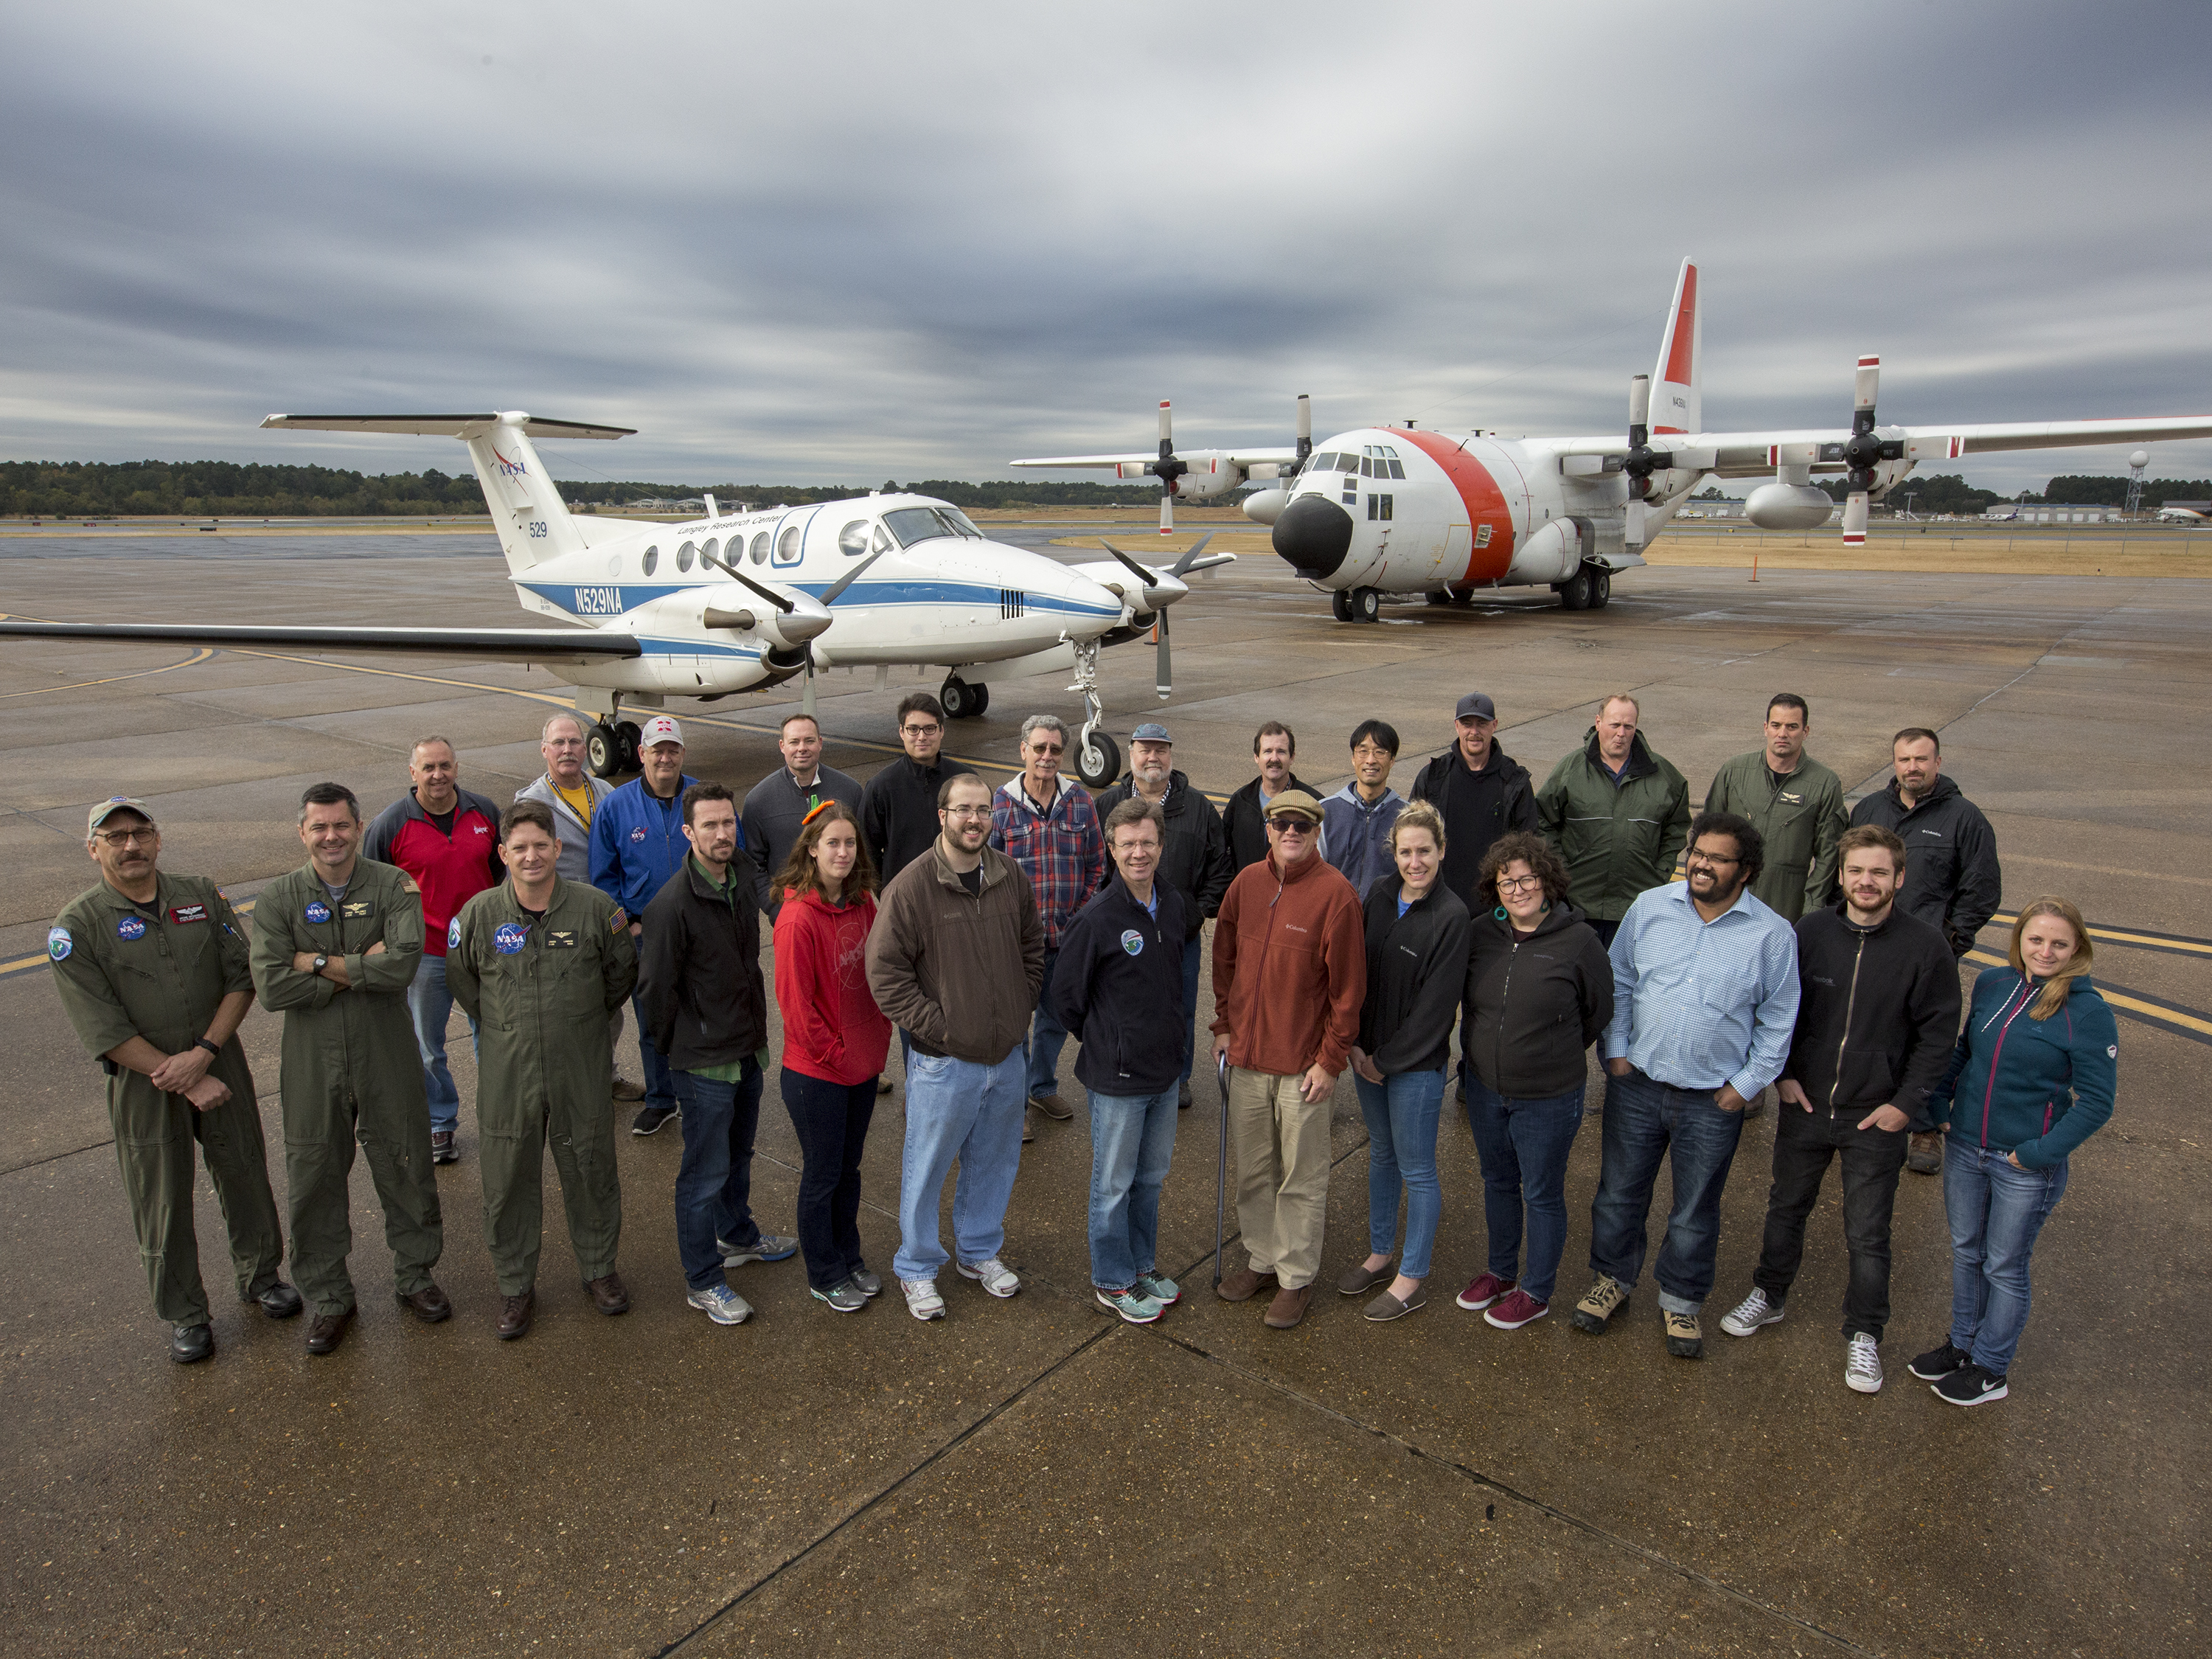
Figure 1. The ACT-America team on the tarmac with the B-200 King Air and C-130 Hercules NASA aircraft in Shreveport, Louisiana.
Citation
Yang, M.M., J.D. Barrick, C. Sweeney, J.P. DiGangi, and J.R. Bennett. 2018. ACT-America: L1 Meteorological and Aircraft Navigational Data. ORNL DAAC, Oak Ridge, Tennessee, USA. https://doi.org/10.3334/ORNLDAAC/1574
Table of Contents
- Dataset Overview
- Data Characteristics
- Application and Derivation
- Quality Assessment
- Data Acquisition, Materials, and Methods
- Data Access
- References
- Dataset Revisions
Dataset Overview
This dataset provides aircraft navigational parameters and related meteorological data (often referred to as "housekeeping" data) in support of the research activities for the two aircrafts that flew for the NASA Atmospheric Carbon and Transport-America (ACT-America) project. ACT-America's mission spans five years and includes five 6-week intensive field campaigns covering all 4 seasons and 3 regions of the central and eastern United States. Two instrumented aircraft platforms, the NASA Langley Beechcraft B200 King Air and the NASA Goddard Space Flight Center's C-130H Hercules, were used to collect high-quality in situ measurements across a variety of continental surfaces and atmospheric conditions. During these flights, aircraft positional, meteorological, and environmental data are recorded by a variety of instruments. For this dataset, measurements include, but are not limited to: latitude, longitude, altitude, ground speed, air temperature, and wind speed and direction. These data are incorporated into related ACT-America flight-instrumented datasets to provide geotrajectory file information for position, attitude, and altitude awareness of instrumented sampling.
Project: Atmospheric Carbon and Transport (ACT-America)
The ACT-America, or Atmospheric Carbon and Transport - America, project is a NASA Earth Venture Suborbital-2 mission to study the transport and fluxes of atmospheric carbon dioxide and methane across three regions in the eastern United States. Each flight campaign measures how weather systems transport these greenhouse gases. Ground-based measurements of greenhouse gases were also-collected. Better estimates of greenhouse gas sources and sinks are needed for climate management and for prediction of future climate.
Dataset Visualization: Visualize ACT-America Data
Data Characteristics
Spatial Coverage: Flights over eastern and central United States
Spatial Resolution: Point measurements
Temporal Coverage: Periodic flights occurred during each intensive campaign.
| Campaign | Beginning and ending dates |
| Summer 2016 | 2016-05-27 to 2016-08-29 |
| Winter 2017 | 2017-01-21 to 2017-03-10 |
| Fall 2017 | 2017-09-22 to 2017-11-13 |
| Spring 2018 | 2018-03-28 to 2018-05-20 |
| Summer 2019 | 2019-06-07 to 2019-07-27 |
Temporal Resolution: 1 second
Study Area: (coordinates in decimal degrees)
| Site | Westernmost Longitude | Easternmost Longitude | Northernmost Latitude | Southernmost Latitude |
| Eastern and Central United States | -106.494 | -71.9109 | 49.1083 | 28.562 |
Data File Information
There are 289 data files in netCDF (*.nc) version 4 format following Climate and Forecast (CF) conventions 1.6. NetCDF files are structured as GeoTrajectory files, where the observations for a flight segment are connected along a one-dimensional track in space, with time increasing monotonically along the track. These files contain data from the respective aircraft’s flight parameters and related environmental data.
There are 289 data files in the ICARTT file format (*.ict). ICARTT files have detailed header information and follow the standards established and summarized in the ICARTT File Format Standards V1.1. https://www-air.larc.nasa.gov/missions/etc/IcarttDataFormat.htm. The ICARTT files contain the same flight data as the NetCDF files. The flight data are available from the ACT-America P3-B Data System (PDS; for B-200 flights) and Housekeeping data (for C-130 flights). Files are organized by data system and aircraft (B-200 and C-130).
Naming conventions are the same for both file formats. Files are organized by instrument and aircraft for the flight(s) on a given date.
ACT-America file naming convention
File names are standardized by:
project-instrument_aircraft_YYYYMMDD_R#_L#.ext
where:
project = ACTAMERICA
data system = either 'Hskping' or 'PDS'
aircraft = either 'c130' or 'B200'
YYYYMMDD = flight date (UTC)
R# = revision number of data. A higher number indicates a more recent revision.
L# = optional launch number. Some flights had more than one sortie or launch.
ext = file extension. either '.nc' for NetCDF or '.ict' for ICARTT
Companion Files
Additional information on the aircraft platforms deployed by ACT-America is provided in the accompanying files: Platform_B200.pdf, Platform_C130.pdf, and ACTAMERICA_Hskping_Experimenter_Handbook_Jan2011v2.pdf.
Data Dictionary:
| Variable name | Description | Units |
|---|---|---|
| Flight Information | ||
| Aircraft_Sun_Azimuth | aircraft sun azimuth | degree |
| Aircraft_Sun_Elevation | aircraft sun elevation | degree |
| Cabin_Pressure | cabin pressure | mb |
| Day_of_Year | day of year starting Jan 1 UTC | d |
| Dew_Point | dew point | Celcius |
| Drift_Angle | drift angle | degree |
| Flight_ID | flight identification (aircraft and flight date) | NA |
| GPS_Altitude | global positioning system altitude | meters |
| Ground_Speed | ground speed | meters per second |
| Indicated_Air_Speed | indicated air speed | meters per second |
| Latitude | latitude | degree north |
| Longitude | longitude | degree east |
| Mach_Number | mach number | mach |
| **ManeuverFlag | data flag for sampling based on aircraft maneuver | NA |
| Mixing_Ratio | H2O mixing ratio | g per kg |
| Part_Press_Water_Vapor | H2O vapor pressure | mb |
| Pitch_Angle | pitch angle | degree |
| Potential_Temp | potential temperature | Kelvin |
| Pressure_Altitude | pressure altitude | ft |
| Relative_Humidity | relative humidity | percent |
| Roll_Angle | roll angle | degree |
| Sat_Vapor_Press_H2O | H2O sat vapor pressure of water | mb |
| Sat_Vapor_Press_Ice | H2O sat vapor pressure of ice | mb |
| Solar_Zenith_Angle | Solar zenith angle | degree |
| Start_UTC | start UTC time of day | seconds |
| Static_Air_Temp | static air temperature | Celcius |
| Static_Pressure | static pressure | mb |
| Sun_Azimuth | sun azimuth | degree |
| *time | time | seconds since 2016-01-01 00:00:00.0 UTC |
| Total_Air_Temp | total air temperature | Celcius |
| Track_Angle | track angle | degree |
| True_Air_Speed | true air speed | kts |
| True_Heading | true heading | degree |
| Vertical_Speed | vertical speed | m per minute |
| Wind_Direction | wind direction | degree |
| Wind_Speed | wind speed | m per second |
| Elevation | ||
| Altitude_AGL_m | Aircraft altitude above ground level | m |
| Ground_Elevation_m | Ground elevation a.m.s.l. | m |
| Out of Range or Missing | ||
| ulod_flag | Data greater than the upper limit of detection | -7777 |
| llod_flag | Data less than the lower limit of detection | -8888 |
| Missing data, nodata, or _FillValue | -9999 |
* "Flight_ID" and "time" provided only in netCDF files.
** Only available in C-130 aircraft files. ManeuverFlag definition: 0 = on ground; 1 = take off; 2 = in-line ascent; 3 = in-line descent; 4 = spiral up; 5 = spiral down; 6 = constant altitude legs; 7 = landing.
Application and Derivation
ACT-America, or Atmospheric Carbon and Transport – America, conducted five airborne campaigns across three regions in the eastern United States to study the transport of atmospheric carbon. The eastern half of the United States is a region that includes a highly productive biosphere, vigorous agricultural activity, extensive gas and oil extraction and consumption, dynamic, seasonally varying weather patterns and the most extensive carbon cycle and meteorological observing networks on Earth, serves as an ideal setting for the mission.
Each 6-week campaign accurately and precisely quantifies anomalies in atmospheric carbon, also known as Carbon Flux. Accurate carbon flux data is necessary to address all terrestrial carbon cycle science questions. ACT-America addresses the three primary sources of uncertainty in atmospheric inversions — transport error, prior flux uncertainty and limited data density.
ACT-America advances society’s ability to predict and manage future climate change by enabling policy-relevant quantification of the carbon cycle. Sources and sinks of atmospheric carbon dioxide (CO2) and methane (CH4) are poorly known at regional to continental scales. ACT-America enables and demonstrates a new generation of atmospheric inversion systems for quantifying CO2 and CH4 sources and sinks.
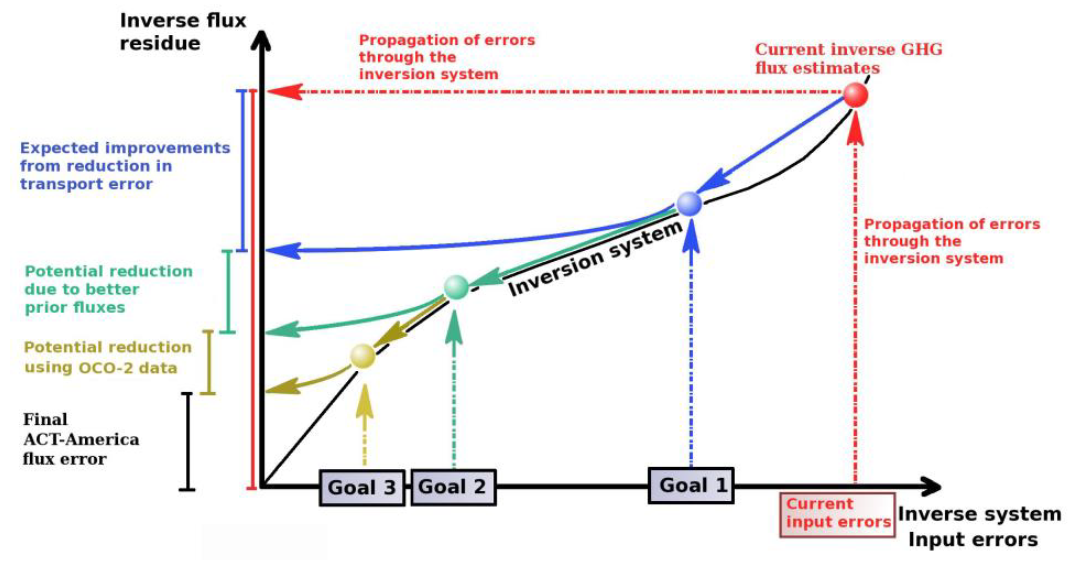 Figure 2. A schematic showing ACT-America project goals.
ACT-America Goals:
- To quantify and reduce atmospheric transport uncertainties.
- To improve regional-scale, seasonal prior estimate of CO2 and CH4 fluxes.
- To evaluate the sensitivity of Orbiting Carbon Observatory (OCO-2) column measurements to regional variability in tropospheric CO2.
ACT-America achieves these goals by deploying airborne and ground-based platforms to obtain data that can be combined with data from existing measurement networks and integrated with an ensemble of atmospheric inversion systems. Aircrafts instrumented with remote and in situ sensors observe how mid-latitude weather systems interact with CO2 and CH4 sources and sinks to create atmospheric CO2/CH4 distributions. A model ensemble consisting of a mesoscale atmospheric transport model with multiple physics and resolution options nested within global inversion models and surface CO2/CH4 flux ensembles is used to predict atmospheric CO2 and CH4 distributions.
Beyond the conclusion of the mission, application of the knowledge gained from this mission will improve diagnoses of the carbon cycle across the globe for decades.
Quality Assessment
Within the data, nodata and out-of-range values are provided in the dataset as described. The table below lists the uncertainties associated with the corresponding instruments.
| Variable name | C-130 System | B-200 System |
|---|---|---|
| Latitude/Longitude/GPS_Altitude | 5 meters spherical error probability * | 5 meters spherical error probability * |
| Ground Speed | 0.01 m/s * | 0.05 m/s * |
| True_Heading | 0.015 deg * | 0.07 deg * |
| Pitch_Angle, Roll_Angle | 0.01 deg * | 0.01 deg * |
| Dew_Point | 0.2 deg C * | 0.5 – 1.0 C (Dynamic Cond,) |
| Total_Air_Temp | 1.5 deg C * | +/- 0.6 C (Dynamic Cond.) |
| Cabin_Pressure | 0.25% FS * | NA |
* Uncertainties quoted on instrument spec sheet
Data Acquisition, Materials, and Methods
ACT-America Overview
The eastern half of the United States, a region that includes a highly productive biosphere, vigorous agricultural activity, extensive gas and oil extraction, dynamic, seasonally varying weather patterns and the most extensive carbon cycle and meteorological observing networks on Earth, serves as an ideal setting for the mission. Flights concentrated observations on three study domains: Northeast, South-central, and Midwest.
ACT-America deployed the NASA C-130 and B-200 aircraft to measure atmospheric CO2 and CH4 in the atmospheric boundary layer (ABL) and free troposphere (FT). The mission conducted a total of 121 science flights, more than 1140 hours of observations, dedicated in a roughly 3:3:1 ratio among fair weather, stormy weather, and OCO-2 underpass flight patterns.
For fair and stormy weather flights, the C-130 flew at 3-8 km above ground, collecting in situ measurements in the lower FT, remotely sensed, column-averaged CO2 measurements focused on the ABL, and occasional in situ vertical profiles. The B-200 primarily sampled the ABL. For OCO-2 underflights, the C-130 flew at 8 km above ground with the B-200 flying in the ABL, both along the OCO-2 flight track. The existing in situ tower CO2/CH4 observing network were enhanced with five additional tower sites.
The mission delivered 2-3 times more high-quality lower tropospheric CO2 and CH4 observations than any previous airborne campaign.
Flight Plans
Data from the fair-weather flights are intended to quantify regional CO2 and CH4 fluxes, and to evaluate fair weather atmospheric C transport processes. The flight pattern is designed to provide extensive sampling of the ABL and lower FT in source/sink regions, meeting the requirements for the fair weather investigation. The C-130 aircraft flew a U-shape pattern with flight legs perpendicular to the wind, sampling FT and ABL properties downwind of the sources and sinks of C. The C-130 flew at roughly two times the midday ABL depth, (~3-4 km above ground level (AGL)) with periodic descents and ascents (5 to 10 times in a 6-8-hr flight) to sample the ABL. Although clear sky conditions were targeted, the C-130 conducted more profiling if low-altitude clouds interfered with the remote sensors. The B-200 aircraft partook in two flights per day and sampled a subset of the C-130 flight path focusing on long transects in the ABL with periodic ascents to the FT. The two aircraft operated over the same time period, but precise coordination was not required.
Data from stormy-weather flights are used in combination with the data from fair-weather flights to evaluate the transport of C in the mid-latitudes. The flight plans include flight legs parallel to and crossing frontal boundaries at two or more altitudes, and crossing the frontal zone at two or more locations, meeting the requirements for the stormy weather investigation.
The pattern for the OCO-2 inter-comparison flights was designed to obtain data to evaluate the degree to which OCO-2 column CO2 measurements capture true spatial variability in column CO2 content over the continents. Two OCO-2 under flights were planned to be conducted during each campaign and would be selected to cover varying surface reflectance, topography, and aerosol and cloud cover, all possible sources of bias in the OCO-2 measurements. The C-130 flights would be 1000 km in length and flown at 8 km (28 kft) altitude to maximize the fraction of the atmospheric column sampled by the MFLL. The B-200 aircraft would sample a shorter (~360 km) leg in the ABL, often the largest source of variability in column CO2. The B-200 flight would be centered with the C-130 and both aircraft would be vertically stacked during the OCO-2 overpass.
Airborne Instruments
For this dataset, the table below lists the names and model number of the instruments used to collect the flight parameters and environmental data, where applicable. For detailed information on the instrumentation, see the information in the ACTAMERICA_Hskping_Experimenter_Handbook_Jan2011v2.pdf contained in the companion files in this dataset.
| Variable | C-130 Data System | B-200 Data System |
| Latitude | Honeywell H-764 | Applanix Model 510 V5 |
| Longitude | Honeywell H-764 | Applanix Model 510 V5 |
| GPS_Altitude | Honeywell H-764 | Applanix Model 510 V5 |
| Pressure_Altitude | derived | Derived (Honeywell PPT2) |
| Ground_Speed | Honeywell H-764 | Applanix Model 510 V5 |
| True_Air_Speed | derived | Derived |
| Indicated_Air_Speed | derived | NA |
| Mach_Number | Collins ADC_86A (Calculated from Pitot-Static system) | Honeywell PPT2 (Calculated from Pitot-Static system) |
| Vertical_Speed | Collins ADC_86A | NA |
| True_Heading | Honeywell H-764 | Hemisphere DGPS – VS131 |
| Track_Angle | Honeywell H-764 | Applanix Model 510 V5 |
| Drift_Angle | Honeywell H-764 | NA |
| Pitch_Angle | Honeywell H-764 | Applanix Model 510 V5 |
| Roll_Angle | Honeywell H-764 | Applanix Model 510 V5 |
| Static_Air_Temp | Derived from Total_Air_Temp & Mach_Number | Derived from Total_Air_Temp & Mach_Number |
| Potential_Temp | Derived from Static_Air_Temp and Static_Pressure | Derived from Static_Air_Temp and Static_Pressure |
| Dew_Point | Edgetech Vigilant 137, 3-stage TEC | Edgetech Vigilant 137, 3-stage TEC |
| Total_Air_Temp | Rosemount 102 deiced | Rosemount 102 deiced |
| Static_Pressure | Honeywell PPT2 | Honeywell PPT2 |
| Cabin_Pressure | Measurement Specialties EPRB-2-XU63-30P-/Z1 | NA |
| Wind_Speed | Derived from EGI | Derived Using Applanix & DGPS Heading |
| Wind_Direction | Derived from EGI | Derived Using Applanix & DGPS Heading |
| Solar_Zenith_Angle | derived | NA |
| Aircraft_Sun_Elevation | derived | NA |
| Sun_Azimuth | derived | NA |
| Aircraft_Sun_Azimuth | derived | NA |
| Mixing_Ratio | derived | Derived |
| Part_Press_Water_Vapor | derived | Derived |
| Sat_Vapor_Press_H20 | derived | Derived |
| Sat_Vapor_Press_Ice | derived | Derived |
| Relative_Humidity | derived | Derived |
Data Access
These data are available through the Oak Ridge National Laboratory (ORNL) Distributed Active Archive Center (DAAC).
ACT-America: L1 Meteorological and Aircraft Navigational Data
Contact for Data Center Access Information:
- E-mail: uso@daac.ornl.gov
- Telephone: +1 (865) 241-3952
References
ICARTT files have detailed header information and follow the standards established and summarized in the ICARTT File Format Standards V1.1. https://www-air.larc.nasa.gov/missions/etc/IcarttDataFormat.htm
Dataset Revisions
Version 1.1 (released 2020-06-10) updated all data from Summer 2016 and Winter 2017 campaigns and data from the Fall 2017, Spring 2018 and Summer 2019 campaign were added to this dataset.
Version 1.0 (released 2018-04-17) provided data from Summer 2016 and Winter 2017 campaigns.