Documentation Revision Date: 2025-06-21
Dataset Version: 1
Summary
This dataset contains 800 files; 330 in JPEG, 238 in Portable Network Graphics,123 in compressed Keyhole Markup Language (KMZ), 108 in Portable Document Format (PDF), and one in comma separated values (CSV) formats.
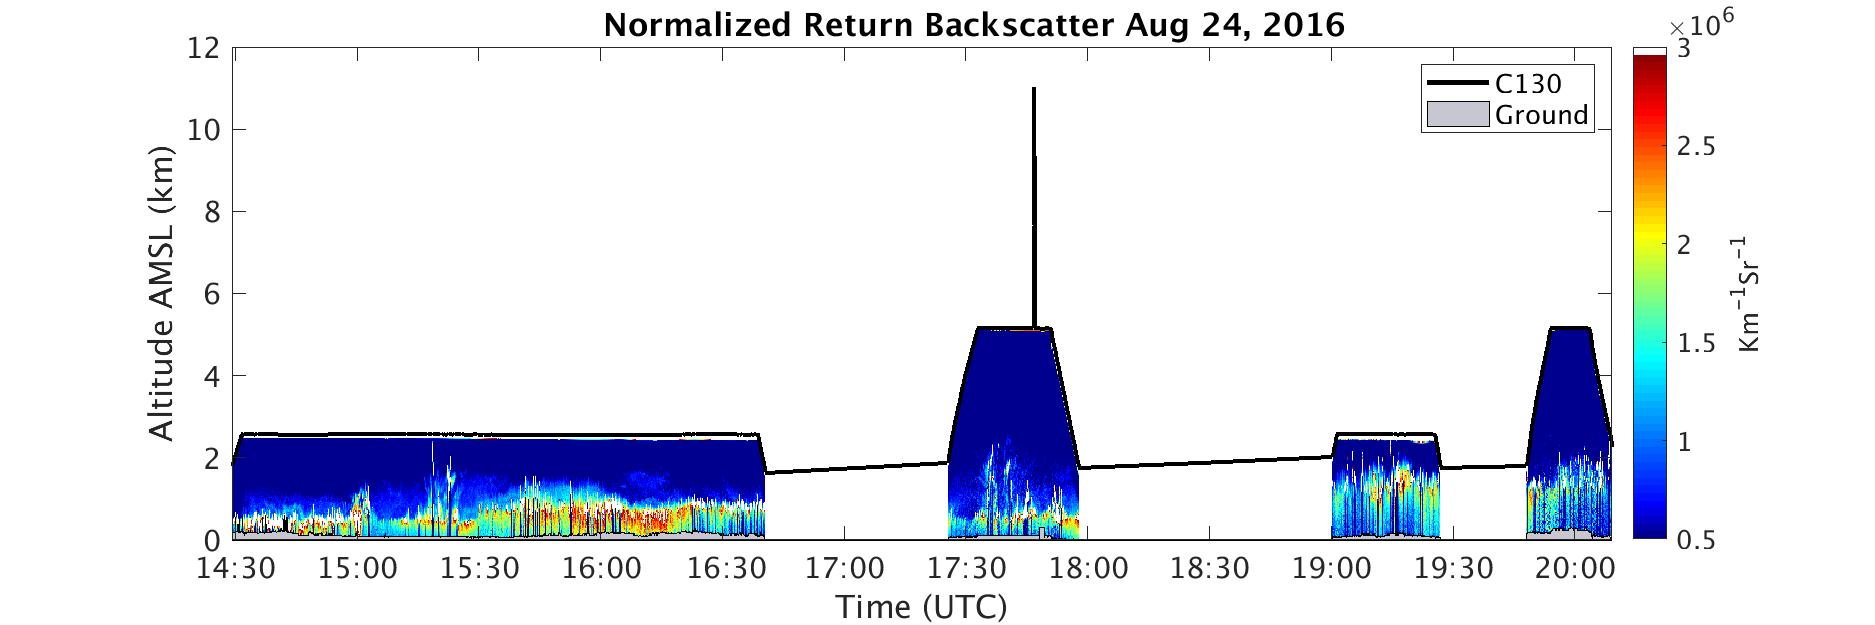
Figure 1. A time-height cross-section of lidar-derived normalized aerosol backscatter on 2016-08-24.
Citation
Pal, S., and K.J. Davis. 2021. ACT-America Campaign Catalog. ORNL DAAC, Oak Ridge, Tennessee, USA. https://doi.org/10.3334/ORNLDAAC/1862
Table of Contents
- Dataset Overview
- Data Characteristics
- Application and Derivation
- Quality Assessment
- Data Acquisition, Materials, and Methods
- Data Access
- References
- Dataset Revisions
Dataset Overview
The ACT-America Campaign Catalog provides information about the airborne campaigns of the Atmospheric Carbon and Transport (ACT-America) project. ACT-America advanced atmospheric greenhouse gas inversions to a high level of accuracy and precision through new methods and models that improved knowledge of atmospheric transport, prior flux models, and space-based observations. The catalog compiles flight details for the five campaigns conducted during Summer 2016, Winter 2017, Fall 2017, Spring 2018, and Summer 2019 (2016-05-27 to 2019-07-26) across three regions of the eastern and central United States. Data include flight dates, regions, objectives, weather conditions, instrument status, aircraft flight paths, detailed weather reports, and measurement summary figures.
A total of 121 research flights were conducted within the five six-week seasonal campaigns by each of the two instrumented aircraft platforms, the NASA Langley Beechcraft B-200 King Air and the NASA Wallops Flight Facility's C-130 Hercules. During 1,140 flight hours remote and in situ sensors onboard the two research aircraft measured greenhouse gas mole fractions, trace gases, and thermodynamic variables across a variety of continental surfaces and atmospheric conditions to study the transport and fluxes of atmospheric carbon dioxide and methane. As noted in the Flight_patterns_staus field, there were flights when both aircraft flew directly under Orbiting Carbon Observatory-2 (OCO-2) overpasses to evaluate the ability of OCO-2 to observe high-resolution atmospheric CO2 variations. The C-130 aircraft was also equipped with active remote sensing instruments for planetary boundary layer height detection and column greenhouse gas measurements.
Project: ACT-America
The ACT-America, or Atmospheric Carbon and Transport - America, project is a NASA Earth Venture Suborbital-2 mission to study the transport and fluxes of atmospheric carbon dioxide and methane across three regions in the eastern United States. Flight campaigns measured transport of greenhouse gases by continental-scale weather systems. Ground-based measurements of greenhouse gases were also collected. Project goals include better estimates of greenhouse gas sources and sinks which are required for climate management and for prediction of future climate.
Related Datasets:
For a full list of related datasets, see the ACT-America project page at https://daac.ornl.gov/actamerica.
Acknowledgments:
This work was supported by NASA's EVS-2 (grant NNX15AG76G) and ACT-America (grant 80NSSC19K0730) programs with support from Texas Tech University to compile this catalog.
Data Characteristics
Spatial Coverage: Eastern and Central United States
Temporal Coverage: Periodic flights occurred during each intensive campaign
| Campaign | Data Beginning and Ending Dates |
|---|---|
| Summer 2016 | 2016-05-27 to 2016-08-29 |
| Winter 2017 | 2017-01-21 to 2017-03-10 |
| Fall 2017 | 2017-09-22 to 2017-11-13 |
| Spring 2018 | 2018-03-28 to 2018-05-20 |
| Summer 2019 | 2019-06-20 to 2019-07-26 |
Study Area: Latitude and longitude are given in decimal degrees.
| Site | Westernmost Longitude | Easternmost Longitude | Northernmost Latitude | Southernmost Latitude |
|---|---|---|---|---|
| Eastern and Central United States | -106.49 | -73.35 | 48.28 | 28.65 |
Data File Information
This dataset contains 800 files; 330 in JPEG (*.jpg), 238 in Portable Network Graphics (*.png),123 in Keyhole Markup Language (*.kmz), 108 in Portable Document Format (*.pdf), and one in comma separated values (*.csv) format. There are six groupings of files: backscatter, CH4 and CO2 cross section, CH4 and CO2 map view, flight metadata, flight track, and weather details:
- Backscatter
- Images containing time-height cross-section of lidar-derived normalized aerosol backscatter field. The images also show the location of aircraft altitude and ground height in m above mean sea level (MSL). During the first four field campaigns (i.e., Summer 2016, Winter 2017, Fall 2017, and Spring 2018), the CPL (Cloud Physics Lidar) onboard C-130 was deployed. During the Summer 2019 field campaign, the HALO-HSRL (High-Spectral Resolution Lidar onboard High Altitude Lidar Observatory) onboard C-130 was deployed. HALO-HSRL files also overlay the aerosol backscatter field on a map of the study area.
- Files are named: YYYYMMDD _Backscatter_Lidar_Instrument.jpg;
where YYYYMMDD is the flight date and Instrument is CPL or HALO_HSRL_532nm.
- CH4 and CO2 Cross Section
- Contains images showing 5-second averaged atmospheric CO2 or CH4 mole fractions (PICARO) on latitude-versus-altitude and longitude-versus-altitude flight track cross-section frames.
- Files are named: YYYYMMDD_Analyte_CrossSection.jpg;
where YYYYMMDD is the flight date and Analyte is CO2 or CH4.
- CH4 and CO2 Map View
- Contains images showing 5-second averaged atmospheric CO2 or CH4 mole fractions (PICARO) in ppb at 2500 m above MSL displayed on the flight line. Flight lines are overlaid on a map of the study area.
- Files are named: YYYYMMDD_Analyte_MapView_2500_m_MSL.png;
where YYYYMMDD is the flight date and Analyte is CO2 or CH4.
- Flight Metadata
- Contains metadata for each flight including the campaign, date, weather, and the status of each aircraft and its instruments. See Table 1 for additional details.
- This file is named: ACT-America_flight_metadata.csv
- Flight Track
- Contains flight tracks in compressed Keyhole Markup Language (KMZ) of both aircraft on the same day for viewing in Google Earth.
- Files are named: YYYYMMDD_Flt-Track_ACT-America_Plane.kmz;
where YYYYMMDD is the flight date and Plane is B200, C130 or C130_B200.
- Weather Details
- Observed synoptic weather conditions, radar images, precipitation distributions, radiosonde profiles of thermodynamic variables, etc., on the day of the research flight are provided in a PDF document.
- Files are named: YYYYMMDD_Weather_Summary.pdf; where YYYYMMDD is the flight date.
Table 1. Data dictionary for ACT-America_flight_metadata.csv.
| Variable | Units | Description |
|---|---|---|
| Date | YYYY-MM-DD | Date of the research flight (RF). |
| Campaign | ACT-America campaign: Summer 2016, Winter 2017, Fall 2017, Spring 2018, or Summer 2019 | |
| Region | Region covered during flight: MA (Mid-Atlantic), MW (Mid-West), and South (Southern region around the Gulf states). The regions encompass a variety of biomes (Midwest agriculture, Northeast forests, Southeast coastal forests, and agriculture) and oil and gas extraction zones. Each region is large enough to encompass the weather systems that are the target of the project, and the regions encompass a broad range of mid-latitude weather environments. | |
| Weather_conditions | A brief description of prevailing synoptic weather conditions that are the target for the flight. Detailed reports are provided in the Weather Details files. | |
| Flight_patterns_staus | Details about the plan and instrument statuses |
Application and Derivation
ACT-America, or Atmospheric Carbon and Transport - America, conducted five airborne campaigns across three regions in the eastern United States to study the transport and fluxes of atmospheric carbon. The eastern half of the United States is a region that includes a highly productive biosphere, vigorous agricultural activity, extensive gas and oil extraction and consumption, dynamic seasonally varying weather patterns, and the most extensive carbon cycle and meteorological observing networks on Earth. This region serves as an ideal setting for the mission.
Each 6-week campaign accurately and precisely quantified anomalies in atmospheric carbon, also known as carbon flux. Accurate carbon flux data are necessary to address all terrestrial carbon cycle science questions. ACT-America addressed the three primary sources of uncertainty in atmospheric inversions—transport error, prior flux uncertainty, and limited data density.
ACT-America advances society’s ability to predict and manage future climate change by enabling policy-relevant quantification of the carbon cycle. Sources and sinks of atmospheric carbon dioxide (CO2) and methane (CH4) are poorly known at regional to continental scales. ACT-America enables and demonstrates a new generation of atmospheric inversion systems for quantifying CO2 and CH4 sources and sinks.
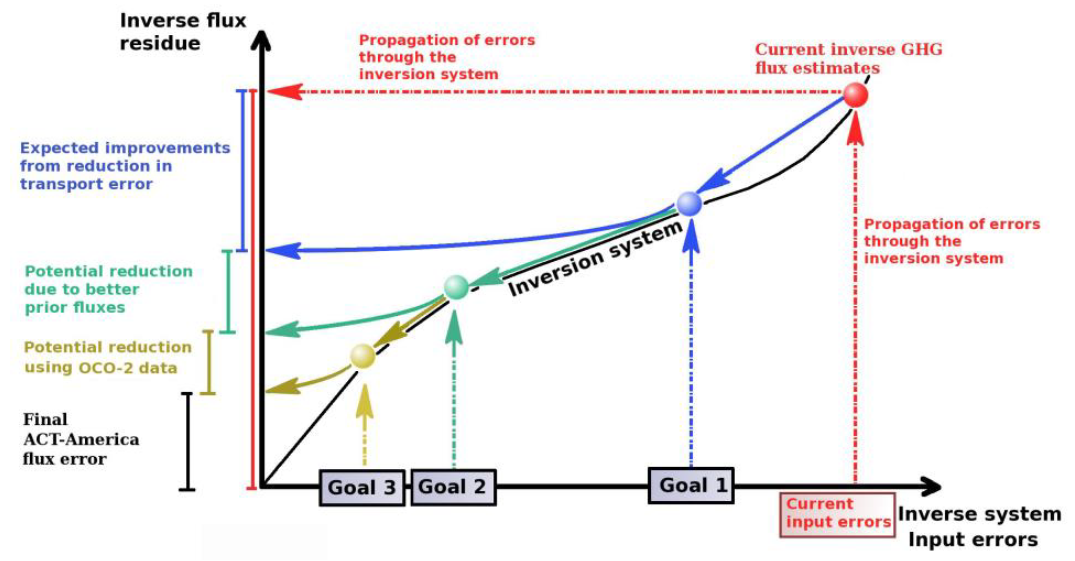
Figure 2. A schematic showing ACT-America mission goals.
ACT-America Goals:
- To quantify and reduce atmospheric transport uncertainties.
- To improve regional-scale, seasonal prior estimates of CO2 and CH4 fluxes.
- To evaluate the sensitivity of Orbiting Carbon Observatory (OCO-2) column measurements to regional variability in tropospheric CO2.
ACT-America achieved these goals by deploying airborne and ground-based platforms to obtain data that were combined with data from existing measurement networks and integrated with an ensemble of atmospheric inversion systems. Aircraft instrumented with remote and in-situ sensors observed how mid-latitude weather systems interact with CO2 and CH4 sources and sinks to create atmospheric CO2/CH4 distributions. A model ensemble consisting of a mesoscale atmospheric transport model with multiple physics and resolutions options nested within global inversion models and surface CO2/CH4 flux ensembles was used to predict atmospheric CO2 and CH4 distributions.
Beyond the conclusion of the mission, the application of knowledge gained from this mission will improve diagnoses of the carbon cycle across the globe for decades.
Quality Assessment
Refer to the documentation for each individual data product for quality assessment information.
Data Acquisition, Materials, and Methods
ACT-America Overview
ACT-America deployed the NASA C-130 and B-200 aircraft to measure atmospheric CO2 and CH4 in the atmospheric boundary layer (ABL) and free troposphere (FT). Across five seasonal campaigns, a total of 121 days of research flights, more than 1,140 hours of observations, 570 level legs, and 1,363 vertical profiles were conducted. Flights concentrated observations on three study domains: Northeast, South-central, and Midwest, US. These flights were dedicated in a roughly 3:3:1 ratio among fair weather, stormy weather, and OCO-2 underpass flight patterns (Crisp et al., 2004, Crisp et al., 2008).
For fair and stormy weather flights, the C-130 flew at 3 - 8 km above ground, collecting in-situ measurements in the lower FT, remotely sensed, column-averaged CO2 measurements focused on the ABL, and occasional in-situ vertical profiles. The B-200 primarily sampled the ABL. For OCO-2 under flights, the C-130 flew at 8 km above ground with the B-200 flying in the ABL, both along the OCO-2 flight track. The existing in situ tower CO2/CH4 observing network was enhanced with five additional tower sites.
The mission delivered 2-3 times more high-quality lower tropospheric CO2 and CH4 observations than any previous airborne campaign.
ACT-America Instruments
ACT-America deployed high-quality, field-tested (TRL-8 (Technology Readiness Level) or higher) trace gas and meteorological instruments. The mix of remote and in situ sensors enabled extensive spatial coverage of key variables. The C-130 instruments included the Multi-Functional Fiber Laser Lidar for CO2 columns, range to ground and surface reflectance; the Cloud Physics Lidar for ABL (Atmospheric boundary layer) depths and atmospheric aerosols; Picarro cavity ring-down spectrometers for in situ CO2, CH4, water vapor, and carbon monoxide (CO); 2B Technologies for in situ ozone; Flasks for CO2, CH4, CO, carbonyl sulfide, and 14CO2; and an environmental suite for in situ pressure, temperature and winds. The B-220 had the same in situ sensors save for winds. Towers utilize Picarro for in situ CO2 and CH4.
For information and documentation on instruments used during the ACT-America campaign, please refer to their related ACT-America dataset. For a list of all ACT-America datasets, see: https://daac.ornl.gov/actamerica.
Data Access
These data are available through the Oak Ridge National Laboratory (ORNL) Distributed Active Archive Center (DAAC).
Contact for Data Center Access Information:
- E-mail: uso@daac.ornl.gov
- Telephone: +1 (865) 241-3952
References
Crisp, D., R. M. Atlas, F.-M. Breon, L. R. Brown, J. P. Burrows, P. Ciais, B. J. Connor, S. C. Doney, I. Y. Fung, D. J. Jacob, C. E. Miller, D. O’Brien, S. Pawson, J. T. Randerson, P. Rayner, R. J. Salawitch, S. P. Sander, B. Sen, G. L. Stephens, P. P. Tans, G. C. Toon, P. O. Wennberg, S. C. Wofsy, Y. L. Yung, Z. Kuang, B. Chudasama, G. Sprague, B. Weiss, R. Pollock, D. Kenyon, and S. Schroll. 2004. The Orbiting Carbon Observatory (OCO) mission. Advances in Space Research 34:700-709. https://doi.org/10.1016/j.asr.2003.08.062
Crisp, D. 2008. NASA Orbiting Carbon Observatory: measuring the column averaged carbon dioxide mole fraction from space. Journal of Applied Remote Sensing 2:023508. https://doi.org/10.1117/1.2898457
Dataset Revisions
| Version | ReleaseDate | Description |
|---|---|---|
| 1.1 | 2025-06-21 | Initial publication of 800 data files as part of this dataset. Files were previously available on a separate webpage as described in Version 1.0 release note. File names for CPL / HALO HSRL backscatter files and flight line files were updated to follow a more consistent naming convention with other files in this dataset. The content of these files was not altered. Flight metadata that was previously available on a separate webpage was converted into a comma separate (*.csv) file: ACT-America_flight_metadata.csv |
| 1.0 | 2021-05-28 | Initial release of user guide for the campaign catalog. Campaign catalog was released as an interactive webpage to allow users explore and access flight information. |