Documentation Revision Date: 2018-09-17
Data Set Version: 1.1
Summary
ACT-America's objectives are to study the transport and fluxes of atmospheric CO2 and CH4. At times they flew directly under Orbiting Carbon Observatory-2 (OCO-2) overpasses to evaluate the ability of OCO-2 to observe high-resolution atmospheric CO2 variations.
This dataset provides results from years 2015 - 2017. New data will be added approximately 6 months after the conclusion of a campaign.
There are a total of 37 files (9 ICARTT files, and 28 netCDF files) in this dataset. Data from 11 towers are provided, although not all towers have data from all years. Data for 2016 are provided in two formats; ICARTT file format (*.ict) and netCDF (*.nc) CF-compliant station-based time series file format. Data for 2015 and 2017 are only available in netCDF format.
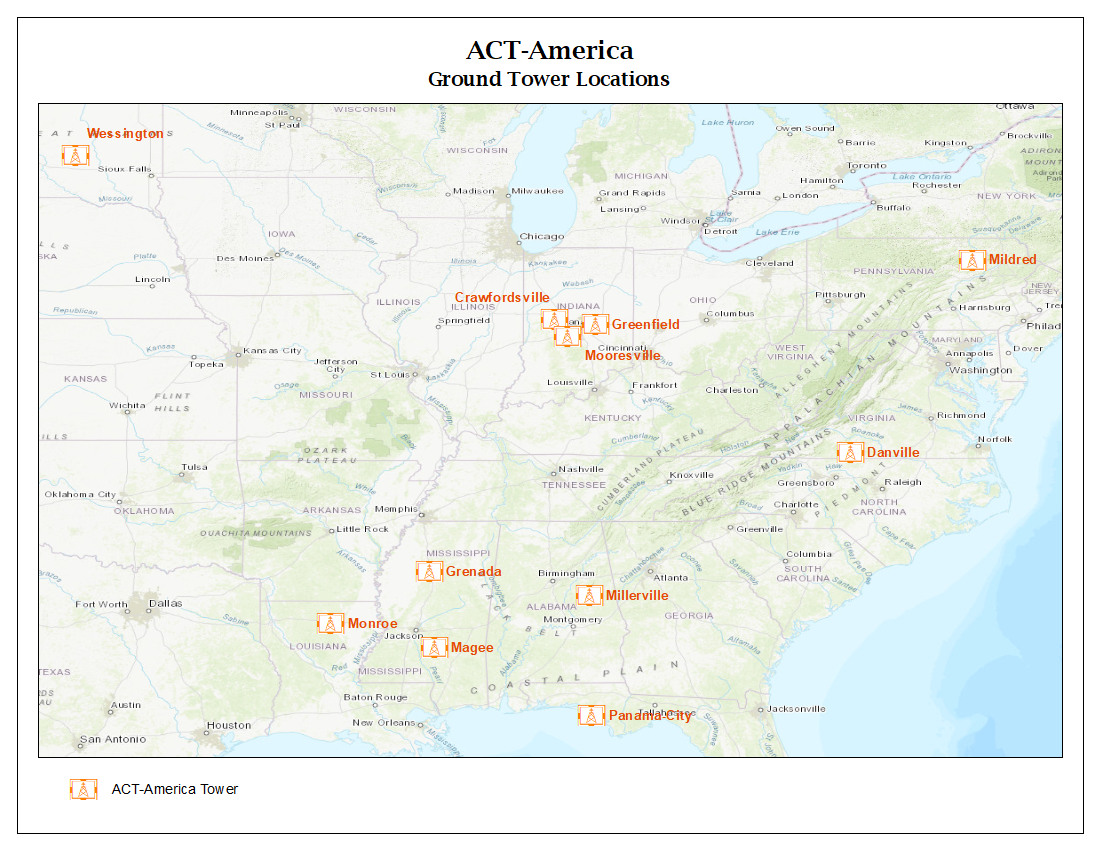
Figure 1: ACT-America atmospheric sampling tower locations.
Citation
Miles, N.L., S.J. Richardson, D.K. Martins, K.J. Davis, T. Lauvaux, B.J. Haupt, and S.K. Miller. 2018. ACT-America: L2 In Situ CO2, CO, and CH4 Concentrations from Towers, Eastern USA. ORNL DAAC, Oak Ridge, Tennessee, USA. https://doi.org/10.3334/ORNLDAAC/1568
Table of Contents
- Data Set Overview
- Data Characteristics
- Application and Derivation
- Quality Assessment
- Data Acquisition, Materials, and Methods
- Data Access
- References
- Data Set Revisions
Data Set Overview
This dataset provides atmospheric carbon dioxide (CO2), carbon monoxide (CO), and methane (CH4) concentrations as measured on a network of instrumented communications towers operated by the Atmospheric Carbon and Transport-America (ACT-America) project. ACT-America's mission spans five years and includes five 6-week intensive field campaigns covering all 4 seasons and 3 regions of the central and eastern United States. Tower-based measurements began in early 2015 and are continuously collecting CO2, CO, and CH4 data to characterize ground-level (>100 m) carbon background conditions to support the periodic airborne measurement campaigns and transport modeling conducted by ACT-America. The towers are instrumented with infrared cavity ring-down spectrometer systems (CRDS; Picarro Inc.). Data are reported for the highest sampling port on each tower. The averaging interval standard deviation and uncertainty derived from periodic flask sample to in-situ measurement comparisons are provided. Complete tower location, elevation, instrument height, and date/time information are also provided.
Project: Atmospheric Carbon and Transport (ACT-America)
The ACT-America, or Atmospheric Carbon and Transport - America, project is a NASA Earth Venture Suborbital-2 mission to study the transport and fluxes of atmospheric carbon dioxide and methane across three regions in the eastern United States. Each flight campaign will measure how weather systems transport these greenhouse gases. Ground-based measurements of greenhouse gases were also-collected. Better estimates of greenhouse gas sources and sinks are needed for climate management and for prediction of future climate.
Acknowledgements:
The Monroe, Magee, Millerville, and Panama City tower sites were supported by the National Aeronautics and Space Administration (Project # NNX14AJ17G for 2015 - 2016, Projects # NNX14AJ17G and # NNX15AG76G for 2017). The Grenada tower site was supported by the National Aeronautics and Space Administration (Project # NNX14AJ17G) for 2015 - 2016. For 2017, it was funded by the National Aeronautics and Space Administration (Projects # NNX14AJ17G and # NNX15AG76G) and the National Oceanic and Atmospheric Administration (Project # RA-133R-18-SE-0020). The Greenfield, Mooresville, and Crawfordsville tower sites were supported by the National Institute of Standards and Technology (Project # 70NANB10H245). The Mildred tower site was supported by the Department of Energy National Energy Technology Laboratory (Project # DE-FOA-0000894) for 2015 - 2016 and by the National Aeronautics and Space Administration (Project # NNX15AG76G) for 2017.
Data Characteristics
Spatial Coverage: Tower locations over eastern and central United States
Spatial Resolution: Point locations
Temporal Coverage: 2015-01-01 to 2017-12-31
Temporal Resolution: Computed mean within each hour.
Study Area: (Coordinates in decimal degrees)
| Site | Westernmost Longitude | Easternmost Longitude | Northernmost Latitude | Southernmost Latitude |
| Eastern and Central United States | -92.2829 | -76.4188 | 41.4662 | 30.1951 |
Data File Information:
Each tower location is contained in a separate file. These files contain greenhouse gases (CO2, CH4 and CO) as dry mole fractions averaged over each hour. The standard deviation within the averaging window and an uncertainty estimate are also provided.
There are 28 data files in netCDF (*.nc) time series (station) file format following CF conventions 1.6.
There are 9 data files in ICARTT file format (*.ict) following ICARTT standards. All ICARTT files have detailed header information and follow the standards established and summarized in the ICARTT File Format Standards V1.1.
Both the netCDF and ICARTT formatted files contain the same greenhouse gas dry mole fraction data.
File naming convention
Naming conventions are the same for both file formats. ACT-America files names are standardized by:
project-instrument_platform-station_startdate_R#_thruenddate.ext
where:
project = ACTAMERICA
instrument = PICARRO
platform = Ground
station = one of the 9 tower site names listed above
startdate = start date in UTC, in YYYYMMDD format
R# = revision number of data. A higher number indicates a more recent revision.
enddate = YYYYMMDD
ext = file extension, either '.nc' for NetCDF or '.ict' for ICARTT
An example file name:
ACTAMERICA-PICARRO_Ground-Danville_20160713_R0_thru20161231.ict
Data Dictionary:
| Variable Name | Description | Units |
|---|---|---|
| Station Information | ||
| altitude | height above ground level | m |
| latitude | site latitude | decimal degrees north |
| longitude | site longitude | decimal degrees east |
| site_name | site name | |
| Time Series Variables | ||
| C2H6 ** | dry C2H6 mixing ratio average between Time_start and Time_stop in parts per billion by volume | ppbv |
| CH4 | dry CH4 mixing ratio average between Time_start and Time_stop in parts per billion by volume | ppbv |
| CH4_std | dry CH4 mixing ratio standard deviation between Time_start and Time_stop in parts per billion by volume | ppbv |
| CH4_unc | estimated CH4 measurement uncertainty in parts per billion by volume | ppbv |
| CH4_IsotopicRatio ** | isotopic ratio (13C/12C) of CH4 in permil | per mil |
| CO | dry CO mixing ratio average between Time_start and Time_stop in parts per billion by volume | ppbv |
| CO_std | dry CO mixing ratio standard deviation between Time_start and Time_stop in parts per billion by volume | ppbv |
| CO_unc | estimated CO measurement uncertainty in parts per billion by volume | ppbv |
| CO2 | dry CO2 mixing ratio average between Time_start and Time_stop in parts per million by volume | ppmv |
| CO2_std | dry CO2 mixing ratio standard deviation between Time_start and Time_stop in parts per million by volume | ppmv |
| CO2_unc | estimated CO2 measurement uncertainty in parts per million by volume | ppmv |
| Data_Flag | data quality indicator | 1 indicates no known problems. 0 indicates that the data is not recommended for use. |
| DOY | day of year of the measurement | day of year |
| H20 ** | water vapor mixing ratio average of the dried sample between Time_start and Time_stop in parts per hundred by volume. Samples are dried, H2O useful only for diagnostic purposes. | % |
| Hour | nominal hour of the measurement | hour |
| Instrument_Flag ** | indicator of the instrument used to make the measurement | 0 = CFKADS2005, 1 = CFKADS2025, 2 = CFKADS2218 |
| N_points ** | number of points included in average | |
| time * | time | hours since 2016-01-01 00:00:00.0 UTC |
| Time_mid | average fractional day of year of the measurement | fractional day of year UTC |
| Time_start | minimum fractional day of year of the measurement | fractional day of year UTC |
| Time_stop | maximum fractional day of year of the measurement | fractional day of year UTC |
| Year | year of the measurement | year |
| Out of Range or Missing | ||
| ulod_flag | Data greater than the upper limit of detection | -7777 |
| llod_flag | Data less than the upper limit of detection | -8888 |
| Missing data, nodata, or _FillValue | -9999 |
* only present in netCDF file dimension and variable
** Not available in all files
Application and Derivation
ACT-America, or Atmospheric Carbon and Transport – America, will conduct five airborne campaigns across three regions in the eastern United States to study the transport of atmospheric carbon. The eastern half of the United States is a region that includes a highly productive biosphere, vigorous agricultural activity, extensive gas and oil extraction and consumption, dynamic, seasonally varying weather patterns and the most extensive carbon cycle and meteorological observing networks on Earth, serves as an ideal setting for the mission.
Each 6-week campaign will accurately and precisely quantify anomalies in atmospheric carbon, also known as Carbon Flux. Accurate carbon flux data is necessary to address all terrestrial carbon cycle science questions. ACT-America addresses the three primary sources of uncertainty in atmospheric inversions — transport error, prior flux uncertainty and limited data density.
ACT-America will advance society’s ability to predict and manage future climate change by enabling policy-relevant quantification of the carbon cycle. Sources and sinks of atmospheric carbon dioxide (CO2) and methane (CH4) are poorly known at regional to continental scales. ACT-America will enable and demonstrate a new generation of atmospheric inversion systems for quantifying CO2 and CH4 sources and sinks.
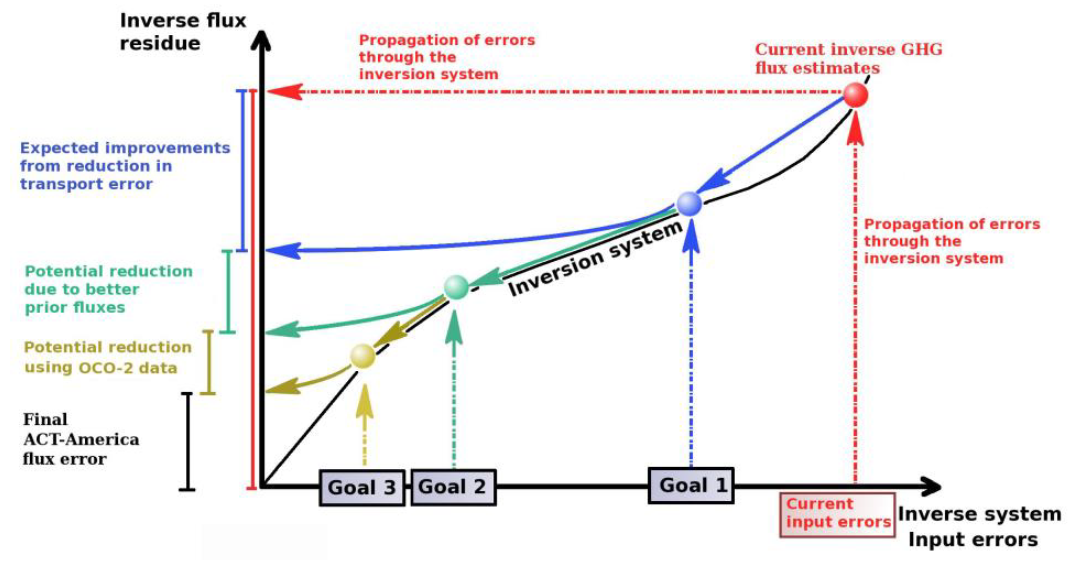
Figure 2. A schematic showing ACT-America project goals.
ACT-America Goals:
- To quantify and reduce atmospheric transport uncertainties.
- To improve regional-scale, seasonal prior estimate of CO2 and CH4 fluxes.
- To evaluate the sensitivity of Orbiting Carbon Observatory (OCO-2) column measurements to regional variability in tropospheric CO2.
ACT-America will achieve these goals by deploying airborne and ground-based platforms to obtain data that will be combined with data from existing measurement networks and integrated with an ensemble of atmospheric inversion systems. Aircraft instrumented with remote and in situ sensors will observe how mid-latitude weather systems interact with CO2 and CH4 sources and sinks to create atmospheric CO2/CH4 distributions. A model ensemble consisting of a mesoscale atmospheric transport model with multiple physics and resolutions options nested within global inversion models and surface CO2/CH4 flux ensembles will be used to predict atmospheric CO2 and CH4 distributions.
Beyond the conclusion of the mission, application of the knowledge gained from this mission will improve diagnoses of the carbon cycle across the globe for decades.
Quality Assessment
Calibration: Prior to deployment, the instruments were calibrated in the laboratory using 4 NOAA-calibrated tanks. A field calibration tank was sampled daily and used to apply a zero-offset correction. Round robin tests using 3-4 NOAA-calibrated tanks were conducted every 1-2 years. NOAA flask measurements were used for comparison at the Mildred, Greenfield, and Mooresville sites.
Uncertainty: The averaging interval standard deviation and uncertainty derived from periodic flask sample to in-situ measurement comparisons are provided in the data files. Based on flask to in-situ comparisons and round robin testing presented in Richardson et al. (2017), the estimated compatibility of these measurements is approximately 0.18 ppm CO2 and 0.6 ppb CH4.
Within the data, nodata and out-of-range values are provided in the dataset as described. Instrument precision specifications are available in the ACT-America proposal and replicated below (Fig 3.)
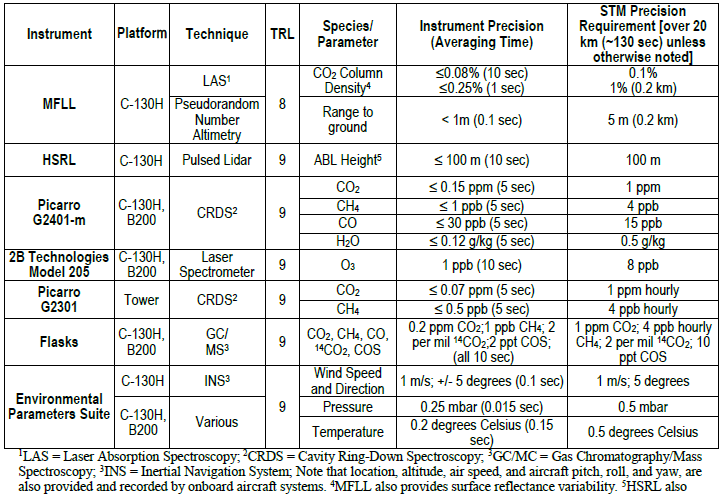
Figure 3. Instrument precision table as provided in the ACT-America proposal.
See additional instrument quality control discussion here: https://www.esrl.noaa.gov/gmd/ccgg/aircraft/qc.html
Data Acquisition, Materials, and Methods
Tower Sites
ACT-America will utilize existing communications towers, filling gaps that exist in or near our three study regions in existing tower networks. Specific sites have been selected in science-critical locations based on tall tower and local Ethernet or cell phone data connection availability. Daily, automated data transfer to the Langley Atmospheric Science Data Center allows for remote monitoring of instrument status and investigation planning.
Please note, data from 11 towers are provided, but not all towers have data from all years.
Tower platforms utilize the Picarro G2301 CRDS for CO2, CO, CH4, and H2O measurements. Instruments report raw data every 2 - 3 seconds, but these data points are not independent because of the mixing volume. Excluding data from the calibration tanks and other measurement heights (if applicable), the mean within each hour was computed. The minimum and maximum times of the data included in each average is indicated in the file.
Tower Data Synthesis
Additional measurements that will be used in this study include NOAA moorings along the East and Gulf coasts, the Total Carbon Column Observing Network (TCCON) sites at Park Falls, Wisconsin (WLEF) and the Department of Energy-Atmospheric Radiation Measurement (DOE-ARM) Central Facility, OK sites, and the NOAA Aircraft (biweekly vertical profiles) and Tall Tower networks. These data are all accessible to the public.
ACT-America Overview
The eastern half of the United States, a region that includes a highly productive biosphere, vigorous agricultural activity, extensive gas and oil extraction, dynamic, seasonally varying weather patterns and the most extensive carbon cycle and meteorological observing networks on Earth, serves as an ideal setting for the mission. Flights will concentrate observations on three study domains: Northeast, South-central, and Midwest.
ACT-America will deploy the NASA C-130 and B-200 aircraft to measure atmospheric CO2 and CH4 in the atmospheric boundary layer (ABL) and free troposphere (FT). The mission proposes a total of 70 science flights, 528 hours for the C-130 and 396 hours for the B-200, dedicated in a roughly 3:3:1 ratio among fair weather, stormy weather, and OCO-2 underpass flight patterns.
For fair and stormy weather flights, the C-130 will fly at 3-8 km above ground, collecting in situ measurements in the lower FT, remotely sensed, column-averaged CO2 measurements focused on the ABL, and occasional in situ vertical profiles. The B-200 will primarily sample the ABL. For OCO-2 underflights, the C-130 will fly at 8 km above ground with the B-200 flying in the ABL, both along the OCO-2 flight track. The existing in situ tower CO2/CH4 observing network will be enhanced with five additional tower sites.
The mission will deliver 2-3 times more high-quality lower tropospheric CO2 and CH4 observations than any previous airborne campaign.
Data Access
These data are available through the Oak Ridge National Laboratory (ORNL) Distributed Active Archive Center (DAAC).
ACT-America: L2 In Situ CO2, CO, and CH4 Concentrations from Towers, Eastern USA
Contact for Data Center Access Information:
- E-mail: uso@daac.ornl.gov
- Telephone: +1 (865) 241-3952
References
ICARTT File Format Standards V1.1. Available from https://www-air.larc.nasa.gov/missions/etc/IcarttDataFormat.htm
Miles, N.L., D.K. Martins, S.J. Richardson, C. Rella, T. Lauvaux, K.J. Davis, Z.R. Barkley, K. McKain, and C. Sweeney. 2017. Calibration and field testing of cavity ring-down laser spectrometers measuring CH4, CO2, and δ13CH4 deployed on towers in the Marcellus Shale region. Atmos. Meas. Tech. Disc., in review, https://doi.org/10.5194/amt-2017-364
Miles, N.L., S.J. Richardson, T. Lauvaux, K.J. Davis, J. Turnbull, A. Karion, C. Sweeney, K.R. Gurney, R. Patarasuk, I. Razlivanov, M.O. Cambaliza, and P. Shepson. 2017. Quantification of urban atmospheric boundary layer greenhouse gas dry mole fraction enhancements: Results from the Indianapolis Flux Experiment (INFLUX). Elem. Sci. Anth., 5:27, http://doi.org/10.1525/elementa.127
Richardson SJ, Miles NL, Davis KJ, Lauvaux T, Martins DK, Turnbull JC, et al.. 2017. Tower measurement network of in-situ CO2, CH4, and CO in support of the Indianapolis FLUX (INFLUX) Experiment. Elem Sci Anth. 5:59. DOI: http://doi.org/10.1525/elementa.140
Data Set Revisions
The ORNL DAAC will continue to update the tower-based data as it becomes available.
| Data Version | ORNL DAAC Release Date | Description |
|---|---|---|
| Version 1.1 | 2018-06-11 | Addition of 2015 and 2017 Hourly Picarro Tower Data |
| Version 1 | 2018-02-06 | 2016 Hourly Picarro Tower data |