Documentation Revision Date: 2021-04-03
Dataset Version: 1
Summary
The data refer to wolf "packs," although this was often synonymous with individuals as it was relatively uncommon to have data from more than one individual. When data were used for an individual, it was assumed that the individuals were not independent owing to their association within a pack with a defined reproductive history and space use. Provided data were assessed for insights regarding the relationship between climate and carnivore demography and should improve predictions of climate warming effects on the highest trophic levels.
There are two data files in comma-separated format (*.csv) included in this dataset.
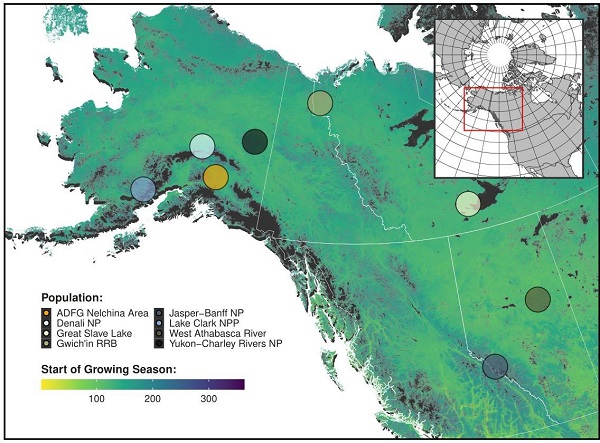
Figure 1. Spatial distribution of eight wolf study populations used in an assessment of denning phenology in response to climate signals from 2000-2017. The base map shows the day of the year representing the NDVI-derived start of the growing season in 2010. Source: Mahoney et al., 2020
Citation
Mahoney, P., K. Joly, B. Borg, M. Sorum, T. Rinaldi, D. Saalfeld, H. Golden, D. Latham, A. Kelly, B. Mangipane, C. Lambert, L. Neufeld, M. Hebblewhite, N. Boleman, and L.R. Prugh. 2021. ABoVE: Wolf Denning Phenology and Reproductive Success, Alaska and Canada, 2000-2017. ORNL DAAC, Oak Ridge, Tennessee, USA. https://doi.org/10.3334/ORNLDAAC/1846
Table of Contents
- Dataset Overview
- Data Characteristics
- Application and Derivation
- Quality Assessment
- Data Acquisition, Materials, and Methods
- Data Access
- References
Dataset Overview
This dataset provides annual gray wolf (Canis lupus) denning spatial information and timing, associated climatic and phenologic metrics, and reproductive success (i.e., pup survival) in wolf populations across areas of western Canada and Alaska within the NASA ABoVE Core Domain. The study encompasses 18 years between the period 2000–2017. Wolves were captured from eight populations following standard animal care protocols and released with Global Positioning System (GPS) collars. Data from 388 wolves were used to estimate den initiation dates (n=227 dens of 106 packs) and reproductive success in the eight populations. Each population was monitored from 1 to 12 years between 2000 and 2017. Denning parturition phenology was measured each year as the number of calendar days from January 1st to the initiation date of each documented denning event. Reproductive success was determined as to whether pups survived through the end of August following a reproductive event. To evaluate the effect of climate factors on reproductive phenology, aggregated seasonal climate metrics for temperature, precipitation, and snow water equivalent based on three biological seasons for seasonal wolf home ranges were produced. Normalized Difference Vegetation Index (NDVI) time-series data were used to estimate phenological metrics such as the start of the growing season (SOS), length of the growing season (LOS), and time-integrated NDVI (tiNDVI), and were summarized for the populations' home range.
The data refer to wolf "packs," although this was often synonymous with individuals as it was relatively uncommon to have data from more than one individual. When data were used for an individual, it was assumed that the individuals were not independent owing to their association within a pack with a defined reproductive history and space use. Provided data were assessed for insights regarding the relationship between climate and carnivore demography and should improve predictions of climate warming effects on the highest trophic levels.
Project: Arctic-Boreal Vulnerability Experiment
The Arctic-Boreal Vulnerability Experiment (ABoVE) is a NASA Terrestrial Ecology Program field campaign based in Alaska and western Canada between 2016 and 2021. Research for ABoVE links field-based, process-level studies with geospatial data products derived from airborne and satellite sensors, providing a foundation for improving the analysis and modeling capabilities needed to understand and predict ecosystem responses and societal implications.
Related Publication
Mahoney, P. J., K. Joly, B. L. Borg, M. S. Sorum, T. A. Rinaldi, D. Saalfeld, H. Golden, A. D. M. Latham, A. P. Kelly, B. Mangipane, C. L. Koizumi, L. Neufeld, M. Hebblewhite, N. T. Boelman, and L. R. Prugh. 2020. Denning phenology and reproductive success of wolves in response to climate signals. Environmental Research Letters 15:125001. https://doi.org/10.1088/1748-9326/abc0ba
Acknowledgments
This research was funded with the NASA ABoVE project (grant numbers NNX15AV92A, NNX15AU20A, and NNX15AW71A).
Data Characteristics
Spatial Coverage: Eight sites in Alaska, USA, and Canada
Alaska: ADFG Nelchina Public Use Area, Lake Clark National Park and Preserve, Denali National Park, and Yukon-Charley Rivers National Preserve
Canada: Great Slave Lake, Northwest Territories, Gwich'in Natural Resources Board, Northwest Territories, Jasper-Banff National Park, Alberta-BC, and West Athabasca River, Alberta
ABoVE Reference Locations
Domain: Core ABoVE
State/territory: Alaska and Canada
ABoVE Grid Cells: Ah0Av0,Bh5Bv5,Ch34Cv32
Ah0Av0,Bh3Bv5,Ch20Cv35
Ah0Av1,Bh5Bv6,Ch35Cv40
Ah1Av0,Bh10Bv5,Ch61Cv35
Ah1Av2,Bh10Bv16,Ch65Cv99
Ah1Av1,Bh7Bv6,Ch46Cv36
Ah2Av2,Bh13Bv15,Ch78Cv91
Ah2Av2,Bh13Bv12,Ch78Cv72
Spatial resolution: Summarized to centroids of wolf movements and aggregated over study areas
Temporal coverage: 2000-03-29 to 2017-08-31
Temporal resolution: Annual
Study Areas: Latitude and longitude are given in decimal degrees.
| Site | Westernmost Longitude | Easternmost Longitude | Northernmost Latitude | Southernmost Latitude |
|---|---|---|---|---|
| Alaska and Canada | -154.581205 | -112.966788 | 67.836197 | 52.970548 |
Data File Information
There are two data files in comma-separated format (*.csv) provided with this dataset.
Table 1. File names and descriptions
| File Name | Description |
|---|---|
| Wolf_ReproductiveSuccess_AK_CA.csv | Reproductive success metric and climate data. The success metric indicates whether pups survived through the end of August following a reproductive event. |
| Wolf_DenningPhenology_AK_CA.csv | Climatic and phenological metrics affecting denning and denning success. Denning phenology was measured as the number of calendar days since January 1st and the initiation date of each documented denning event.. |
Data File Details
For all files, missing numeric values are represented as -9999 and missing character values are represented as NA.
Table 2. Variables in the file Wolf_ReproductiveSuccess_AK_CA.csv. Any covariate ending in "_prev1" indicates metrics that were derived during the same season but in the previous year.
| Variable | Units | Description |
|---|---|---|
| uid | Unique identifier | |
| study | Gray wolf study/population name | |
| longitude_study | Decimal degrees | Longitude (centroid) of the study area |
| latitude_study | Decimal degrees | Latitude (centroid) of the study area |
| pack_id | Arbitrary pack identifier | |
| start_date | YYYY-MM-DD | Study start date |
| end_date | YYYY-MM-DD | Study end date |
| success | Pack success (1) or failure (0) in raising pups through the end of August | |
| summer_prcp | mm | Median summer cumulative precipitation within pack seasonal home range |
| fall_prcp | mm | Median fall cumulative precipitation within pack seasonal home range |
| winter_swe | kg/m2 | Median winter snow water equivalent within pack seasonal home range |
| fall_tmax | degrees C | Median fall maximum temperature within pack seasonal home range |
| summer_tmax | degrees C | Median summer maximum temperature within pack seasonal home range |
| winter_tmax | degrees C | Median winter maximum temperature within pack seasonal home range |
| tiNDVI_prev1 | Median time-integrated Normalized Difference Vegetation Index within seasonal home range for the previous year | |
| tiNDVI | Median time-integrated Normalized Difference Vegetation Index within pack seasonal home range | |
| annual_pdo | Mean annual Pacific decadal oscillation in the year leading up to denning | |
| annual_ao | Mean annual Arctic oscillation in the year leading up to denning | |
| home_range_area | km2 | Wolf home range size |
| denning_match_growing_season | Days | Match between wolf denning and start of the growing season |
Table 3. Variables in the file Wolf_DenningPhenology_AK_CA.csv. Any covariate ending in "_prev1" indicates metrics that were derived during the same season but in the previous year.
| Variable | Units | Description |
|---|---|---|
| uid | Unique identifier | |
| study | Gray wolf study/population name | |
| longitude_study | Decimal degrees | Longitude (centroid) of the study area |
| latitude_study | Decimal degrees | Latitude (Centroid) of the study area |
| pack_id | Arbitrary pack identifier | |
| denning_date | YYYY-MM-DD | Date associated with denning initiation |
| denning_doy | ddd | Julian day of the year associated with denning initiation |
| denned | Denning occurred. All values equal to 1. Required for analysis. | |
| fall_tmax | degrees C | Median fall maximum temperature within pack seasonal home range |
| summer_tmax_prev1 | degrees C | Median summer maximum temperature for the previous year within pack seasonal home range |
| winter_tmax | degrees C | Median winter maximum temperature within pack seasonal home range |
| fall_prcp | mm | Median fall cumulative precipitation within pack seasonal home range |
| summer_prcp_prev1 | mm | Median summer cumulative precipitation for the previous year within pack seasonal home range |
| winter_swe | kg/m2 | Median winter snow water equivalent within pack seasonal home range |
| tiNDVI_prev1 | Median time-integrated Normalized Difference Vegetation Index for the previous year within the seasonal home range | |
| annual_pdo | Mean annual Pacific decadal oscillation in the year leading up to denning | |
| annual_ao | Mean annual Arctic oscillation in the year leading up to denning | |
| sos_prev1 | ddd | Start (day of the year) of the growing season for the previous year |
| los_prev1 | days | Length of the growing season for the previous year |
| latitude_individual | Decimal degrees | Estimated latitude of individual wolves based on home range centroids |
Application and Derivation
Arctic and boreal ecosystems are experiencing rapid changes in temperature and precipitation regimes. Subsequent shifts in seasonality can lead to a mismatch between the timing of resource availability and species’ life-history events, known as a phenological or trophic mismatch. Although mismatch has been shown to negatively affect some northern animal populations, longer-term impacts across large regions remain unknown. The study that produced these data (Mahoney et al., 2020) investigated the direct impact of climate on large carnivore demography across a large geographic domain. Results indicated that climate can interact with carnivore reproduction in complex and nuanced ways. The findings highlighted a disconnect between climate factors that affect phenology and those that affect demography, suggesting that carnivores may be resilient to shifts in seasonality and yet sensitive to weather conditions affecting their prey at both local and regional scales. The data provide insights into the relationship between climate and carnivore demography and should improve predictions of climate warming effects on the highest trophic levels.
Quality Assessment
Details of quality assessment are found in Mahoney et al., 2020. Prior to the analyses, collinearity was assessed across all covariates and one or more covariates that contributed to correlation coefficients greater than 0.7 were removed. In cases where correlation occurred, the metric that best represented the underlying hypothesized biological mechanisms was retained. In addition, model goodness-of-fit was assessed by the Cox proportional hazard concordance statistic for the denning phenology model set (Therneau, 2015) and conditional pseudo-R2 for the reproductive success model set (Nakagawa et al., 2017).
Validations comparing the movement-based predictions to aerial and ground observations of denning indicated that 100% of the known denning events (n=146) were successfully identified.
Of 153 confirmed aerial or ground observations of recruitment (i.e., packs with or without pups after August 31st of each year), 143 cases matched predictions of success (93.5%). Of the 10 that were misidentified, six were estimated as failures but observed to be successful, and three were estimated as successful but observed to be failures. Thus, error in recruitment classification was relatively minor without inducing any systematic bias associated with the "type" of error due to near equal representation. The ten misidentified reproductive success estimates were corrected to reduce the overall classification error rate.
Data Acquisition, Materials, and Methods
Gray Wolf Packs
GPS location data were compiled from 388 individuals in eight wolf populations across western Canada and Alaska (Fig. 1). Wolves were captured following standard animal care protocols defined by affiliate university or government agencies and released with Global Positioning System (GPS) collars programmed to acquire fixes over a range of intervals from 15 minutes to 24 hours. The movements and site-fidelity patterns of resident pack members from food provisioning and other social interactions can signal pup-rearing activities from March through August (Alfredéen, 2006; Tsunoda et al., 2009). Each population was monitored from one to 12 years between 2000–2017.
Movements indicative of pup rearing were classified using a three-step process. For the first step, sites were identified with a high intensity of use by clustering collared animal locations in space (≤100 m) and time (≤7 days). For the second step, the same movement time series were smoothed using a median filter and an overlapping, 4-day moving window to dampen the effect of large movements. For the final step, movement time series were visually inspected to evaluate whether cluster fidelity persisted after frequent offsite forays (i.e., provisioning of offspring) and to identify any influential gaps in location data that could affect estimates for den initiation dates. Parturition was estimated as the initial date from the earliest denning cluster observed during the reported period for wolf parturition (March–June) (Mech and Boitani, 2010).
Climate Metrics
The influence of seasonal (e.g., previous summer, autumn, and winter) minimum and maximum temperatures, previous summer and autumn cumulative precipitation, mean daily snow water equivalent (SWE), the start of season (SOS), length of season (LOS), tiNDVI, latitude, annual Pacific and Atlantic oscillations were evaluated on the timing of wolf den initiation. A time-to-event model, the Cox proportional hazard regression, was used to examine the effects of climate factors on denning phenology and were measured as the number of calendar days since January 1st and the initiation date of each documented denning event. Climatic factors affecting reproductive success were assessed using mixed logistic regression.
Seasonal weather metrics were aggregated using Daymet version 3 (Thornton et al., 2018). To characterize vegetation dynamics during the most photosynthetically active periods (i.e., growing season), Normalized Difference Vegetation Index (NDVI) was estimated using 8-day surface reflectance derived from NASA’s Moderate Resolution Imaging Spectroradiometer (MODIS) MOD09Q1 data product (Vermote, 2015). NDVI data were post-processed using the program TIMESAT (Jönsson and Eklundh, 2004), which masked cloud-covered pixels, smoothed NDVI time series, and estimated phenological metrics such as the start of the growing season (SOS), length of the growing season (LOS), and time-integrated NDVI (tiNDVI). The Pacific Decadal Oscillation (POC; Mantua and Hare, 2002) and Arctic Oscillation (AO) indices (NOAA National Weather Service Climate Prediction Center) during January of the reproductive year and annual means from the previous year (i.e., effectively, a lag of one year) are also included.
Biological seasons (summer pup-rearing: April–August, autumn ungulate rut: September–November, and winter wolf pair formation and breeding: January–March) home ranges were used to extract median climate statistics, and home range centroids to estimate latitude for each individual.
Denning
Movement data from 388 wolves were evaluated and 227 possible dens were identified associated with 106 packs across western Canada and Alaska between 2000 and 2017. Of these, reproductive success was classified for 186 reproductive events in those packs with sufficient movement data (i.e., data from denning through the end of August and ≥1 fix per day). Although rare, multiple litters were treated as a single event based on the timing of the first den and any pup-rearing movements through August as a single measure of success. Validations comparing the movement-based predictions to aerial and ground observations of denning indicated that 100% of the known denning events (n=146) were successfully identified.
Reproductive success
Reproductive success was defined as packs with one or more pups at the end of August. To estimate success, the movement time series was evaluated for each individual after a denning event had been identified. If pup-rearing movements were evident through the end of August using the same methods above (e.g., high-fidelity clusters and low daily median displacement through August), packs were flagged as reproductively successful. Although these activities often extended well into September or October, August was chosen as a more conservative date given the variability in when pups begin to consistently travel with natal packs. Success was validated by comparing estimates to visual observations of pups with packs during the autumn or winter for a portion of the dataset for which these observations were made (e.g., Denali National Park and Preserve, Banff National Park, Jasper National Park, and West Athabasca River study areas). In addition, pack members were used as a form of validation in the estimates for both den initiation and reproductive success. However, for analyses, only one estimate of reproductive timing and success per pack per year was used, prioritizing dates derived from reproductive females followed by individuals with the highest quality data (i.e., highest fix retention or sampling rate).
Data Access
These data are available through the Oak Ridge National Laboratory (ORNL) Distributed Active Archive Center (DAAC).
ABoVE: Wolf Denning Phenology and Reproductive Success, Alaska and Canada, 2000-2017
Contact for Data Center Access Information:
- E-mail: uso@daac.ornl.gov
- Telephone: +1 (865) 241-3952
References
Alfredéen, A.C. 2006. Denning behaviour and movement pattern during summer of wolves Canis lupus on the Scandinavian Peninsula. Doctoral dissertation, Sveriges lantbruksuniversitet. Institutionen för naturvårdsbiologi.
Jönsson, P., and L. Eklundh. 2004. TIMESAT—a program for analyzing time-series of satellite sensor data. Computers & Geosciences 30:833–845. https://doi.org/10.1016/j.cageo.2004.05.006
Mahoney, P.J., K. Joly, B.L. Borg, M.S. Sorum, T.A. Rinaldi, D. Saalfeld, H. Golden, A.D.M. Latham, A.P. Kelly, B. Mangipane, C.L. Koizumi, L. Neufeld, M. Hebblewhite, N.T. Boelman, and L.R. Prugh. 2020. Denning phenology and reproductive success of wolves in response to climate signals. Environmental Research Letters 15:125001. https://doi.org/10.1088/1748-9326/abc0ba
Mantua, N.J., and S. R. Hare. 2002. The Pacific Decadal Oscillation. Journal of Oceanography 58:35–44. https://doi.org/10.1023/A:1015820616384
Mech, L.D., and L. Boitani. 2010. Wolves: behavior, ecology, and conservation. The University of Chicago Press.
Vermote, E. 2015. MOD09Q1 MODIS/Terra Surface Reflectance 8-Day L3 Global 250m SIN Grid V006. NASA EOSDIS Land Processes DAAC. https://doi.org/10.5067/MODIS/MOD09Q1.006
Nakagawa, S., P. C. D. Johnson, and H. Schielzeth. 2017. The coefficient of determination R 2 and intra-class correlation coefficient from generalized linear mixed-effects models revisited and expanded. Journal of The Royal Society Interface 14:20170213. https://doi.org/10.1098/rsif.2017.0213
Thornton, P.E., M.M. Thornton, B.W. Mayer, Y. Wei, R. Devarakonda, R.S. Vose, and R.B. Cook. 2018. Daymet: Daily Surface Weather Data on a 1-km Grid for North America, Version 3 ORNL DAAC, Oak Ridge, Tennessee, USA. https://doi.org/10.3334/ORNLDAAC/1328
Therneau, T. 2015. A package for survival analysis in S. version 2.38
Tsunoda, H., R. Gula, J. Theuerkauf, S. Rouys, S. Radler, B. Pirga, J. Eggermann, and B. Brzezowska. 2008. How does parental role influence the activity and movements of breeding wolves? Journal of Ethology 27:185–189. https://doi.org/10.1007/s10164-008-0106-z