Documentation Revision Date: 2019-08-30
Dataset Version: 1
Summary
Field data collection was focused on vegetation regrowth three to four years post fire (2014-15 wildfires), including re-sampling of selected sites, collecting soil moisture coincident with Radarsat-2 and UAVSAR overpasses, and collection of pre-burn biomass (biophysical sampling of tree and shrub inventory) and soil conditions at validation sites that was not completed in previous years.
There are six data files in comma-separated format (.csv) in this dataset.
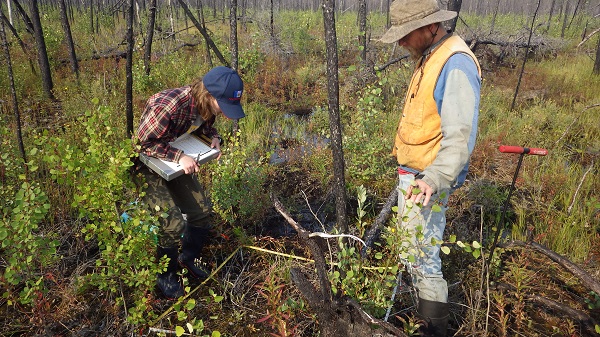
Figure 1. Investigators collected field data and inventoried plots for vegetation species and growth in 2018 at a post-burn site (image provided by Laura Bourgeau-Chavez).
Citation
Bourgeau-Chavez, L.L., M. Battaglia, E.S. Kane, L.M. Cohen, and D. Tanzer. 2019. ABoVE: Post-Fire and Unburned Vegetation Community and Field Data, NWT, Canada, 2018. ORNL DAAC, Oak Ridge, Tennessee, USA. https://doi.org/10.3334/ORNLDAAC/1703
Table of Contents
- Dataset Overview
- Data Characteristics
- Application and Derivation
- Quality Assessment
- Data Acquisition, Materials, and Methods
- Data Access
- References
Dataset Overview
This dataset provides vegetation community characteristics and biophysical data collected in 2018 from areas that were burned by wildfire in 2014 and 2015, and from nine unburned validation sites in the Northwest Territories, Canada. The data include vegetation inventories, ground cover, regrowth, tree diameter and height, and woody seedling/sprouting data at burned sites, and similar vegetation community characterization at unburned validation sites. Additional measurements included soil moisture, collected for validation of the UAVSAR airborne collection, and depth to frozen ground at the nine unburned sites. This 2018 fieldwork completes four years of field sampling at the wildfire areas.
Field data collection was focused on vegetation regrowth three to four years post fire (2014-15 wildfires), including re-sampling of selected sites, collecting soil moisture coincident with Radarsat-2 and UAVSAR overpasses, and collection of pre-burn biomass (biophysical sampling of tree and shrub inventory) and soil conditions at validation sites that was not completed in previous years.
Project: ABoVE
The Arctic-Boreal Vulnerability Experiment (ABoVE) is a NASA Terrestrial Ecology Program field campaign taking place in Alaska and western Canada between 2016 and 2021. Climate change in the Arctic and Boreal region is unfolding faster than anywhere else on Earth, resulting in reduced Arctic sea ice, thawing of permafrost soils, decomposition of long-frozen organic matter, widespread changes to lakes, rivers, coastlines, and alterations of ecosystem structure and function. ABoVE seeks a better understanding of the vulnerability and resilience of ecosystems and society to this changing environment.
Related Datasets:
Bourgeau-Chavez, L.L., S. Endres, L. Jenkins, M. Battaglia, E. Serocki, and M. Billmire. 2017. ABoVE: Burn Severity, Fire Progression, and Field Data, NWT, Canada, 2015-2016. ORNL DAAC, Oak Ridge, Tennessee, USA. https://doi.org/10.3334/ORNLDAAC/1548
Bourgeau-Chavez, L.L., N.H.F. French, S. Endres, L. Jenkins, M. Battaglia, E. Serocki, and M. Billmire. 2016. ABoVE: Burn Severity, Fire Progression, Landcover and Field Data, NWT, Canada, 2014. ORNL DAAC, Oak Ridge, Tennessee, USA. http://dx.doi.org/10.3334/ORNLDAAC/1307
Acknowledgements:
This research was funded with by the NASA Terrestrial Ecology- Arctic and Boreal Vulnerability Experiment, grant number NNX15AT83A.
Data Characteristics
Data Characteristics
Spatial Coverage: Northwest Territories, Canada.
ABoVE reference locations:
Domain: Core ABoVE
State/territory: NWT
Region: Great Slave Lake
Locale: Yellowknife
Grid cells: Ah2Av1.Bh12Bv11.Ch75Cv71, Ah2Av1.Bh12Bv11.Ch76Cv71, Ah2Av1.Bh13Bv10.Ch79Cv65, Ah2Av1.Bh13Bv11.Ch79Cv66, Ah2Av1.Bh13Bv11.Ch78Cv67, Ah2Av1.Bh13Bv11.Ch79Cv67, Ah2Av1.Bh13Bv11.Ch83Cv67, Ah2Av1.Bh14Bv11.Ch84Cv67, Ah2Av1.Bh12Bv11.Ch77Cv68, Ah2Av1.Bh12Bv11.Ch76Cv70, Ah2Av1.Bh12Bv11.Ch76Cv69, Ah2Av2.Bh12Bv12.Ch75Cv72, Ah2Av1.Bh14Bv11.Ch84Cv67
Spatial Resolution: Field data were collected at multiple points from plots varying in size from 1-m x 1-m to 10-m x 10-m to 100-m x 100-m.
Temporal Coverage: 2018-08-12 to 2018-08-22.
Study Area: (all latitudes and longitudes given in decimal degrees)
| Site (Region) | Westernmost Longitude | Easternmost Longitude | Northernmost Latitude | Southernmost Latitude |
|---|---|---|---|---|
| Northwest Territories, Canada | -117.42529 | -113.41964 | 62.56579 | 60.45244 |
Data File Information
There are six comma-separated files (.csv) of inventory, seedling/sapling growth, soil moisture, and biophysical data collected in 2018 from seven wildfire areas burned in 2014/15, and four unburned validation areas. Not all measurements were made in all areas. Most areas were divided into multiple sites with several plots per area (for example, SS3-29, SS3-40, SS3-42-1). Table 2 provides a summary of data collected in this dataset at each site.
Data not provided are reported as NA if the column is text format; numeric data not provided are reported as -9999.
Table 1. Data file names and descriptions
| File name | Description |
|---|---|
| NWT2018_ Biophysical.csv | This file provides vegetation community biophysical data collected from three wildfire areas (10 sites within the areas) |
| NWT2018_Biophysical_Inventory.csv | This file provides site/plot observations, species inventory, diameter, and height data collected from three wildfire areas (10 sites within the areas) |
| NWT2018_SeedlingSprouting.csv | This file provides observations of woody vegetation seedling/saplings and sprouting of mosses and lichen from seven areas (24 sites within the areas) |
| NWT2018_SoilMoisture_Hydrosense1.csv | This file provides soil moisture and temperature data using a Hydrosense 1 instrument at depths of 6, 12, and 20 cm collected from eleven areas (33 sites within the 11 areas) |
| NWT2018_UnburnedSites_validation.csv | This file provides vegetation community characterization data and thaw depth measurements collected from four field areas (nine sites within the four areas) |
| NWT2018_field_data_summary.csv | This file provides a summary of the field data collected per site, data collection year, and site coordinates |
Table 2. This table is intended as a quick reference and does not provide all of the sites within the areas. The file NWT2018_field_data_summary.csv provides additional information per site within the areas below.
| Area | Biophysical (10 sites at 3 areas) | Seedlings/Sprouting (24 sites at seven areas) | Inventory (diameter and height) (10 sites at 3 areas) | Soil Moisture (33 sites at 11 areas) |
|---|---|---|---|---|
| SS3 | x | x | x | x |
| SS50 | x | x | ||
| ZF14 | x | x | ||
| ZF20 | x | x | x | x |
| ZF2 | x | x | ||
| ZF28 | x | x | ||
| ZF46 | x | x | x | x |
| VALSS50 | x | |||
| VALZF14 | x | |||
| VALZF20 | x | |||
| VALZF46 | x |
Biophysical data: Biophysical data collected from 10 sites at three areas: SS3, ZF20, and SF46.
Table 3. Variables in the file NWT2018_ Biophysical.csv
| Variable | Units | Description |
|---|---|---|
| site | Unique name given to a field site. The initial alphanumeric code indicates site and fire number and the second part of the name is a site code designated by the research team | |
| plot | Plot number within site | |
| plot_size | Size of sampling plot reported in meters by meters | |
| date | YYYYMMDD | Date of data collection |
| observer | text | Initials of person(s) who collected the information |
| latitude | decimal degrees | Latitude of plot corner |
| longitude | decimal degrees | Longitude of plot corner |
| time | HH:MM | Time that data collection at that location began in local time MDT (UTC-6). |
| live_canopy_cover | percent | Percent of canopy (tree) cover classified as live |
| dominant_cover | Description of the dominant cover type. Choices included: forested; shrub; herbaceous or some combination of these cover types | |
| ecosystem | Ecosystem type(s) represented in the plot: bog, fen, lowland, upland | |
| ground_wetness | Description of the soil moisture status: dry, moist, soggy, standing water, or some combination of these conditions | |
| medium_shrub_cover | percent | Percent of cover composed of medium shrubs |
| soil_top_moss_condition | Notes on the condition of the top layer of organic soil (moss) with respect to burning: ash, burned, singed, charred, or unburned | |
| soil_live_moss | cm | Thickness of the live moss component of the organic soil layer reported in centimeters |
| soil_dead_moss | cm | Thickness of the dead moss component of the organic soil layer reported in centimeters |
| soil_upper_duff_layer_thickness | cm | Thickness of the upper duff component of the organic soil layer reported in centimeters |
| soil_lower_duff_layer_thickness | cm | Thickness of the lower duff component of the organic soil layer reported in centimeters |
| peat_depth | cm | Depth of organic soil layers calculated as the sum of the previous 4 columns reported in centimeters from the surface |
| sphag_coverage | percent | Percent of ground covered in Sphagnum moss reported as percent of total plot area |
| sphag_distribution | Pattern of distribution of Sphagnum moss: reported as Even | |
| low_shrubs_coverage | percent | Percent of ground covered in low shrubs reported as percent of total plot area |
| low_shrubs_distribution | Pattern of distribution of low shrubs: reported as Even, Peripheral, or Center | |
| woody_debris_coverage | percent | Percent of ground covered in woody debris reported as percent of total plot area |
| woody_debris_distribution | Pattern of distribution of low shrubs: reported as Even, Peripheral, or Center | |
| feather_moss_coverage | percent | Percent of ground covered in feather moss reported as percent of total plot area |
| feather_moss_distribution | Pattern of distribution of feather moss: reported as Peripheral | |
| reindeer_lichen_coverage | percent | Percent of ground covered in reindeer lichen reported as percent of total plot area- All observations are reported as 0 |
| reindeer_lichen_distribution | Pattern of distribution of reindeer lichen: all observations are NA (note the coverage is reported as 0) | |
| other_lichen_coverage | percent | Percent of ground cover, other lichen |
| other_lichen_distribution | Pattern of distribution of other lichen: reported as Even | |
| grasses_coverage | percent | Percent of ground covered in grasses reported as percent of total plot area |
| grasses_distribution | Pattern of distribution of grasses: reported as Even, Peripheral, or Center | |
| herbaceous_coverage | percent | Percent of ground covered in herbaceous plants reported as percent of total plot area |
| herbaceous_distribution | Pattern of distribution of herbaceous plants: reported as Even, Peripheral, or Center | |
| other_type_X | Description of other ground cover types. There are three additional “other” ground cover types. Each ground cover type is followed by the columns othertype_groundcover_coverage_X and othertype_groundcover_distribution_X, where X is 1, 2, or 3, See the descriptions below. Note that there are few observations, therefore, most values are -9999 or NA | |
| other_coverage_X | percent | Percent of ground covered in other ground cover reported as percent of total plot area. Note that there are few observations, therefore, most values are -9999 or NA |
| other_distribution_X | Pattern of distribution of other ground cover: reported as Even or Peripheral. Note that there are few observations, therefore, most values are -9999 or NA |
Plot Vegetation Inventory Data: Site/plot observations, species inventory, diameter, and height data collected from the same 10 sites and three areas as the biophysical data: SS3, ZF20, and SF46.
Table 4. Variables in the file NWT2018_ Biophysical_Inventory.csv
| Variable Name | Units | Description |
|---|---|---|
| site | Unique name given to a field site. The initial alphanumeric code indicates site and fire number and the second part of the name is a site code designated by the research team. Each site nominally represented a 100 x 100 m area | |
| plot | Plot number (1 through 6) representing a plot of 10 x 10 m area nominally for characterization | |
| plot_ size | Plot size, typically 10 m x 10 m, 5 m x 5 m | |
| date | YYYY-MM-DD | Date of data collection |
| latitude | Decimal degrees | Latitude of plot corner |
| longitude | Decimal degrees | Longitude of plot corner |
| observer | Person(s) who collected data | |
| life_form | Tree or shrub | |
| condition | Condition of tree or shrub: standing or fallen | |
| species | Scientific name of tree or shrub species measured | |
| diameter_type | basal or dbh | Whether the tree/shrub was measured at the base or dbh |
| diameter | cm | Diameter of the tree or shrub |
| height | m | Height of the tree or shrub in meters (typically only 5 representative trees were measured for height per plot). Unmeasured trees are left blank. |
| status | Status of tree or shrub- living or dead |
Seedling and Sprouting Data: Observations of woody vegetation seedling/saplings and sprouting of mosses and lichen collected from 24 sites at seven areas: SS3, SS50, ZF14, ZF20, ZF2, ZF28, and ZF46.
Table 5. Variables in the file NWT2018_SeedlingSprouting.csv
| Variable | Units | Description |
|---|---|---|
| site | Unique name given to a field site. The initial alphanumeric code indicates site and fire number and the second part of the name is a site code designated by the research team. The last number indicates the plot number | |
| latitude | Decimal degrees | Latitude of plot corner |
| longitude | Decimal degrees | Longitude of plot corner |
| date | YYYY-MM-DD | Date of data collection |
| observers | Person(s) who collected data | |
| plot_size | Plot size typically 1 x 1 m or 0.5 x 0.5 m | |
| species | Scientific name or taxa of vegetation species measured | |
| veg_state | Condition of vegetation: seedling or sprouting | |
| number | Number of seedlings or sprouts | |
| seedbed | Seedbed type: sphagnum, unburned organic material (duff and litter), thick burned organic material, thin burned organic material, or exposed mineral soil | |
| percent_cover | percent | Percent ground cover composed of species in plot. Percent cover used in cases where unable to count such as moss or lichens. |
Soil Moisture and Temperature Data: Soil moisture and temperature data were collected from 33 sites at 11 areas: SS3, SS50, VALSS50, VALZF14, VALZF20, VALZF46, ZF2, ZF14, ZF20, ZF28, and ZF46 at depths of 6, 12, and 20 cm.
Table 6. Variables in the file NWT2018_SoilMoisture_Hydrosense1.csv
| Variable | Units/format | Description |
|---|---|---|
| site | Unique name given to a field site. The initial alphanumeric code indicates site and fire number and the second part of the name is a site code designated by the research team | |
| observers | Initials of person(s) who collected data | |
| date | YYYY-MM-DD | Date of measurements |
| start_time | HH:MM | Time of measurements |
| weather | Weather conditions at time of measurement- important to note if raining or recently rained | |
| probe_depth | cm | Depth of probe tip insertion: 6, 12, or 20 cm |
| soil_temp_plot_X | degrees C | Soil temperature measured one time at each plot at 6, 12, and 20 cm depth, where plot_X represents a series of measurements for six plots, plot_1 to plot_6. The temperature measurements for each plot are followed by the VMC measurements and Hydrosense1 period data for each of the six plots. These measurements (for all six plots) are provided in columns 7-24 in the data file. See additional variable descriptions below |
| vmc_plot_X | cm3/cm3 | Volumetric Water Content of the soil at plots 1-6 (where plot_X represents plots 1-6) based on Hydrosense-1 default algorithm for loam soil |
| plot_X_period | milliSeconds | The Hydrosense-1 probe period at plots 1-6 (where plot_X represents plots 1-6) |
| comments | Comments or notes regarding data collection |
Validation Sites: Vegetation community characterization data collected from nine sites at four unburned areas: VAL-SS50, VAL-ZF14, VAL-ZF20, VALZF46. Soil pH is not included as the instrument was not working properly.
Table 7. Variables in the file NWT2018_UnburnedSites_validation.csv
| Variable Name | Units | Description |
|---|---|---|
| site | Unique name given to a field site. The initial alphanumeric code indicates site and fire number and the second part of the name is a site code designated by the research team. The last number indicates the plot | |
| date | YYYY-MM-DD | Date of data collection |
| time | HH:MM:SS | Time at which field work began in local time (MDT) |
| latitude | Decimal degrees | Latitude of plot corner |
| longitude | Decimal degrees | Longitude of plot corner |
| elevation | m | Elevation of site |
| aspect | Aspect | |
| slope | Slope of site | |
| observers | Person(s) who collected data | |
| depth_to_frozen_ground_sam1 to sam6 | cm | Depth of soil to frozen ground layer for samples 1 to 6 |
| ecosystem | Type of ecosystem, individually or in combination; Bog/Bog Like, Fen/Fen Like, Treed Bog, Shrub Fen, Treed Fen, Open Fen, Upland, Marsh, Shrubby, Sparse Trees, Lowland White Pine | |
| ground_wetness | Wetness of ground: Dry (no moisture present); Moist (moisture present but not saturated); Soggy (saturated with water but no areas of standing water); Standing Water (visible standing water present in plot) | |
| vegetation | List of vegetation species present | |
| dense_trees | percent | Percent of plot (1/2 acre area) covered in dense trees |
| dense_trees_dist | Description of dense tree distribution: reported as Even or Peripheral | |
| moderate_trees | percent | Percent of plot (1/2 acre area) covered in moderate trees |
| moderate_trees_dist | Description of dense tree distribution: reported as Even | |
| sparse_trees | percent | Percent of plot (1/2 acre area) covered in sparse trees |
| sparse_trees_dist | Description of sparse tree distribution: reported as Peripheral | |
| open_water | percent | Percent of plot (1/2 acre area) covered in open water |
| open_water_dist | Description of open water distribution: reported as Even | |
| shrubby | percent | Percent of plot (1/2 acre area) covered in shrubs |
| shrubby_dist | Description of shrub distribution: reported as Even | |
| moss | percent | Percent of plot (1/2 acre area) covered in moss |
| moss_dist | Description of moss distribution: reported as Even or Center | |
| grass_sedge | percent | Percent of plot (1/2 acre area) covered in grass/sedge |
| grass_sedge_dist | Description of grass/sedge distribution: reported as Even | |
| herbaceous_cover | percent | Percent of plot (1/2 acre area) that is herbaceous cover |
| herbaceous_dist | Description of herbaceous distribution: reported as Even | |
| other_description | Description of other vegetation cover-Note that all observations are NA | |
| other | percent | Percent of plot (1/2 acre area) covered in grass/sedge-Note that all observations are NA |
| other_dist | Description of grass/sedge distribution: Note that all observations are NA | |
| dom_spp1 | Scientific name of dominant species (grasses and sedges not identified to species) | |
| dom_live_ht_spp1 | m | Average height of live dominant species 1 |
| dom_dead_ht_spp1 | m | Average height of dead dominant species 1 |
| dom_density_spp1 | percent | Percent of area covered by dominant species 1 |
| dom_pct_live_spp1 | percent | Percent of dominant species 1 live (by area) |
| dom_pct_dead_spp1 | percent | Percent of dominant species 1 dead (by area) |
| dom_growth_stage_spp1 | Growth Stage for dominant species: immature or mature | |
| dom_spp2 | genus_species | Scientific name of dominant species (grasses and sedges not identified to species) |
| dom_live_ht_spp2 | m | Average height of live dominant species 2 |
| dom_dead_ht_spp2 | m | Average height of dead dominant species 2 |
| dom_density_spp2 | percent | Percent of area covered by dominant species 2 |
| dom_pct_live_spp2 | percent | Percent of dominant species 2 live (by area) |
| dom_pct_dead_spp2 | percent | Percent of dominant species 2 dead (by area) |
| dom_growth_stage_spp2 | Growth Stage for dominant species: mature | |
| ht_to_lowest_living_branch | m | Height of average lowest living branch |
| average_tree_ht | m | Average tree height in m |
| average_shrub_ht | m | Average shrub height in m |
| soil_live_moss | cm | Depth of live moss layer present in 40 cm soil profile |
| soil_dead_moss | cm | Depth of dead moss layer present in 40 cm soil profile |
| soil_upper_duff | cm | Depth of upper duff layer present in 40 cm soil profile |
| soil_ lower_duff | cm | Depth of lower duff layer present in 40 cm soil profile |
| peat_depth | cm | Total depth of peat (organic soil) |
| notes | Additional notes/comments |
Field data summary: This file is provided as a summary of site locations and data collected per site in each area during the 2018 field season. This file does not contain additional measurements.
Table 8. NWT_2018_field_data_summary.csv
| Column | Units | Description |
|---|---|---|
| site | Unique name given to a field site. The initial alphanumeric code indicates site and fire number and the second part of the name is a site code designated by the research team. In certain data files, a plot number is also included and is separated with a dash | |
| date | YYYY-MM-DD | Date of field visit |
| latitude | decimal degrees | Latitude of plot corner (10 x 10 m plot) |
| longitude | decimal degrees | Longitude of plot corner (10 x 10 m plot) |
| burn_severity | YYYY or unburned | Burn severity data collection year or unburned (validation sites) |
| seedling_sprouting | Yes/No | Presence/absence of seedling/sprouting data |
| biophysical | Yes, No, or YYYY | Presence/absence of biophysical data, year of collection provided if applicable, or validation |
| soil_moisture | Yes/No | Presence/absence of soil moisture data |
Application and Derivation
The goal was to identify and collect remote sensing and field data to support the science necessary to investigate the impacts and consequences of the 2014-2015 fires in Northwest Territories.
Quality Assessment
Quality control checks were performed on the field data. Data were recorded in the field on field sheets, then entered into excel in the lab. A second person checked the entered data against the original field sheets. A third person cross referenced field data and checked for any anomalies (out of range values) or missing values; if they were recorded on any of the field on sheets, notes, gps, or camera then the data were entered/corrected based on the cross reference. Soil moisture is sampled at each plot with five repeated samples within an arms length at each depth with the Hydrosense instrument. This allows for spatial averaging across the site (six plots; five samples per depth = 30 samples to average per site) for scaling up to remote sensing.
Data Acquisition, Materials, and Methods
Study areas
This project characterized the impacts of wildfires that occurred in 2014 and 2015 in the North Slave, South Slave, and Dehcho Regions of Northwest Territories, Canada. Data were collected from 11 areas: SS3, SS50, VALSS50, VALZF14, VALZF20, VALZF46, ZF2, ZF14, ZF20, ZF28, and ZF46.
This 2018 dataset completes four years of field sampling. Users should refer to the related datasets (Bourgeau-Chavez et al., 2017 and 2016) for additional data.
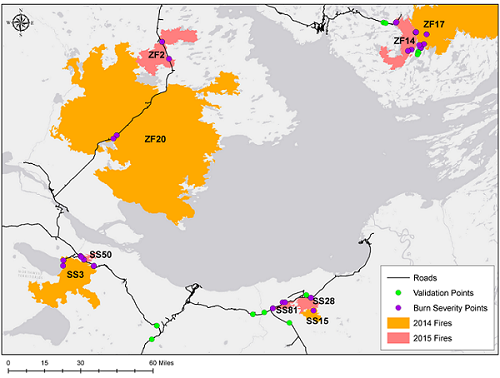
Figure 2. Location map showing some of the burned areas and validation field site locations in the Northwest Territories. Not all sites visited in 2018 are shown; sites SS81, ZF17, SS15, and SS28 were not visited for the 2018 data collections but were 2014 or 2015 NWT wildfires. Refer to the related datasets listed in the Overview Section of this document (map is from Bourgeau-Chavez et al., 2017).
Field Data
Aboveground biomass, biophysical site characteristics, burn severity, soil moisture, thaw depth, and woody seedling/sapling data were collected in plots along two transects.
Biophysical
Data were collected from sites ZF20-3, ZF20-12, ZF20-15, ZF20-26, ZF20-40, ZF20-41, ZF20-47, ZF46-15, SS3-29, and SS3-30. There were six plots per site, varying in size from 2.5-m x 2.5-m, 5-m x 5-m, and 10-m x 10-m. Field surveys noted peatland type, wetness, soil organic layer thicknesses and the type of ground cover present as well as area covered by each ground cover type.
Inventory-Aboveground Biomass
Data were collected from the same sites as the biophysical data. Each standing tree/shrub was measured. The tree/shrub species, DBH or basal diameter, height, and status (dead or live) was recorded.
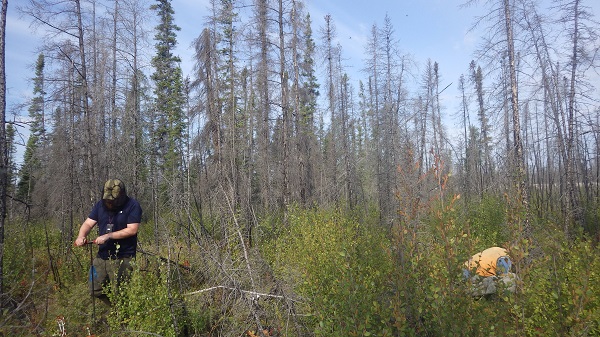
Figure 3. 2018 field data collections at a post-burned plot (image provided by Laura Bourgeau-Chavez).
Seedling/Sprouting data
A total of 24 sites were sampled. A 1-m x 1-m plot was set up in the corner of each site, where all woody seedling and sprouting vegetation was recorded along with the ground cover type.
Soil Moisture
A total of 33 sites were sampled. Each site had six plots. Soil moisture data were collected at each plot at 6 cm, 20 cm and 12 cm depths, at five different points in each plot, with a Campbell Scientific CS620 Hydrosense 1 handheld probe. Probes were placed straight down into the soil. At 6-cm depth, the 12-cm probe was placed at a 30- degree angle. The probe period for each measurement was recorded. For validation of remote sensing data, the moisture data were collected during Radarsat-2 overpasses. Soil temperature was measured one time at each plot using a Hannah Instruments HI 145 probe (Bourgeau-Chavez et al., 2017, 2016).
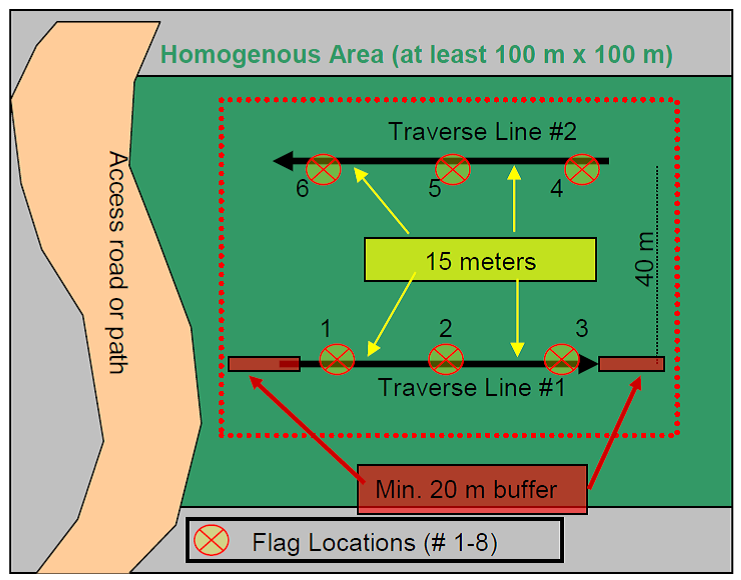
Figure 4. Plot set-up of homogeneous area of 100-m by 100-m with two transects of three plots for field sampling.
Validation
Nine field sites were sampled including VAL-SS50-4, VAL-ZF14-2, VAL-ZF14-200, VAL-ZF20-1, VAL-ZF20-26, VAL-ZF20-47, VAL-ZF20-201c, VAL-ZF20-202, and VAL-ZF46-6. Data collections followed a standardized protocol. Field crews used a hand-held GPS, and tape measures. At each location, a vegetative index was constructed, ecosystem type was assigned, species diversity noted, dominant species composition assigned, water level measured, vegetation life stage recorded, and height and density measured for the overstory. Thaw depth was measured with a peat rod from the top of the moss to the frozen layer (Bourgeau-Chavez et al., 2016).
Data Access
These data are available through the Oak Ridge National Laboratory (ORNL) Distributed Active Archive Center (DAAC).
ABoVE: Post-Fire and Unburned Vegetation Community and Field Data, NWT, Canada, 2018
Contact for Data Center Access Information:
- E-mail: uso@daac.ornl.gov
- Telephone: +1 (865) 241-3952
References
Bourgeau-Chavez, L.L., S. Endres, L. Jenkins, M. Battaglia, E. Serocki, and M. Billmire. 2017. ABoVE: Burn Severity, Fire Progression, and Field Data, NWT, Canada, 2015-2016. ORNL DAAC, Oak Ridge, Tennessee, USA. https://doi.org/10.3334/ORNLDAAC/1548
Bourgeau-Chavez, L.L., N.H.F. French, S. Endres, L. Jenkins, M. Battaglia, E. Serocki, and M. Billmire. 2016. ABoVE: Burn Severity, Fire Progression, Landcover and Field Data, NWT, Canada, 2014. ORNL DAAC, Oak Ridge, Tennessee, USA. http://dx.doi.org/10.3334/ORNLDAAC/1307