Documentation Revision Date: 2019-02-26
Dataset Version: 1
Summary
At each site, surface layer and soil measurements included temperature and volumetric water content, and soil carbon and nitrogen content. Repeated thaw depth measurements were made at each site. Observation were collected for evidence of moss layer and forest biomass burning. At each soil sampling site, visual estimates were made of the degree of change caused by the 2015 wildfires to generate CBI rankings of 0 to 3 burn severity level, with 3 indicating complete consumption of all pre-fire forest (strata) biomass during the fires.The field surveys carried out in July 2017 were also used to verify locations of different burn severity classes (low, moderate, or high), as estimated in 2016 from Landsat images collected before and after the 2015 Tanana area wildfires. The normalized burn ratio (NBR) index was calculated using approximately one year of pre-fire and post-fire images from the NIR and SWIR bands of the Landsat sensors. An RdNBR value of about 1000 corresponds to a CBI of 3 and the most extreme high burn severity post-fire conditions.
There is one data file in comma-separated format (.csv) provided with this dataset. A companion file of the same data is provided in shapefile (.shp) format.
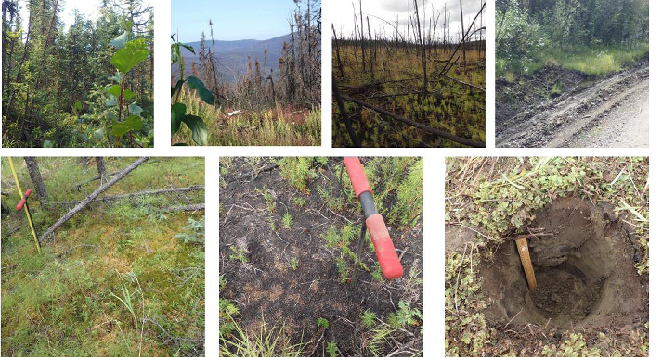
Figure 1. Photos from July 2017 field surveys. Clockwise from upper left photo: Unburned forest site; burned forest landscape of the Spicer Creek Fire; High Burn Severity (HBS) forest site; eroded roadside on the margin of the Spicer Creek Fire; soil pit to 30 cm depth; charred surface organic layer of HBS site with soil probe handle; surface organic layer of unburned forest site with 1-m long soil probe (Potter & Hugny, 2018).
Citation
Potter, C.S., and C. Hugny. 2019. ABoVE: Characterization of Burned and Unburned Spruce Forest Sites, Tanana, AK, 2017. ORNL DAAC, Oak Ridge, Tennessee, USA. https://doi.org/10.3334/ORNLDAAC/1595
Table of Contents
- Dataset Overview
- Data Characteristics
- Application and Derivation
- Quality Assessment
- Data Acquisition, Materials, and Methods
- Data Access
- References
Dataset Overview
This dataset provides the results of field observations of soil characteristics and depth to permafrost, survey results for Composite Burn Index (CBI) determination, and Landsat-derived estimates of Relative Difference Normalized Burn Ratio (RdNBR) for 38 burned and unburned forest sites near Tanana, Alaska, in 2017. Forests in the study area, at the confluence of the Yukon and Tanana Rivers about 200 km west of Fairbanks, are predominately black spruce on wetter soils and white spruce on drier soils. The burned areas were from wildfires that occurred in the summer of 2015.
At each site, surface layer and soil measurements included temperature and volumetric water content, and soil carbon and nitrogen content. Repeated thaw depth measurements were made at each site. Observation were collected for evidence of moss layer and forest biomass burning. At each soil sampling site, visual estimates were made of the degree of change caused by the 2015 wildfires to generate CBI rankings of 0 to 3 burn severity level, with 3 indicating complete consumption of all pre-fire forest (strata) biomass during the fires.The field surveys carried out in July 2017 were also used to verify locations of different burn severity classes (low, moderate, or high), as estimated in 2016 from Landsat images collected before and after the 2015 Tanana area wildfires. The normalized burn ratio (NBR) index was calculated using approximately one year of pre-fire and post-fire images from the NIR and SWIR bands of the Landsat sensors. An RdNBR value of about 1000 corresponds to a CBI of 3 and the most extreme high burn severity post-fire conditions.
Project: Arctic-Boreal Vulnerability Experiment
The Arctic-Boreal Vulnerability Experiment (ABoVE) is a NASA Terrestrial Ecology Program field campaign based in Alaska and western Canada between 2016 and 2021. Research for ABoVE links field-based, process-level studies with geospatial data products derived from airborne and satellite sensors, providing a foundation for improving the analysis and modeling capabilities needed to understand and predict ecosystem responses and societal implications.
Related Publications:
Potter, C. & C. Hugny. 2018. Wildfire effects on permafrost and soil moisture in spruce forests. J. For. Res. https://doi.org/10.1007/s11676-018-0831-2
Potter, C. 2018. Ecosystem carbon emissions from 2015 forest fires in interior Alaska. Carbon Balance and Management. 13:2 https://doi.org/10.1186/s13021-017-0090-0
Acknowledgments:
This research received funding from the Arctic Boreal and Vulnerability Experiment (ABoVE) project.
Data Characteristics
Spatial Coverage: Thirty-eight sites along the confluence of the Yukon and Tanana Rivers about 200 km west of Fairbanks, Alaska.
ABoVE Reference Locations:
Domain: Core ABoVE
State/territory: Alaska
Grid cell(s): Ah0Av0Bh6Bv4Ch36Cv27, Ah0Av0Bh6Bv4Ch36Cv26, Ah0Av0Bh5Bv4Ch35Cv26
Spatial resolution: Multiple points
Temporal coverage: Surveys and field measurements were conducted in 2017.
Temporal resolution: One time
Study Areas (All latitude and longitude given in decimal degrees)
| Site | Westernmost Longitude | Easternmost Longitude | Northernmost Latitude | Southernmost Latitude |
|---|---|---|---|---|
| Sites along the Tanana and Yukon Rivers, Alaska | -152.4160161 | -151.9505458 | 65.23154377 | 65.09677249 |
Data File Information
There is one data file in comma-separated format (.csv) provided with this dataset. A companion file of the same data is provided in compressed shapefile (.shp inside .zip) format.
Data file: AK_TananaSurveys_2017.csv
Companion file: AK_TananaSurveys_2017.zip
Data Dictionary
Table 1. Variables in the .csv and .shp data files
| Column names | Units/format | Description |
|---|---|---|
| site_number | GPS Number (Investigator's Site Number) | |
| date_time | yyyy-mm-ddThh:mm:ssZ | Date and time of measurements, UTC |
| date | yyyy-mm-dd | Date of measurement, UTC |
| time | hh:mm:ss | Time of measurements, UTC |
| longitude | Decimal degrees | Longitude of site |
| latitude | Decimal degrees | Latitude of site |
| elevation | m | Elevation of site |
| RdNBR_2015 | unitless | Relative differenced Normalize Burn Ratio for year 2015 |
| RdNBR_2016 | unitless | Relative differenced Normalize Burn Ratio for year 2016 |
| CBI | unitless | Composite Burn Index estimated at each soil sampling site-a ranking of variables between 0 and 3 for the level of burn severity. The data provided should be divided by 5 to obtain the 0 to 3 ranking. A value of 3.0 indicates complete consumption of all pre-fire forest (strata) biomass |
| standing_trees | % | Standing trees. Percent of trees on site that are standing. |
| groundcover_temp_1 | degrees C | Temperature measurement of the organic layer ground cover, from probe 1 |
| groundcover_temp_2 | degrees C | Temperature measurement of the organic layer ground cover, from probe 2 |
| groundcover_temp_3 | degrees C | Temperature measurement of the organic layer ground cover, from probe 3 |
| groundcover_temp_4 | degrees C | Temperature measurement of the organic layer ground cover, from probe 4 |
| thaw_depth_1 | cm | Depth to permafrost measured from corner 1 of the square meter sampling area around the soil pit center |
| thaw_depth _2 | cm | Depth to permafrost measured from corner 2 of the square meter sampling area around the soil pit center |
| thaw_depth _3 | cm | Depth to permafrost measured from corner 3 of the square meter sampling area around the soil pit center |
| thaw_depth _4 | cm | Depth to permafrost measured from corner 4 of the square meter sampling area around the soil pit center |
| thaw_depth _avg | cm | Depth to permafrost - average of 4 measurements |
| thaw_depth _2se | cm | Depth to permafrost - two standard errors of the mean |
| surface_temp | degrees C | Surface temperature - surface organic layer (3 cm) |
| surface_vwc | % | Soil volumetric water content - surface organic layer (3 cm) |
| soil_temp_10cm | degrees C | Soil temperature at 10 cm depth |
| soil_vwc_10cm | % | Soil volumetric water content at 10 cm depth |
| soil_temp_30cm | degrees C | Soil temperature at 30 cm depth |
| soil_vwc_30cm | % | Soil volumetric water content at 30 cm depth |
| carbon | % | Surface mineral soil carbon (% sample dry weight) |
| nitrogen | % | Surface mineral soil nitrogen (% sample dry weight) |
| sulfur | % | Surface mineral soil sulfur (% sample dry weight) |
| C_N_ratio | unitless | Carbon/Nitrogen ratio |
| soil_moisture | % | Soil moisture - gravimetric |
Application and Derivation
This work was undertaken as part of the NASA Arctic Boreal Vulnerability Experiment (ABoVE) field campaign, to better understand changes in related hydrologic and biogeochemical mechanisms in the years following boreal forest wildfires.
Quality Assessment
The standard error is included for thaw depth measurements.
Data Acquisition, Materials, and Methods
Study Area
Field measurements were carried out in boreal forests of various states of disturbance from 2015 wildfires that burned more than 200,000 ha surrounding the confluence of the Yukon and Tanana Rivers about 200 km west of Fairbanks, Alaska. Forests in the study area are predominately black spruce on wetter soils and white spruce (Picea glauca) on drier soils.
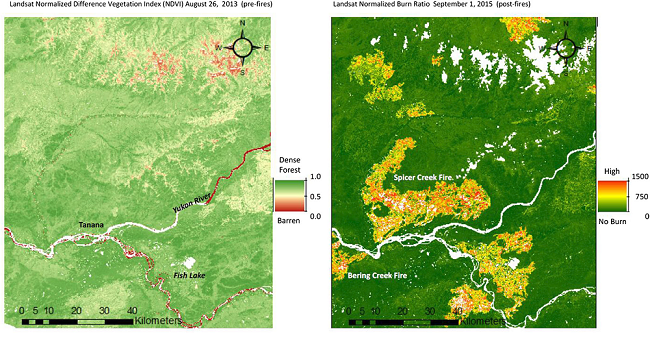
Figure 2. Left- A pre-fire (2013) Landsat normalized difference vegetation index (NDVI). Right- Landsat normalized burn ratio (RdNBR) for 2015 fires based on pre-fire imagery from July 2014 and post-fire imagery from September 2015 (Potter & Hugny, 2018).
In July 2017, burned areas and adjacent unburned forest stands were surveyed along and within the boundaries of the Spicer Creek Fire and the Blind River-Bering Creek Fires on either bank of the Yukon River near Tanana (Figure 2), all within 15 miles of the village of Tanana. According to Monitoring Trends in Burn Severity mapping (mtbs.gov; Eidenshink et al., 2007), the Spicer Creek Fire of 2015 burned 71,590 ha (176,904 acres) near Tanana, with 48% consumed at high burn severity (HBS) and another 26% at moderate burn severity (MBS). The Bering Creek Fire of 2015 burned 30,874 ha (76,292 acres).
Soil Measurements and Sampling
At each of the 19 unburned and 19 burned forest sites, soils were excavated to a depth of 30 cm in soil pits and sampled in this manner.
- Soils were consistently measured starting at 10 cm depth (below the surface organic layer) down to 30 cm mineral soil depth.
- There was no variation in the relative position in soil sampling depth among the all the soil pits excavated.
At each sampling site, at least 500 g of mineral soil sample was collected from each pit, starting at 10 cm depth (below the bottom level of the surface organic layer) down to 30 cm mineral soil depth. Samples were sealed in ziplock plastic bags, and shipped to the Oregon State University Crop and Soil Science Central Analytical Laboratory for analysis of carbon and nitrogen content by the total elemental combustion technique (Potter, 2018).
Soil temperature was measured using a ThermCo digital thermometer with a 7-cm stainless steel probe (with an accuracy of ±1° C) inserted into the organic layer ground cover, and at 10 cm and 30 cm mineral soil depths.
Percent volumetric water content (VWC) was measured into the surface organic layer and at same two soil depths (10- and 30-cm) using a FieldScout 300 Soil Moisture Meter (Spectrum Technologies, Inc) with 3.8 cm rod probes.
Depth to permafrost was measured at each of the four corners of the square meter sampling area around the soil pit center using a 1-m stainless steel rod (1 cm diameter) inserted at the bottom of each soil pit (Potter & Hugny, 2018).
Composite Burn Index (CBI) Estimation and Relative dNB
At each soil sampling site ocular estimates were made of the degree of change caused by 2015 wildfire within five forest strata: (1) substrate layer, (2) low vegetation less than 1-m tall, (3) tall shrubs/sapling trees 1-2 m tall, (4) intermediate trees 2-8 m tall, and (5) large trees > 8 m tall. Within each stratum, four to five variables were scored to generate a CBI ranking between 0 and 3 for the level of burn severity. A CBI value of 3.0, indicating complete consumption of all pre-fire forest (strata) biomass during the 2015 fires, corresponded to a Landsat RdNBR value of about 1000 and the most extreme HBS post-fire conditions (Potter & Hugny, 2018).
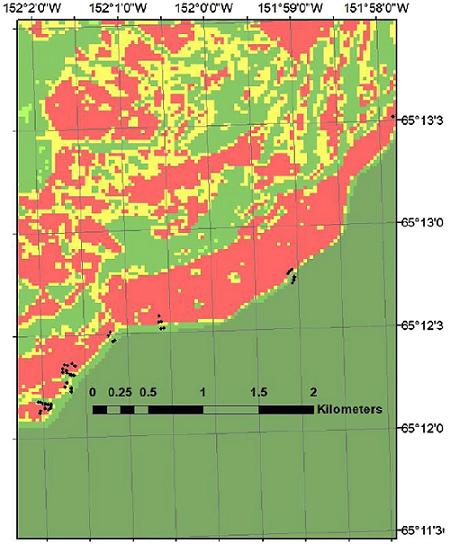
Figure 3. Measurement sites for Composite Burn Index (CBI) estimation and soil attributes within the Spicer Creek Fire’s Landsat normalized burn ratio (RdNBR) classes (Potter & Hugny, 2018).
Landsat Burn Severity Classes
Digital maps of burn severity classes at 30-m spatial resolution for the 2015 Spicer and Bering Creek Fires were obtained from the MTBS project (Eidenshink et al., 2007). The normalized burn ratio (NBR) index was first calculated using approximately one year pre-fire and post-fire images from the NIR and SWIR bands of the Landsat sensors:
NBR = (NIR – SWIR) / (NIR + SWIR)
Pre- and post-fire NBR images were differenced for each Landsat scene pair to generate the Relative dNBR:
RdNBR = [(NBRpre-fire – NBRpost-fire)] / √ABS (NBRpre-fire)
Data Access
These data are available through the Oak Ridge National Laboratory (ORNL) Distributed Active Archive Center (DAAC).
ABoVE: Characterization of Burned and Unburned Spruce Forest Sites, Tanana, AK, 2017
Contact for Data Center Access Information:
- E-mail: uso@daac.ornl.gov
- Telephone: +1 (865) 241-3952
References
Eidenshink J, Schwind B, Brewer K, Zhu Z, Quayle B, Howard S (2007). A project for monitoring trends in burn severity. Fire Ecol3(1):3–21. https://doi.org/10.4996/fireecology.0301003
Potter, C. & C. Hugny. 2018. Wildfire effects on permafrost and soil moisture in spruce forests. J. For. Res. https://doi.org/10.1007/s11676-018-0831-2
Potter, C. 2018. Ecosystem carbon emissions from 2015 forest fires in interior Alaska. Carbon Balance and Management. 13:2 https://doi.org/10.1186/s13021-017-0090-0