Documentation Revision Date: 2022-06-24
Dataset Version: 1
Summary
There are 12 data files included in this dataset. Four land cover maps are provided in cloud-optimized GeoTIFFs (*.tif) format, and three sensor footprints are provided as both compressed Keyhole Markup Language (*.kmz) and compressed archives (*.zip) of shapefiles. Also included are PAD_2019_Model_cls.lyr and PAD_wetland.clr that provide useful color schemes for viewing the GeoTIFFs with GIS software.
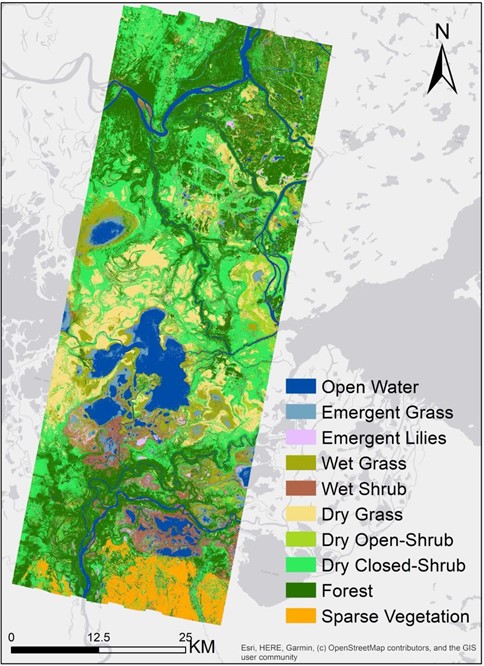
Figure 1. The wetland vegetation community classification for the Peace-Athabasca Delta, Alberta, Canada created from AVIRIS-NG derived features.
Citation
Wang, C., T.M. Pavelsky, E.D. Kyzivat, F. Garcia-Tigreros, F. Yao, X. Yang, S. Zhang, C. Song, T. Langhorst, W. Dolan, M. Kurek, M.E. Harlan, L.C. Smith, D. Butman, R.G.M. Spencer, C.J. Gleason, and D.L. Peters. 2022. ABoVE: Wetland Vegetation Classification for Peace-Athabasca Delta, Canada, 2019. ORNL DAAC, Oak Ridge, Tennessee, USA. https://doi.org/10.3334/ORNLDAAC/2069
Table of Contents
- Dataset Overview
- Data Characteristics
- Application and Derivation
- Quality Assessment
- Data Acquisition, Materials, and Methods
- Data Access
- References
Dataset Overview
This dataset contains land cover classification focused on water and wetland vegetation communities over the Peace-Athabasca Delta, Canada. Four classification maps with 5-m resolution were derived from various combinations of Airborne Visible/Infrared Imaging Spectrometer-Next Generation (AVIRIS-NG) and Uninhabited Aerial Vehicle Synthetic Aperture Radar (UAVSAR) acquired in July and September 2019, and a historical LiDAR archive data. The maps include 10 land cover classes, including open water, emergent aquatic vegetation types, terrestrial vegetation, and forest. Based on field data, the best-performing model, which combined all three data sources, achieved an overall accuracy of 93.5%.
Project: Arctic-Boreal Vulnerability Experiment
The Arctic-Boreal Vulnerability Experiment (ABoVE) is a NASA Terrestrial Ecology Program field campaign being conducted in Alaska and western Canada, for 8 to 10 years, starting in 2015. Research for ABoVE links field-based, process-level studies with geospatial data products derived from airborne and satellite sensors, providing a foundation for improving the analysis, and modeling capabilities needed to understand and predict ecosystem responses to, and societal implications of, climate change in the Arctic and Boreal regions.
Related Publication
Wang, C., T.M. Pavelsky, E.D. Kyzivat, F. Garcia-Tigreros, F. Yao, X. Yang, S. Zhang, C. Song, T. Langhorst, W. Dolan, M. Kurek, M.E. Harlan, L.C. Smith, D. Butman, R.G.M. Spencer, C.J. Gleason, M.M. Dornblaser, K.P. Wickland, and D.L. Peters. Quantification of wetland vegetation communities features with airborne AVIRIS-NG, UAVSAR, and UAV LiDAR data in Peace-Athabasca Delta. 2022, in process.
Related Datasets
Kyzivat, E.D., L.C. Smith, C. Huang, C. Wang, T. Langhorst, J.V. Fayne, M.E. Harlan, Y. Ishitsuka, D. Feng, L.H. Pitcher, and T.M. Pavelsky. 2021. ABoVE: Lake and Wetland Classification from L-band SAR, Alaska and Canada, 2017-2019. ORNL DAAC, Oak Ridge, Tennessee, USA. https://doi.org/10.3334/ORNLDAAC/1883
Kyzivat, E.D., L.C. Smith, L.H. Pitcher, J. Arvesen, T.M. Pavelsky, S.W. Cooley, and S. Topp. 2018. ABoVE: AirSWOT Color-Infrared Imagery Over Alaska and Canada, 2017. ORNL DAAC, Oak Ridge, Tennessee, USA. https://doi.org/10.3334/ORNLDAAC/1643
Pitcher, L.H., L.C. Smith, T.M. Pavelsky, J.V. Fayne, S.W. Cooley, E.H. Altenau, D.K. Moller, and J. Arvesen. 2019. ABoVE: AirSWOT Radar, Orthomosaic, and Water Masks, Yukon Flats Basin, Alaska, 2015. ORNL DAAC, Oak Ridge, Tennessee, USA. https://doi.org/10.3334/ORNLDAAC/1655
- These ABoVE datasets employed similar methods for collecting field-based, ground-truth data and connected those data to imagery from airborne platforms.
Acknowledgments
This project was supported by NASA's Terrestrial Ecology Program, Arctic-Boreal Vulnerability Experiment (grant 80NSSC19M0104).
Data Characteristics
Spatial Coverage: Peace-Athabasca Delta, Alberta, Canada
ABoVE Reference Locations
Domain: Core ABoVE
State/Territory: Alberta, Canada
Cells: Bh013v013, Bh013v014, Bh014v013, Bh014v014, Ch082v081, Ch082v082, Ch082v083, Ch083v080, Ch083v081, Ch083v082, Ch083v083, Ch083v084, Ch084v080, Ch084v081, Ch084v082, Ch084v083, Ch084v084, Ch085v080, Ch085v081, Ch085v082, Ch085v083
Spatial Resolution: 5 m
Temporal Coverage: 2019-07-15 to 2019-09-15
Temporal Resolution: one-time estimate
Study Area: Latitude and longitude are given in decimal degrees.
| Site | Westernmost Longitude | Easternmost Longitude | Northernmost Latitude | Southernmost Latitude |
|---|---|---|---|---|
| Peace-Athabasca Delta, Canada | -112.1071 | -110.8310 | 59.1425 | 58.2120 |
Data File Information
There are 12 data files included in this dataset. Four land cover maps are provided in cloud-optimized GeoTIFFs (*.tif) format, and three sensor footprints are provided as both compressed Keyhole Markup Language (*.kmz) and compressed archives (*.zip) of shapefiles. Also included are PAD_2019_Model_cls.lyr and PAD_wetland.clr that provide useful color schemes for viewing the GeoTIFFs with GIS software.
The GeoTIFFs are named PAD_2019_ModelX_cls_v1.tif, where X is model number 1, 2, 3, or 4 (Table 1).
The footprint files are named PAD_ AAAA_Footprint.ext, where
- AAAA = the sensor: "AVIRIS" (for AVIRIS-NG), "LiDAR, or "UAVSAR"
- ext = indicates the file type: "kmz" or "zip" (shapefile in compressed archive).
Table 1. GeoTIFF file named and descriptions
| File Name | Description |
|---|---|
| PAD_2019_Model1_cls_v1.tif | Land cover classification derived from AVIRIS-NG data |
| PAD_2019_Model2_cls_v1.tif | Land cover classification derived from AVIRIS-NG and UAVSAR data |
| PAD_2019_Model3_cls_v1.tif | Land cover classification derived from AVIRIS-NG and LiDAR data |
| PAD_2019_Model4_cls_v1.tif | Land cover classification derived from AVIRIS-NG, UAVSAR, and LiDAR data |
Data File Details
Each of the footprint files holds a single polygon. The projection for the shapefiles are in the standard ABoVE projection (Canada Albers Equal Area; ESRI:102001). The KMZ files are in geographic coordinates (EPSG:4326).
The GeoTIFF files have the following characteristics:
- Spatial resolution = 5 m raster cells
- 11,496 rows and 19,907 columns
- Projection = Canada Albers Equal Area, NAD83 datum, ESRI:102001
- One band with 10 land cover classes (Table 2)
- No data value = 256
- Cloud-optimized GeoTIFF (COG) format
Table 2. Land cover classes in the GeoTIFF files.
| Cell Value | Class | Description | Field Photo |
|---|---|---|---|
| 0 | Unclassified | No cover class assigned; outside of footprint of at least one predictor dataset | |
| 1 | Open Water | Areas of open water, such as lakes, ponds, and rivers, lacking emergent vegetation |  |
| 2 | Emergent Grass | Narrow-leaf vegetation emerging from water surface with coverage of 25-50% |  |
| 3 | Emergent Lilies | Broad-leaf, floating aquatic vegetation such as water lilies |  |
| 4 | Wet Grass | Wet dense graminoid species (e.g., grasses and sedges) with coverage >50% |  |
| 5 | Wet Shrub | Wet shrub swamp (i.e., low, woody vegetation such as willows) with canopy height of 1-5 m tall |  |
| 6 | Dry Grass | Dry graminoid (e.g., meadow) |  |
| 7 | Dry Open-Shrub | Dry shrub swamp (i.e., low, woody vegetation such as willows) with coverage of 20-50% and canopy of 1-5 m tall |  |
| 8 | Dry Closed-Shrub | Dry shrub swamp (i.e., low, woody vegetation such as willows) but denser (thicket/shrub), with coverage >= 50% and canopy height of 1-5 m tall |  |
| 9 | Forest | Forested woody vegetation with canopy height >5 m |  |
| 11 | Sparse Vegetation | Exposed rock, gravel, sand, and other parent materials (coverage >=60%) with sparsely growing vegetation |  |
PAD_2019_Model_cls.lyr is a binary file holding a color symbology with labels for viewing the GeoTIFFs with ArcGIS software.
PAD_wetland.clr is colormap file in text format with recommended RGB values for viewing GeoTIFFs.
Application and Derivation
NASA’s Arctic-Boreal Vulnerability Experiment (ABoVE) has conducted numerous airborne flights across western Canada and Alaska since 2017 that collected a substantial amount of fine spatial resolution (<10 m) airborne remote sensed imagery, such as AVIRIS-NG and UAVSAR. These collections include the Peace-Athabasca Delta (PAD) in northeastern Alberta, Canada, which is one of the world’s largest inland freshwater deltas with diverse vegetation communities. These airborne data, in combination with historical high-resolution LiDAR datasets (i.e., Peters et al., 2020), provide a rare opportunity to generate high spatial resolution of vegetation communities in ways that were not previously possible. These high-resolution wetland vegetation community classification maps can reveal the spatial distribution of vegetation communities (Wang et al., 2022).
Quality Assessment
The classification accuracy was assessed using a standard confusion matrix, using a ground reference dataset. Classifications built with AVIRIS-NG-derived features provide relatively high accuracies (≥87.9%) in mapping wetland vegetation communities. The combination of AVIRIS-NG-derived with UAVSAR-derived features substantially reduced omission errors of wet-grass and wet-shrub classes from 29.6% to 20.5% and from 10.8% to 7.5%, respectively. Incorporating AVIRIS-NG-derived with LiDAR-derived features enhanced the classification for almost all types with an increase in overall accuracy and Kappa statistic of 2.2% and 3.2%, respectively, especially for the classes of emergent grass, wet-grass, and wet-shrub. The best-performing model using observations from three sensors together achieved an overall accuracy of 93.5%.
Data Acquisition, Materials, and Methods
Site Description
The Peace-Athabasca Delta (PAD), located in northeast Alberta, Canada (approximately 58°42'N 111°08'W), is one of the world's largest inland river deltas. PAD encompasses four large lakes, numerous smaller lakes and wetlands, and contains abundant aquatic vegetation, marshes, sedge meadows, shrublands, and forests, scattered with hundreds of perched wetland basins that form thousands of kilometers of shoreline (Pavelsky and Smith, 2008).
Materials Airborne Dataset
The Airborne Visible InfraRed Imaging Spectrometer - Next Generation (AVIRIS-NG; https://avirisng.jpl.nasa.gov) instrument, operated by NASA/JPL, is an airborne imaging spectrometer that follows a pushbroom design with a 1 milliradian instantaneous field of view of 34°. It typically results in altitude-dependent ground sampling distances (i.e., spatial resolutions) from 20 m to sub-meter (Thompson et al. 2015, 2018, and 2019).
The Uninhabited Aerial Vehicle Synthetic Aperture Radar (UAVSAR; http://uavsar.jpl.nasa.gov/) instrument, also operated by NASA/JPL, is a highly sensitive left-looking fully polarimetric airborne L-band SAR system operating at a wavelength of 24 cm at an incidence angle range of 22–67° spanning about 22 km in the cross track direction.
During the 2019 ABoVE summer campaign, NASA/JPL collected a total of 18 AVIRIS-NG scenes on 15 and 16 July 2019 (Table 3) and one UAVSAR scene (flight line ID 13510) on 2019-09-04, corresponding to the area partially covering the PAD. Orthorectified, radiometrically, and atmospherically corrected Level 2 AVIRIS-NG surface reflectance products were available (https://avirisng.jpl.nasa.gov/dataportal/) (Thompson et al., 2015; Thompson et al., 2019). The UAVSAR products used in this study were the multi-looked ground range projected (equiangular) imagery. The pixel spacing is 0.2 by 0.4 arcsec along the latitude and longitude directions, respectively.
Table 3. AVIRIS-NG scenes for this project.
| Site Name | Flight Scene | Acquisition Date (YYYYMMDD hh:mm) |
|---|---|---|
| PeaceAth_L001_FL182 | ang20190715t174825 | 2019-07-15 17:54 |
| PeaceAth_L002_FL182 | ang20190715t180405 | 2019-07-15 18:10 |
| PeaceAth_L003_FL182 | ang20190715t181946 | 2019-07-15 18:26 |
| PeaceAth_L004_FL182 | ang20190715t183539 | 2019-07-15 18:41 |
| PeaceAth_L005_FL182 | ang20190715t185057 | 2019-07-15 18:57 |
| PeaceAth_L006_FL182 | ang20190715t190704 | 2019-07-15 19:13 |
| PeaceAth_L007_FL182 | ang20190715t192202 | 2019-07-15 19:28 |
| PeaceAth_L008_FL182 | ang20190716t160011 | 2019-07-16 16:6 |
| PeaceAth_L009_FL182 | ang20190716t161629 | 2019-07-16 16:23 |
| PeaceAth_L007_FL182 | ang20190716t163352 | 2019-07-16 16:40 |
| PeaceAth_L010_FL182 | ang20190716t164941 | 2019-07-16 16:56 |
| PeaceAth_L008_FL182 | ang20190716t170505 | 2019-07-16 17:11 |
| PeaceAth_L009_FL182 | ang20190716t172106 | 2019-07-16 17:27 |
| PeaceAth_L007_FL182 | ang20190716t173655 | 2019-07-16 17:43 |
| PeaceAth_L010_FL182 | ang20190716t175243 | 2019-07-16 17:59 |
| PeaceAth_L006_FL182 | ang20190716t182617 | 2019-07-16 18:33 |
| PeaceAth_L011_FL182 | ang20190716t184314 | 2019-07-16 18:50 |
AVIRIS-NG Processing
First, all AVIRIS-NG scenes were projected into geographic North using pixel-by-pixel rotation with bicubic resampling. There were slight mismatches of 2–5 pixels (i.e., 10–30 m) in the overlapping areas of adjacent AVIRIS-NG scenes that was reduced using a fine-grained alignment image co-registration algorithm. A Sentinel-2 scene was used a a reference for this process. Cloud and cloud shadow pixels were excluded (Ghasemian and Akhoondzadeh, 2018). The methods of Colgan et al. (2012) were used to mitigate bidirectional reflectance (BRDF) effects and to calculate spectral features as inputs for land cover classification. Using a principal components (PC) analysis, the 425 spectral bands in AVIRIS-NG images were reduced to 12 components (Wang et al., 2022). PC features have been commonly employed in land cover mapping using hyperspectral data (Stratoulias et al., 2018).
UAVSAR Processing
Ten decomposed polarimetric parameters were derived from the UAVSAR dataset (Wang et al., 2022): Three Pauli decomposition parameters, three Freeman-Durden decomposition parameters (i.e., Odd, odd bounce scattering; Dbl, double-bounce scattering; and Vol, volume scattering), and four H/A/Alpha decomposition parameters (i.e., entropy, anisotropy, alpha, and lambda) (Cloude and Pottier 1997; Freeman and Durden, 1998; Qi et al., 2012).
LiDAR Processing
Airborne LiDAR-derived digital elevation model (DEM) and canopy height model (CHM) datasets for our study area were obtained from Peters et al. (2020). The DEM and CHM datasets were projected to a 5-m grid matching the AVIRIS-NG data using bicubic resampling.
Training & Validation Datasets
The land cover classification focused on common vegetation communities found in the PAD, including emergent grass, emergent lilies, wet grass (i.e., graminoid), wet shrub, dry grass, dry open-shrub, dry closed- shrub, upland forest, along with open water and sparse vegetation cover types (Table 2).
Ground reference data was developed by visually interpreting field photographs and ultra high resolution UAV orthophotos collected in July and August 2019, concurrent with NASA’s 2019 airborne campaign. Reference data consisted of small polygons of uniform vegetation cover types; creating polygons of mixing classes was avoided. One-pixel random points in these polygons were used for building training and validation samples. To minimize the effects of spatial autocorrelation and gridding artifacts (e.g. pixel shift), adjacent reference points were >10 m apart. The ground reference dataset was created by using these points to extract values from the ground reference polygons and each of the predictor rasters (i.e., AVIRIS-NG, UAVSAR, and LiDAR). Then, this dataset was randomly divided into two subsets, approximately 75% of points for training (n=6732) and the remaining points for validation (n=2410).
Classification Models
The random forest (RF) classifier method was use because it is a type of ensemble of many decision tree models formed through bagging and boosting on various sub-samples of the training dataset (Breiman, 2001). RF is not susceptible to outliers in the training dataset and is not prone to overfitting.
Four classification models were created that used predictors from:
- AVIRIS-NG derived features only
- AVIRIS-NG and UAVSAR-derived features
- AVIRIS-NG and LiDAR-derived (terrain and CHM) features
- AVIRIS-NG, UAVSAR, and LiDAR-derived features.
Model 1 was considered the base model because one of our focuses of this study was to evaluate vegetation communities mapping with AVIRIS-NG hyperspectral data. The accuracy of these models were assessed by comparing the predicted cover types to the validation dataset.
Data Access
These data are available through the Oak Ridge National Laboratory (ORNL) Distributed Active Archive Center (DAAC).
ABoVE: Wetland Vegetation Classification for Peace-Athabasca Delta, Canada, 2019
Contact for Data Center Access Information:
- E-mail: uso@daac.ornl.gov
- Telephone: +1 (865) 241-3952
References
Breiman, L. 2001. Random Forests. Machine Learning 45:5-32. https://doi.org/10.1023/A:1010933404324
Cloude, S. R., and E. Pottier. 1997. An entropy based classification scheme for land applications of polarimetric SAR. IEEE Transactions on Geoscience and Remote Sensing 35:68-78. https://doi.org/10.1109/36.551935
Colgan, M. S., C. A. Baldeck, J.-B. Féret, and G. P. Asner. 2012. Mapping savanna tree species at ecosystem scales using support vector machine classification and BRDF correction on airborne hyperspectral and LiDAR data. Remote Sensing 4:3462-3480. https://doi.org/10.3390/rs4113462
Freeman, A., and S. L. Durden. 1998. A three-component scattering model for polarimetric SAR data. IEEE Transactions on Geoscience and Remote Sensing 36:963-973. https://doi.org/10.1109/36.673687
Ghasemian, N., and M. Akhoondzadeh. 2018. Introducing two Random Forest based methods for cloud detection in remote sensing images. Advances in Space Research 62:288-303. https://doi.org/10.1016/j.asr.2018.04.030
Pavelsky, T. M., and L. C. Smith. 2008. Remote sensing of hydrologic recharge in the Peace- Athabasca Delta, Canada. Geophysical Research Letters 35:L08403. https://doi.org/10.1029/2008GL033268
Peters, D.L., K.O. Niemann, and R. Skelly. 2020. Remote sensing of ecosystem structure: fusing passive and active remotely sensed data to characterize a deltaic wetland landscape. Remote Sensing 12:3819. https://doi.org/10.3390/rs12223819
Qi, Z., A. G.-O. Yeh, X. Li, and Z. Lin. 2012. A novel algorithm for land use and land cover classification using RADARSAT-2 polarimetric SAR data. Remote Sensing of Environment 118:21-39. https://doi.org/10.1016/j.rse.2011.11.001
Stratoulias, D., H. Balzter, A. Zlinszky, and V. R. Tóth. 2018. A comparison of airborne hyperspectral-based classifications of emergent wetland vegetation at Lake Balaton, Hungary. International Journal of Remote Sensing 39:5689-5715. https://doi.org/10.1080/01431161.2018.1466081
Thompson, D. R., B.-C. Gao, R. O. Green, D. A. Roberts, P. E. Dennison, and S. R. Lundeen. 2015. Atmospheric correction for global mapping spectroscopy: ATREM advances for the HyspIRI preparatory campaign. Remote Sensing of Environment 167:64-77. http://dx.doi.org/10.1016/j.rse.2015.02.010
Thompson, D. R., J. W. Boardman, M. L. Eastwood, R. O. Green, J. M. Haag, P. Mouroulis, and B. Van Gorp. 2018. Imaging spectrometer stray spectral response: In-flight characterization, correction, and validation. Remote Sensing of Environment 204:850-860. https://doi.org/10.1016/j.rse.2017.09.015
Thompson, D. R., K. Cawse-Nicholson, Z. Erickson, C. G. Fichot, C. Frankenberg, B.-C. Gao, M. M. Gierach, R. O. Green, D. Jensen, V. Natraj, and A. Thompson. 2019. A unified approach to estimate land and water reflectances with uncertainties for coastal imaging spectroscopy. Remote Sensing of Environment 231:111198. https://doi.org/10.1016/j.rse.2019.05.017