Documentation Revision Date: 2019-09-30
Dataset Version: 1
Summary
The largest map, 'Toolik', (6 km2) covers research areas near Toolik Field Station at Toolik Lake, including Arctic LTER installations. The 'Pipeline' map (3 km2) follows a stretch of the Trans-Alaska Pipeline, and the 'Imnavait' map (3 km2) includes research areas along Imnavait Creek, roughly 10 km east of Toolik Lake.
Field reference data were collected in the summers of 2014 and 2015 from 800 plots across all lidar footprints to ensure inclusion of a wide range of slope, aspect, elevation, glacial history, shrub types and vegetation across topographic transects. Nadir photographs were taken of the field plots and the vegetation was visually classified according to prior classification studies of the area. Twenty-five percent of reference plots were withheld for accuracy assessment; the remaining plots were used to build the Random Forest model. The predictor data, field data, and photographs are not included with this dataset.
There are three data files in GeoTIFF (.tif) format with this dataset.
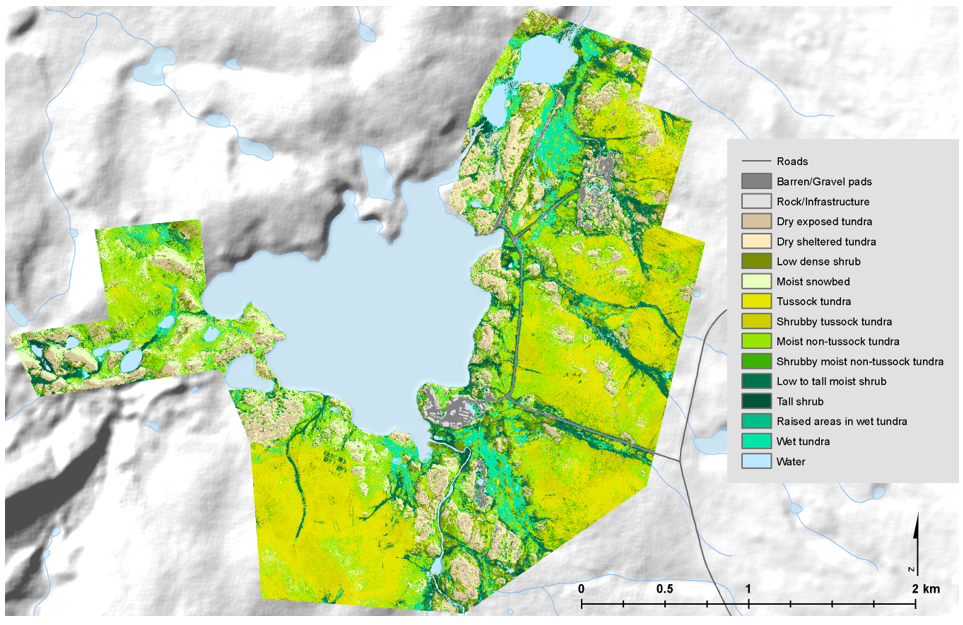
Figure 1. Map of vegetation communities for the Toolik footprint shown at 1:25,000 scale (Greaves et al., 2019, in process).
Citation
Greaves, H.E., J. Eitel, L. Vierling, N. Boelman, K. Griffin, T. Magney, and C. Prager. 2019. High-Resolution Vegetation Community Maps, Toolik Lake Area, Alaska, 2013-2015. ORNL DAAC, Oak Ridge, Tennessee, USA. https://doi.org/10.3334/ORNLDAAC/1690
Table of Contents
- Dataset Overview
- Data Characteristics
- Application and Derivation
- Quality Assessment
- Data Acquisition, Materials, and Methods
- Data Access
- References
Dataset Overview
This dataset contains vegetation community maps at 20 cm resolution for three landscapes near the Toolik Lake research area in the northern foothills of the Brooks Range, Alaska, USA. The maps were built using a Random Forest modeling approach using predictor layers derived from airborne lidar data and high-resolution digital airborne imagery collected in 2013, and vegetation community training data collected from 800 reference field plots across the lidar footprints in 2014 and 2015. Vegetation community descriptions were based on the commonly used classifications of existing Toolik area vegetation maps.
The largest map, 'Toolik', (6 km2) covers research areas near Toolik Field Station at Toolik Lake, including Arctic LTER installations. The 'Pipeline' map (3 km2) follows a stretch of the Trans-Alaska Pipeline, and the 'Imnavait' map (3 km2) includes research areas along Imnavait Creek, roughly 10 km east of Toolik Lake.
Field reference data were collected in the summers of 2014 and 2015 from 800 plots across all lidar footprints to ensure inclusion of a wide range of slope, aspect, elevation, glacial history, shrub types and vegetation across topographic transects. Nadir photographs were taken of the field plots and the vegetation was visually classified according to prior classification studies of the area. Twenty-five percent of reference plots were withheld for accuracy assessment; the remaining plots were used to build the Random Forest model. The predictor data, field data, and photographs are not included with this dataset.
Project: ABoVE
The Arctic-Boreal Vulnerability Experiment (ABoVE) is a NASA Terrestrial Ecology Program field campaign taking place in Alaska and western Canada between 2016 and 2021. Climate change in the Arctic and Boreal region is unfolding faster than anywhere else on Earth, resulting in reduced Arctic sea ice, thawing of permafrost soils, decomposition of long-frozen organic matter, widespread changes to lakes, rivers, coastlines, and alterations of ecosystem structure and function. ABoVE seeks a better understanding of the vulnerability and resilience of ecosystems and society to this changing environment.
Related Publication:
Greaves, H.E., J. Eitel, L.A. Vierling, N.T. Boelman, K.L. Griffin, T.S. Magney, and C.M. Prager. 2019. Airborne Lidar and multispectral imagery permit classification of heterogeneous Arctic tundra vegetation at 20 cm resolution (in prep).
Related Datasets:
Greaves, H.E., L. Vierling, J. Eitel, N. Boelman, T. Magney, C. Prager, and K. Griffin. 2018. High-Resolution Shrub Biomass and Uncertainty Maps, Toolik Lake Area, Alaska, 2013. ORNL DAAC, Oak Ridge, Tennessee, USA. https://doi.org/10.3334/ORNLDAAC/1573
Greaves, H.E., and E.A. Fortin. 2019. Ground-Based Vegetation Community Photos, Toolik Lake Area, Alaska, 2014-2015. ORNL DAAC, Oak Ridge, Tennessee, USA. https://doi.org/10.3334/ORNLDAAC/1718
Acknowledgements:
This research was funded with NASA grants NNX12AK83G, NNX15AP04H, and NNX10AM75H.
Data Characteristics
Spatial Coverage: The Toolik Lake area of the Alaskan North Slope
ABoVE Reference Locations:
Domain: Core ABoVE
State/territory: Alaska
Grid cells: Ah2Av1Bh12Bv11Ch75Cv71, Ah2Av1Bh12Bv11Ch76Cv71, Ah2Av1Bh13Bv10Ch79Cv65, Ah2Av1Bh13Bv11Ch79Cv66, Ah2Av1Bh13Bv11Ch78Cv67, Ah2Av1Bh13Bv11Ch79Cv67, Ah2Av1Bh13Bv11Ch83Cv67, Ah2Av1Bh14Bv11Ch84Cv67, Ah2Av1Bh12Bv11Ch77Cv68, Ah2Av1Bh13Bv11Ch78Cv68, Ah2Av1Bh12Bv11Ch76Cv69, Ah2Av2Bh12Bv12Ch75Cv72, Ah2Av1Bh12Bv11Ch76Cv70
Spatial Resolution: 20 cm
Temporal Coverage:
Aerial Lidar and imagery collection date: 2013-08-01
Field reference plot data collection dates: June - August 2014; July - August 2015
Temporal Resolution: One-time estimates
Study Areas: (All latitude and longitude given in decimal degrees)
|
Site (Region) |
Westernmost Longitude |
Easternmost Longitude |
Northernmost Latitude |
Southernmost Latitude |
|---|---|---|---|---|
|
Toolik Lake area in Alaska |
-149.6622389 |
-149.2921028 |
68.64954167 |
68.60395833 |
Data File Information
There are three data files in GeoTIFF (itif) format with this dataset.
Table 1. Filenames and descriptions
|
Filename |
Description |
|---|---|
|
Toolik_veg_class.tif |
Vegetation community classification for the Toolik area, approximately 6 km2, covering research areas near Toolik Field Station at Toolik Lake |
|
Pipeline_veg_class.tif |
Vegetation community classification for the pipeline area footprint, approximately 3 km2 and east of Toolik Lake. This area follows a stretch of the Trans-Alaska Pipeline from a high moraine ridge down a sloping drainage toward the Kuparuk River |
|
Imnavait_veg_class.tif |
Vegetation community classification for Imnavait Creek, roughly 10 km east of Toolik Lake covering an area about 3 km2 |
Data Properties
Table 2. Vegetation Community Map Codes
| Class | Vegetation Community |
|---|---|
| 0 | No data |
| 1 | Barren/Gravel pads |
| 2 | Rock/Infrastructure |
| 3 | Dry exposed tundra |
| 4 | Dry sheltered tundra |
| 5 | Low dense shrub |
| 6 | Moist snowbed |
| 7 | Tussock tundra |
| 8 | Shrubby tussock tundra |
| 9 | Moist non-tussock tundra |
| 10 | Shrubby moist non-tussock tundra |
| 11 | Low to tall moist shrub |
| 12 | Tall shrub |
| 13 | Raised areas in wet tundra |
| 14 | Wet tundra |
| 15 | Water |
Spatial Data Properties
EPSG: 26906 (NAD_1983_UTM_Zone_6N); Bands: 1; No Scale Factor; Resolution: 20 cm; Map units: meter
Application and Derivation
This dataset provides very high resolution maps which are needed to accurately represent the spatially heterogeneous Arctic tundra vegetation communities. These maps provide high-resolution plant community information that can serve as validation for coarser maps and as baseline data for vegetation monitoring and change detection. They also permit characterization of fine-scale landscape phenomena such as community-scale nutrient dynamics and wildlife habitat suitability, and provide an important reference for researchers working in the area (Greaves et al., 2019, in process).
Quality Assessment
Twenty five percent of the reference plot data were withheld to be used for accuracy assessment. Classification results for these withheld plots were used to calculate overall accuracy (fraction correct), balanced accuracy (mean class-wise fraction correct), Cohen's kappa, and weighted (fuzzy) kappa, which accounts for the degree of disagreement present. A confusion matrix was produced to describe accuracy for individual classes.
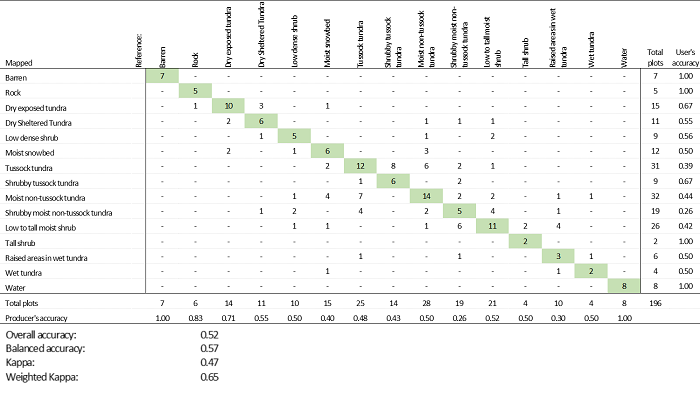
Figure 2. Confusion matrix and accuracy metrics for withheld test plots (Greaves et al., 2019, in process).
Data Acquisition, Materials, and Methods
Site Description
The study area is located on continuous permafrost tundra in the rolling northern foothills of the Brooks Range, northern Alaska. Surficial glacial features are prominent. The region is characterized by cold winters (mean coldest month temperature -30°C) and mild summers (mean warmest month temperature 13°C), with roughly 300 mm of precipitation annually. Vegetation is primarily graminoid tundra, especially Eriophorum vaginatum and Carex bigelowii, with abundant Sphagnum, lichens, mosses, and erect deciduous shrubs, particularly Betula nana and Salix species.
Airborne Data Collection
Airborne Lidar and high-resolution digital imagery were collected August 1, 2013. Data were collected in three discrete footprints totaling 12.5 km2
- The largest and westernmost footprint, 'Toolik' (approximately 6 km2), covers research areas near Toolik Field Station at Toolik Lake.
- The 'Pipeline' footprint is roughly 3 km2 and approximately 3 km east of Toolik Lake. It follows a stretch of the Trans-Alaska Pipeline from a high moraine ridge down a sloping drainage toward the Kuparuk River.
- The 'Imnavait' footprint is roughly 3 km2 and 10 km east of Toolik Lake and includes research areas along Imnavait Creek.
Airborne Lidar
The vendor performed pre-processing of the Lidar data, including aircraft attitude adjustments and ground control georectification. See Vierling et al. (2013a) for access to Lidar data in *.las format.
High-resolution Digital Imagery
High-resolution digital imagery was collected simultaneously with the Lidar on August 1, 2013. A Leica RCD30 60MP camera was mounted to the aircraft to capture 4-band digital imagery (RGB and near infrared, hereafter ‘RGBN’).
The imagery was orthorectified by the vendor and delivered as orthoimagery mosaics with a pixel resolution of roughly 4.25 cm. A GPS check of 40 stationary objects distributed across the Toolik footprint suggested that the imagery was accurately orthorectified to within approximately 10 cm. See Vierling et al. (2013b) for access to the orthophotographs.
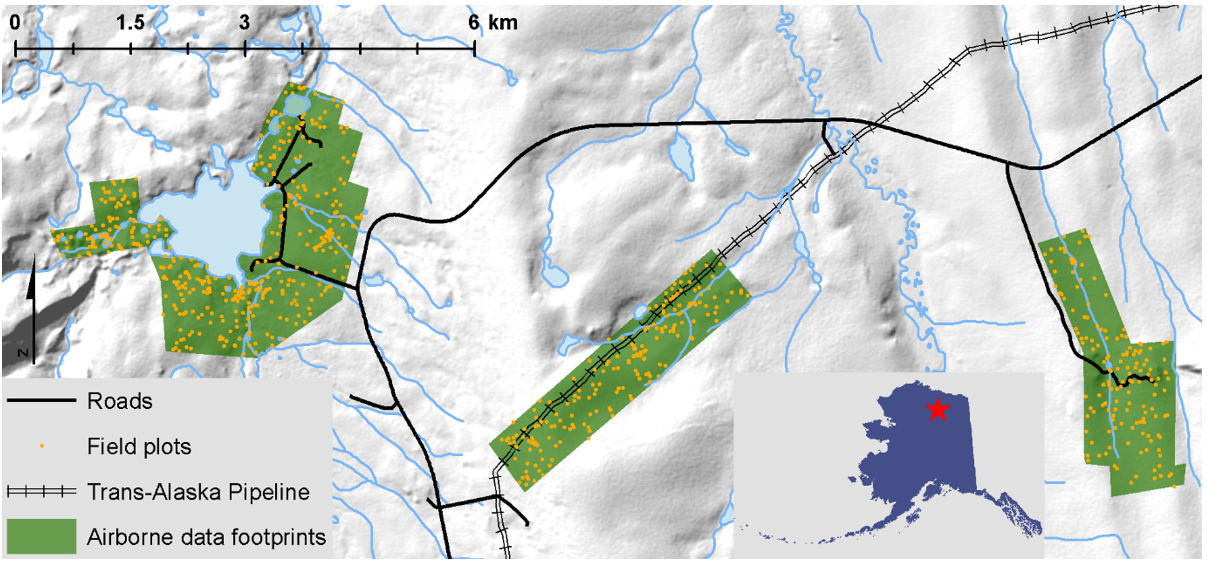
Figure 3. Airborne data collection footprints (in green; from left: Toolik, Pipeline, Imnavait) and locations of reference plots (orange dots). Inset map shows the location of the study area in Alaska (Greaves et al., 2019, in process).
Reference Field Plots
Field plot reference vegetation community data (not included with this dataset) were collected from across all footprints in summer 2014 and summer 2015 for testing and model training. The field data and photographs are not included with this dataset.
- The majority of plot locations (n = 592) were established in advance using a stratified random scheme to ensure inclusion of a wide range of slope, aspect, elevation, and glacial history across all footprints.
- An additional 47 plots were collected in the course of visiting the stratified random plots, to capture a wider range of shrub characteristics, and 92 more plots were collected in 2015 to represent additional shrub types and vegetation across topographic transects.
Reference Plot Observations
- Nadir photographs (not included with this dataset) were taken for each of these 731 total field plots from approximately 1-m height using a standard point-and-shoot consumer digital camera, capturing roughly 1 x 1.3 m of ground area.
- Brief notes were recorded at each plot describing plant species and surface features present in the plot and the general area,
- Measurements included: vegetation height measured using a meter stick; thaw depth measured using a steel thaw probe; and moss + organic soil depth, measured using a meter stick after slicing a small slit in the moss/organic mat with a serrated knife.
- The center coordinates of each plot photo were precisely measured using a TopCon GR-3 survey grade GNSS system operating in real-time kinematic (RTK) mode (Greaves et al., 2019, in process).
Reference Plot Vegetation Classification
This area has benefited from previous vegetation classification efforts, in particular by the Alaska Geobotany Center at the University of Alaska, Fairbanks, which has produced a hierarchical series of maps for the area depicting multiple surface features.
These include vegetation maps (http://www.arcticatlas.org) that provided a valuable benchmark for this project. Vegetation classes for the Alaska Geobotany Center maps were established using the Braun-Blanquet classification approach (Braun-Blanquet, 1965; Walker et al., 1994), in which species associations are grouped into a hierarchy of successively broader units.
- Each plot photo was visually examined and assigned to one of the 15 plant communities that best described the plants in the center of the photo where GNSS coordinates had been measured.
- Sixty-nine additional plots locations were selected from the orthophotos, to provide more reference data for gravel pads, blockfields (rock), and open water classes that were under-represented in the field data but could be confidently identified in the orthophotos (Greaves et al., 2019, in process).
Table 3. Final class names and counts for all reference plot data.
| Class name | Count |
|---|---|
| Barren | 28 |
| Rock | 24 |
| Dry exposed tundra | 52 |
| Dry Sheltered Tundra | 45 |
| Low dense shrub | 47 |
| Moist snowbed | 61 |
| Tussock tundra | 100 |
| Shrubby tussock tundra | 57 |
| Moist non-tussock tundra | 112 |
| Shrubby moist non-tussock tundra | 79 |
| Low to tall moist shrub | 84 |
| Tall shrub | 17 |
| Raised areas in wet tundra | 43 |
| Wet tundra | 17 |
| Water | 34 |
Input Predictor Data Layers
A total of 33 predictor layers at 20-cm resolution (not included with this dataset) were derived from the airborne Lidar and RGBN imagery. Most layers fall into three general categories:
- Lidar-derived canopy metrics (e.g., sum and standard deviation of canopy heights),
- Lidar-derived topographic metrics (e.g., topographic position index, SAGA wetness index), and
- First-order imagery metrics (e.g., NDVI, percent red, standard deviation of hue).
Plus, Lidar return intensity (pulse amplitude) was also included which acts as a surface metric.
Additionally, there is one compound layer, shrub biomass, which was derived previously using Lidar canopy metrics and NDVI (Greaves et al., 2018, 2016).
Layers were retained that appeared important in preliminary models and had a Spearman correlation less than 0.95 at the reference plot locations. Once the layers were prepared, the values of all predictor layers at the location of each reference plot were extracted for model training and validation (Greaves et al., 2019, in process).
Table 4. Predictor layers (The predictor layers are not included with this dataset. See Greaves et al. (2019) for details and references.)
| Predictor type | Description |
|---|---|
| Compound | Estimated shrub biomass (Greaves et al., 2018, 2016) |
| Canopy | Standard deviation of canopy height within 1 m radius of pixel |
| Canopy | Sum of canopy height (equivalent to canopy volume) within 0.5 m radius |
| Canopy | Sum of canopy height within 1 m radius |
| Imagery | Deciduous shrub index (Kushida et al., 2015) smoothed over 0.5 m radius |
| Imagery | Deciduous shrub index smoothed over 1 m radius |
| Topographic | Standard deviation of terrain height within 1 m radius |
| Topographic | Absolute terrain height |
| Topographic | Heat load index (McCune and Keon, 2002) smoothed over 0.5 m |
| Imagery | Hue smoothed over 1 m radius |
| Imagery | Standard deviation of hue within 1 m radius |
| Surface | Mean raw intensity of Lidar pulse return within pixel |
| Surface | Raw intensity of Lidar pulse return smoothed over 1 m radius |
| Surface | Standard deviation of raw intensity of Lidar pulse return within 1 m |
| Imagery | NDVI smoothed over 0.5 m radius |
| Imagery | NDVI smoothed over 1 m radius |
| Imagery | Panchromatic (R + G + B) smoothed over 1 m radius |
| Imagery | Standard deviation of panchromatic within 1 m radius |
| Imagery | Percent blue (B/[R + G + B]) smoothed over 1 m radius |
| Imagery | Percent red (R/[R + G + B]) smoothed over 1 m radius |
| Topographic | Site name: Toolik Lake, Pipeline Ridge, or Imnavait Creek |
| Topographic | SAGA Wetness Index (Boehner et al., 2002) smoothed over 0.5 m |
| Topographic | SAGA Wetness Index smoothed over 1 m radius |
| Topographic | Topographic Position Index calculated at 5 m radius |
| Topographic | Topographic Position Index calculated at 10 m radius |
| Topographic | Topographic Position Index calculated at 25 m radius |
| Topographic | Topographic Position Index calculated at 50 m radius |
| Topographic | Topographic Position Index calculated at 100 m radius |
| Topographic | Topographic Position Index calculated at 250 m radius |
| Topographic | SAGA wind shelter (Plattner et al., 2004) smoothed over 0.5 m radius |
| Topographic | SAGA wind shelter smoothed over 1 m radius |
| Imagery | Excess greenness index (Richardson et al., 2007) smoothed over 0.5 m |
| Imagery | Excess greenness index smoothed over 0.5 m radius |
Random Forest Modeling
75% of the plots (n = 604) were used to build the Random Forest model. The model building was an iterative process: out-of-bag accuracy and confusion matrices from early models were used to determine which classes could not be differentiated, then collapsed input classes accordingly and retrained the model, seeking the best possible balance between accuracy and retention of informative classes (Greaves et al., 2019, in process).
Twenty-five percent of the reference data plots (selected proportionally from each class; n = 196 plots total) were withheld from model building to be used as a test dataset;
Mapping
The final Random Forest model was applied across the three data collection footprints using the AsciiGridPredict tool in the R package ‘yaImpute’ (Crookston and Finley, 2007). Once the initial maps were built, pixels in class patches smaller than 25 pixels (i.e., 1-m2) were replaced by the surrounding majority class; therefore, the minimum mapping area is 1-m2 per patch. Queen-related pixels (i.e., pixels touching only at one corner) were considered to be connected to each other, so these 1-m2 patches may not appear as cohesive blocks. Minor manual cleanup was performed to correct places where infrastructure had been classified as vegetation on the Toolik Field Station gravel pad. To evaluate the accuracy of the map, the final mapped class was extracted at each reference plot location for both training and withheld test plots and the overall accuracy (i.e., the proportion correct), balanced accuracy (i.e., the mean class-wise accuracy), Cohen’s kappa, and Cohen’s weighted kappa (Cohen, 1968) were determined (Greaves et al., 2019, in process).
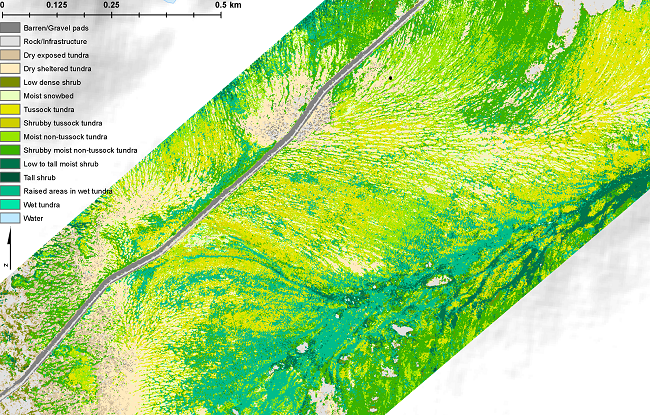
Figure 4. 1:6500 scale detail of an area within the Pipeline footprint (Greaves et al., 2019, in process).
Data Access
These data are available through the Oak Ridge National Laboratory (ORNL) Distributed Active Archive Center (DAAC).
High-Resolution Vegetation Community Maps, Toolik Lake Area, Alaska, 2013-2015
Contact for Data Center Access Information:
- E-mail: uso@daac.ornl.gov
- Telephone: +1 (865) 241-3952
References
Braun-Blanquet, J., 1965. Plant Sociology: The Study of Plant Communities. Hafner Publishing Company.
Cohen, J., 1968. Weighted Kappa: Nominal scale agreement with provision for scaled disagreement or partial credit. Psychol. Bull. 70, 213–220.
Crookston, N.L., Finley, A.O., 2007. yaImpute: An R Package for k-NN Imputation. J. Stat. Softw. 23, 1–16.
Greaves, H.E., J. Eitel, L.A. Vierling, N.T. Boelman, K.L. Griffin, T.S. Magney, and C.M. Prager. 2019. Airborne Lidar and multispectral imagery permit classification of heterogeneous Arctic tundra vegetation at 20 cm resolution (in process).
Greaves, H.E., L. Vierling, J. Eitel, N. Boelman, T. Magney, C. Prager, and K. Griffin. 2018. High-Resolution Shrub Biomass and Uncertainty Maps, Toolik Lake Area, Alaska, 2013. ORNL DAAC, Oak Ridge, Tennessee, USA. https://doi.org/10.3334/ORNLDAAC/1573
Greaves, H.E., Vierling, L. A., Eitel, J.U.H, Boelman, N.T., Magney, T.S., Prager, C.M., & Griffin, K.L. (2016). High-resolution Mapping of Aboveground Shrub Biomass in Arctic Tundra Using Airborne Lidar and Imagery. Remote sensing of environment,(184), 361-373. http://dx.doi.org/10.1016/j.rse.2016.07.026
Vierling, L.A., Eitel, J.U.H., Boelman, N.T., Griffin, K.L., Greaves, H., Magney, T.S., Prager, C., Ajayi, M., and Gibson, R. 2013a. Bare earth Lidar dataset for Toolik Field Station, AK, and nearby field sites along Dalton Highway. https://doi.org/10.7923/G4057CV5
Vierling, L.A., Eitel, J.U.H., Boelman, N.T., Griffin, K.L., Greaves, H., Magney, T.S., Prager, C., Ajayi, M., and Gibson, R. 2013b. Four-band, 5 cm Resolution Orthophotographs of Toolik Field Station, AK, and Nearby Field Sites Along Dalton Highway. http://dx.doi.org/10.7923/G4VD6WCW
Walker, M.D., Walker, D.A., Auerbach, N.A., 1994. Plant communities of a tussock tundra landscape in the Brooks Range foothills, Alaska. J. Veg. Sci. 5, 843–866. https://doi.org/10.2307/3236198