Documentation Revision Date: 2023-01-31
Dataset Version: 1
Summary
This dataset includes six files in comma-separated values (CSV) format.
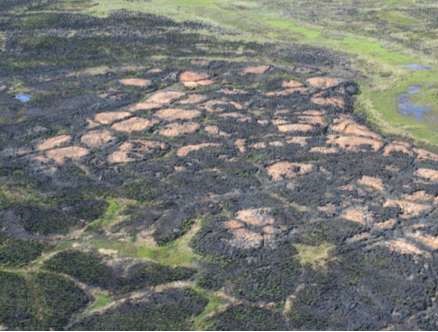
Figure 1: The 2007 Anaktuvuk River fire burned across riparian stringers and wet channels around high-centered polygons that are typically left as unburned inclusions. (2008 photo by D. Yokel). Source: Jandt et al., 2012.
Citation
Miller, E.A., R. Jandt, C.A. Baughman, B.M. Jones, and D.A. Yokel. 2022. ABoVE: Post-Fire and Unburned Field Site Data, Anaktuvuk River Fire Area, 2008-2017. ORNL DAAC, Oak Ridge, Tennessee, USA. https://doi.org/10.3334/ORNLDAAC/2119
Table of Contents
- Dataset Overview
- Data Characteristics
- Application and Derivation
- Quality Assessment
- Data Acquisition, Materials, and Methods
- Data Access
- References
Dataset Overview
This dataset includes field measurements from 26 burned and unburned transects established in 2008 in the region of the Anaktuvuk River tundra fire on the Arctic Slope of Alaska, US. Measurements include plant cover by species, shrub and tussock density, thaw depth, and soil depth. This wildfire occurred in 2007, and sampling took place in 2008-2011 and in 2017.
Project: Arctic-Boreal Vulnerability Experiment
The Arctic-Boreal Vulnerability Experiment (ABoVE) is a NASA Terrestrial Ecology Program field campaign being conducted in Alaska and western Canada, for 8 to 10 years, starting in 2015. Research for ABoVE links field-based, process-level studies with geospatial data products derived from airborne and satellite sensors, providing a foundation for improving the analysis, and modeling capabilities needed to understand and predict ecosystem responses to, and societal implications of, climate change in the Arctic and Boreal regions.
Related Publications
Jandt, R.R., E.A. Miller, D.A. Yokel, M.S. Bret-Harte, C.A. Kolden, and M.C. Mack. 2012. Findings of Anaktuvuk River Fire recovery study 2007-2011. Unpublished report to the Bureau of Land Management; Fairbanks, Alaska, USA. https://www.frames.gov/sites/default/files/AFSC/Anaktuvuk_River_Fire_Study_FINAL_6-21-12.pdf
Jandt, R.R., E.A. Miller, and B.M. Jones. 2021. Fire Effects 10 Years After the Anaktuvuk River Tundra Fires. BLM Alaska Technical Report #64. Bureau of Land Management; Anchorage, Alaska, USA.
https://www.blm.gov/sites/default/files/docs/2021-06/BLM_AK_TR_64.pdf
Acknowledgements
Funding and logistical support for this project was provided by federal and state agencies including: Bureau of Land Management, National Science Foundation, U.S. Fish and Wildlife Service, U.S. Forest Service, and Alaska Department of Natural Resources.
Data Characteristics
Spatial Coverage: Arctic Slope of Alaska, U.S.
ABoVE Reference Locations
Domain: Core Region
State/Territory: Alaska
Grid cells: Ah001v000, Bh008v002, Bh008v003, Ch048v017, Ch048v018, Ch048v019, Ch049v017, Ch049v018, Ch049v019
Spatial Resolution: Measurements compiled along 50-m transects
Temporal Coverage: 2008-07-03 to 2017-07-23
Temporal Resolution: Annual measurements 2008 to 2011 and in 2017
Study Area:
Latitude and longitude are given in decimal degrees.
| Site | Westernmost Longitude | Easternmost Longitude | Northernmost Latitude | Southernmost Latitude |
|---|---|---|---|---|
| Arctic Slope of Alaska, U.S. | -151.177 | -150.030 | 69.360 | 69.018 |
Data File Information
This dataset includes six files in comma-separated values (CSV) format.
Missing data are denoted by the value -9999 in numeric fields and "NA" for text fields.
Table 1. Variables in BLM_Anaktuvuk_events.csv.
| Variables | Units | Description |
|---|---|---|
| id | 1 | Record ID number |
| foreignID | 1 | Field to link to records in BLM_Anaktuvuk_point_intercept.csv, BLM_Anaktuvuk_shrub_density.csv, BLM_Anaktuvuk_soils.csv, and BLM_Anaktuvuk_tussock_counts.csv |
| Transect | Transect label | |
| Date | YYYY-MM-DD hh:mm:ss | Date of sampling |
| Staff1, ..., Staff5 | Person(s) involved in data collection. | |
| pH_mean_organic | pH | Mean of pH for samples of soils above the organic-mineral interface along transect |
| pH_mean_mineral | pH | Mean of pH for samples of soils below the organic-mineral interface along transect |
| Notes | Notes regarding field data collection or site conditions |
Table 2. Variables in BLM_Anaktuvuk_point_intercept.csv.
| Variables | Units | Description |
|---|---|---|
| id | 1 | Record ID number |
| foreignID | 1 | Field to link to records in BLM_Anaktuvuk_events.csv |
| Transect | Transect label | |
| Date | YYYY-MM-DD hh:mm:ss | Date of sampling |
| Point | 1 | Point label |
| Tallest | binary | Binary indicator (1 = "yes") of tallest species present. This field was used for ground-truthing remotely sensed imagery. |
| NRCS_Code | Species code from the United States Department of Agriculture Natural Resources Conservation Service PLANTS database (https://plants.sc.egov.usda.gov) | |
| Genus | Genus | |
| Species | Species | |
| Note | Notes regarding field data collection or site conditions |
Table 3. Variables in BLM_Anaktuvuk_shrub_density.csv.
| Variables | Units | Description |
|---|---|---|
| id | 1 | Record ID number |
| foreignID | 1 | Field to link to records in BLM_Anaktuvuk_events.csv |
| Transect | Transect label | |
| Date | YYYY-MM-DD hh:mm:ss | Date of sampling |
| Quadrat | 1 | Quadrat label |
| NRCS_Code | Species code from the United States Department of Agriculture Natural Resources Conservation Service PLANTS database (https://plants.sc.egov.usda.gov) | |
| Genus | Genus | |
| Species | Species | |
| HeightClass | 1 | Height classes: 1 = <20 cm, 2 = 20-150 cm, 3 = >150 cm |
| LifeStage | Stages: Mature, Resprout, Seedling. This field is most relevant to the first sampling (2008) when vegetation colonized by seed or resprouted from underground structures. | |
| Dead | binary | Binary: whether shrub is dead: 0 = "no", 1 = "yes" |
| Count | 1 | Count of individual shrubs |
| Notes | Notes regarding field data collection or site conditions |
Table 4. Variables in BLM_Anaktuvuk_sites.csv.
| Variables | Units | Description |
|---|---|---|
| Transect information | ||
| id | 1 | Record ID number |
| Unit | "BLM" | |
| Transect | Transect label: Labels beginning with "B" indicate burned area. Labels beginning with "U" indicate unburned area. | |
| Transect_Type | "Burned" or "Unburned" | |
| LatitudeOrigin | degrees_north | Latitude coordinate for transect origin stake (0 m mark) |
| LongitudeOrigin | degrees_east | Longitude coordinate for transect origin stake (0 m mark) |
| TransectAzimuth | degrees | The azimuth of the transect, normally 90 degrees, with 21 degrees declination to east. |
| TransectDeclination | degrees | Declination from geographic north, normally 21 degrees east. |
| Elevation | m | Transect elevation |
| LatitudeEnd | degrees_north | Latitude coordinate for transect end stake (50 m mark) |
| LongitudeEnd | degrees_east | Longitude coordinate for transect end stake (50 m mark) |
| LatitudeCBI | degrees_north | Latitude coordinate for the Composite Burn Index plot center |
| LongitudeCBI | degrees_east | Longitude coordinate for the Composite Burn Index plot center |
| AspectCBI | Aspect of the Composite Burn Index plot center | |
| ElevationCBI | m | Elevation of the Composite Burn Index plot center |
| PercentBurned30mRadius | percent | Percent of the Composite Burn Index plot, within 30 m of plot center, that burned |
| Variables recorded on the Composite Burn Index (CBI) field datasheet Values of 0 to 3.0 are CBI rating factor scores as defined on field datasheet. Values >3 are observed values in the units listed. Refer to Appendix B, pp 30-31 in Jandt et al. (2012) for details. |
||
| SubstratePreFireCoverLitter | percent | Percent cover estimates |
| SubstratePreFireCoverDuff | percent | |
| SubstratePreFireCoverSoilRock | percent | |
| SubstratePreFireCoverTussocks | percent | |
| DepthPreFireLitter | inches | Substrate depth estimates |
| DepthPreFireDuff | inches | |
| DepthPreFireFuelBed | inches | |
| SubstrateLitterDeadGrass1HrConsumed | percent | Substrates affected or consumed by fire |
| SubstrateDuff | percent | |
| SubstrateMediumWoodyTussockBasalArea | percent | |
| SubstrateExposedMineral | percent | |
| GroundLayerPreFireCoverHerbGram | percent | Estimates of pre-fire cover |
| GroundLayerPreFireCoverMossLichen | percent | |
| GroundLayerPreFireCoverShrub | percent | |
| GroundLayerMossLichen | percent | Fire effects on ground-level vegetation |
| GroundLayerFoliageAltered | percent | |
| GroundLayerFrequencyLiving | percent | |
| GroundLayerColonizers | percent | |
| GroundLayerCompositionAbundance | percent | |
| UpperLayerPreFireCover | percent | Fire effects on vegetation above ground level |
| UpperLayerFoliageAltered | percent | |
| UpperLayerFrequencyLiving | percent | |
| UpperLayerColonizers | percent | |
| UpperLayerCompositionAbundance | percent | |
| CBIMemo | Notes on the Composite Burn Index plot | |
| Additional information about transect | ||
| Aspect | degrees | Terrain aspect at transect |
| Slope | percent | Terrain slope at transect |
| dNBR_Class_Value | 1 | Differenced Normalized Burn Ratio class and pixel values. See Kolden (2010) and Jandt et al. (2012). |
| dNBR_Pixel_Value | 1 | |
| BurnDateEnd | YYYY-MM-DD hh:mm:ss | Estimated earliest date and time the transect burned |
| BurnDateBegin | YYYY-MM-DD hh:mm:ss | Estimated latest date and time the transect burned |
| Polygons | Denotes whether transect includes permafrost polygons: "HCP" = high center polygon, "LCP" = low center polygon, "None" = no polygons, or "Other" = other conditions. | |
| Memo | Notes about transect characteristics | |
Table 5. Variables in BLM_Anaktuvuk_soils.csv.
| Variables | Units | Description |
|---|---|---|
| id | 1 | Record ID number |
| foreignID | 1 | Field to link to records in BLM_Anaktuvuk_events.csv |
| Transect | Transect label | |
| Date | YYYY-MM-DD hh:mm:ss | Date of sampling |
| Point | 1 | Point along transect |
| ThawDepth | cm | Observed thaw depth |
| Rock | binary | Binary: "1" if soil probe hit rock instead of frozen soil |
| OrganicDepth | cm | Depth of whole organic layer |
| OrganicDepthIce | binary | Binary: "1" = whole organic layer could not be measured due to frozen soil |
| Comment | Notes on soil sampling or conditions |
Table 6. Variables in BLM_Anaktuvuk_tussock_counts.csv.
| Variables | Units | Description |
|---|---|---|
| id | 1 | Record ID number |
| foreignID | 1 | Field to link to records in BLM_Anaktuvuk_events.csv |
| Transect | Transect label | |
| Date | YYYY-MM-DD hh:mm:ss | Date of sampling |
| Quadrat | 1 | Quadrat label |
| Species | Species code: "ERIVAG" = Eriophorum vaginatum, "CARBIG" = Carex bigelowii, "UNKNOWN" = other graminoid species | |
| Count | 1 | Number of tussocks in 1-m2 quadrat |
| Dead | binary | Binary: whether tussock were dead: 0 = "no", 1 = "yes" |
| Notes | Notes on sampling or conditions |
Application and Derivation
These data provide information on the impacts of fire on tundra ecosystems and recovery after fire disturbance.
Quality Assessment
None provided.
Data Acquisition, Materials, and Methods
In 2007, the Anaktuvuk River Fire burned tundra ecosystems on the Arctic Slope in northern Alaska. This fire's extent and severity was substantially higher than other recorded fires in this region. An interdisciplinary team assessed fire effects, including burn severity, potential plant community shifts, and effects on permafrost and active layers. Field sampling took place in 2008-2011 and in 2017.
A set of 26 burned and unburned transects were established in 2008 to span the range of vegetation types and burn severities. The transects were 50 m long, oriented west (origin) to east (terminus). Measures of plant cover by species, shrub and tussock density were collected every 0.5 m (n=100 per transect). Observers measured cover of substrate or vegetation at 100 points along each transect using a point-sighting device and evaluated shrub and tussock density in ten 1-m2 frames along the transect. Percent cover was calculated as the sum of all hits of a species along the 50-m transect, disregarding multiple hits on the same species at one point. Soil depth and active layer thickness (thaw depth) were measured every 2.5 m (n=20) along a transect parallel to that used for vegetation sampling. Five soil cores were collected for each transect to chemical characteristics of the organic and mineral soil horizons.
To map burn severity and extent, the Differenced Normalized Burn Ratio class (dNBR) (Key and Benson, 2006) was measured from Landsat 5 TM on 2008-06-14. The Normalized Burn Ratio (NBR) is calculated from a single, atmospherically corrected, post-fire image as:
NBR = (B4 – B7) / (B4 + B7) * 1000, where B represents different bandwidths detected. Field observations of fire impacts on vegetation were gathered in plots associated with the transects to compute a modified Composite Burn Index (CBI (Key and Benson, 2006). The CBI was used to calibrate the dNBR metrics (Kolden, 2010). These circular CBI plots had a 30-m radius and were centered on the starting point (origin) of each transect. An overall burn severity rating is derived from an average of ratings for assessments in three fuel layers: substrate, low vegetation, and tall shrubs.
See Jandt et al. (2012) and Jandt et al. (2021) for further details about the field methods and findings of this study.
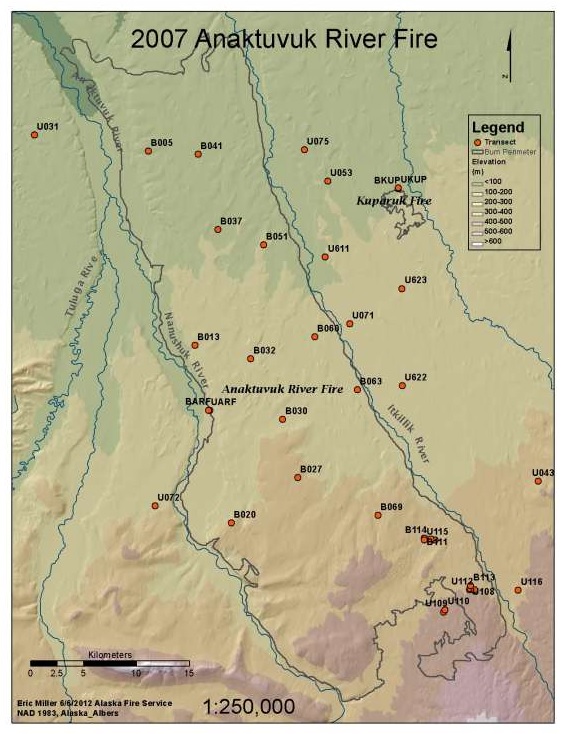
Figure 2: Locations of permanent transects established in to monitor ecosystem impacts of the 2007 Anaktuvuk River Fire. The study area is on the Arctic Slope of northern Alaska (latitude 69.05, longitude -150.84). Labels indicate burn status of each transect by first letter: "B" = burned, "U" = unburned reference. Source: Jandt et al., 2012.
Data Access
These data are available through the Oak Ridge National Laboratory (ORNL) Distributed Active Archive Center (DAAC).
ABoVE: Post-Fire and Unburned Field Site Data, Anaktuvuk River Fire Area, 2008-2017
Contact for Data Center Access Information:
- E-mail: uso@daac.ornl.gov
- Telephone: +1 (865) 241-3952
References
Key, C.H., and N.C. Benson. 2006. Landscape assessment: ground measure of severity, the composite burn index, and remote sensing of severity, the normalized burn ratio. In D.C. Lutes, R.E. Keane, J.F. Caratti, C.H. Key, N.C. Benson, S. Sutherland, and L.J. Gangi (eds.). FIREMON: Fire Effects Monitoring and Inventory System. General Technical Report RMRS-GTR-164-CD: LA1–LA51. USDA Forest Service, Rocky Mountain Research Station; Ogden, Utah, U.S. https://www.fs.usda.gov/rm/pubs_series/rmrs/gtr/rmrs_gtr164.pdf
Kolden, C.A. 2010. Characterizing Alaskan wildfire regimes through remotely sensed data: assessment of large area pattern and trend. Dissertation, Clark University, Worcester, Massachusetts. http://www.pyrogeographer.com/uploads/1/6/4/8/16481944/crystal_kolden_dissertation.pdf
Jandt, R.R., E.A. Miller, D.A. Yokel, M.S. Bret-Harte, C.A. Kolden, and M.C. Mack. 2012. Findings of Anaktuvuk River Fire recovery study 2007-2011. Unpublished report to the Bureau of Land Management; Fairbanks, Alaska, USA. https://www.frames.gov/sites/default/files/AFSC/Anaktuvuk_River_Fire_Study_FINAL_6-21-12.pdf
Jandt, R.R., E.A. Miller, and B.M. Jones. 2021. Fire Effects 10 Years After the Anaktuvuk River Tundra Fires. BLM Alaska Technical Report #64. Bureau of Land Management; Anchorage, Alaska, USA.
https://www.blm.gov/sites/default/files/docs/2021-06/BLM_AK_TR_64.pdf