Documentation Revision Date: 2021-09-17
Dataset Version: 1
Summary
There are 127 data files; 1 in comma-separated values (*.csv) format and 126 in GeoTIFF (*.tif) format.
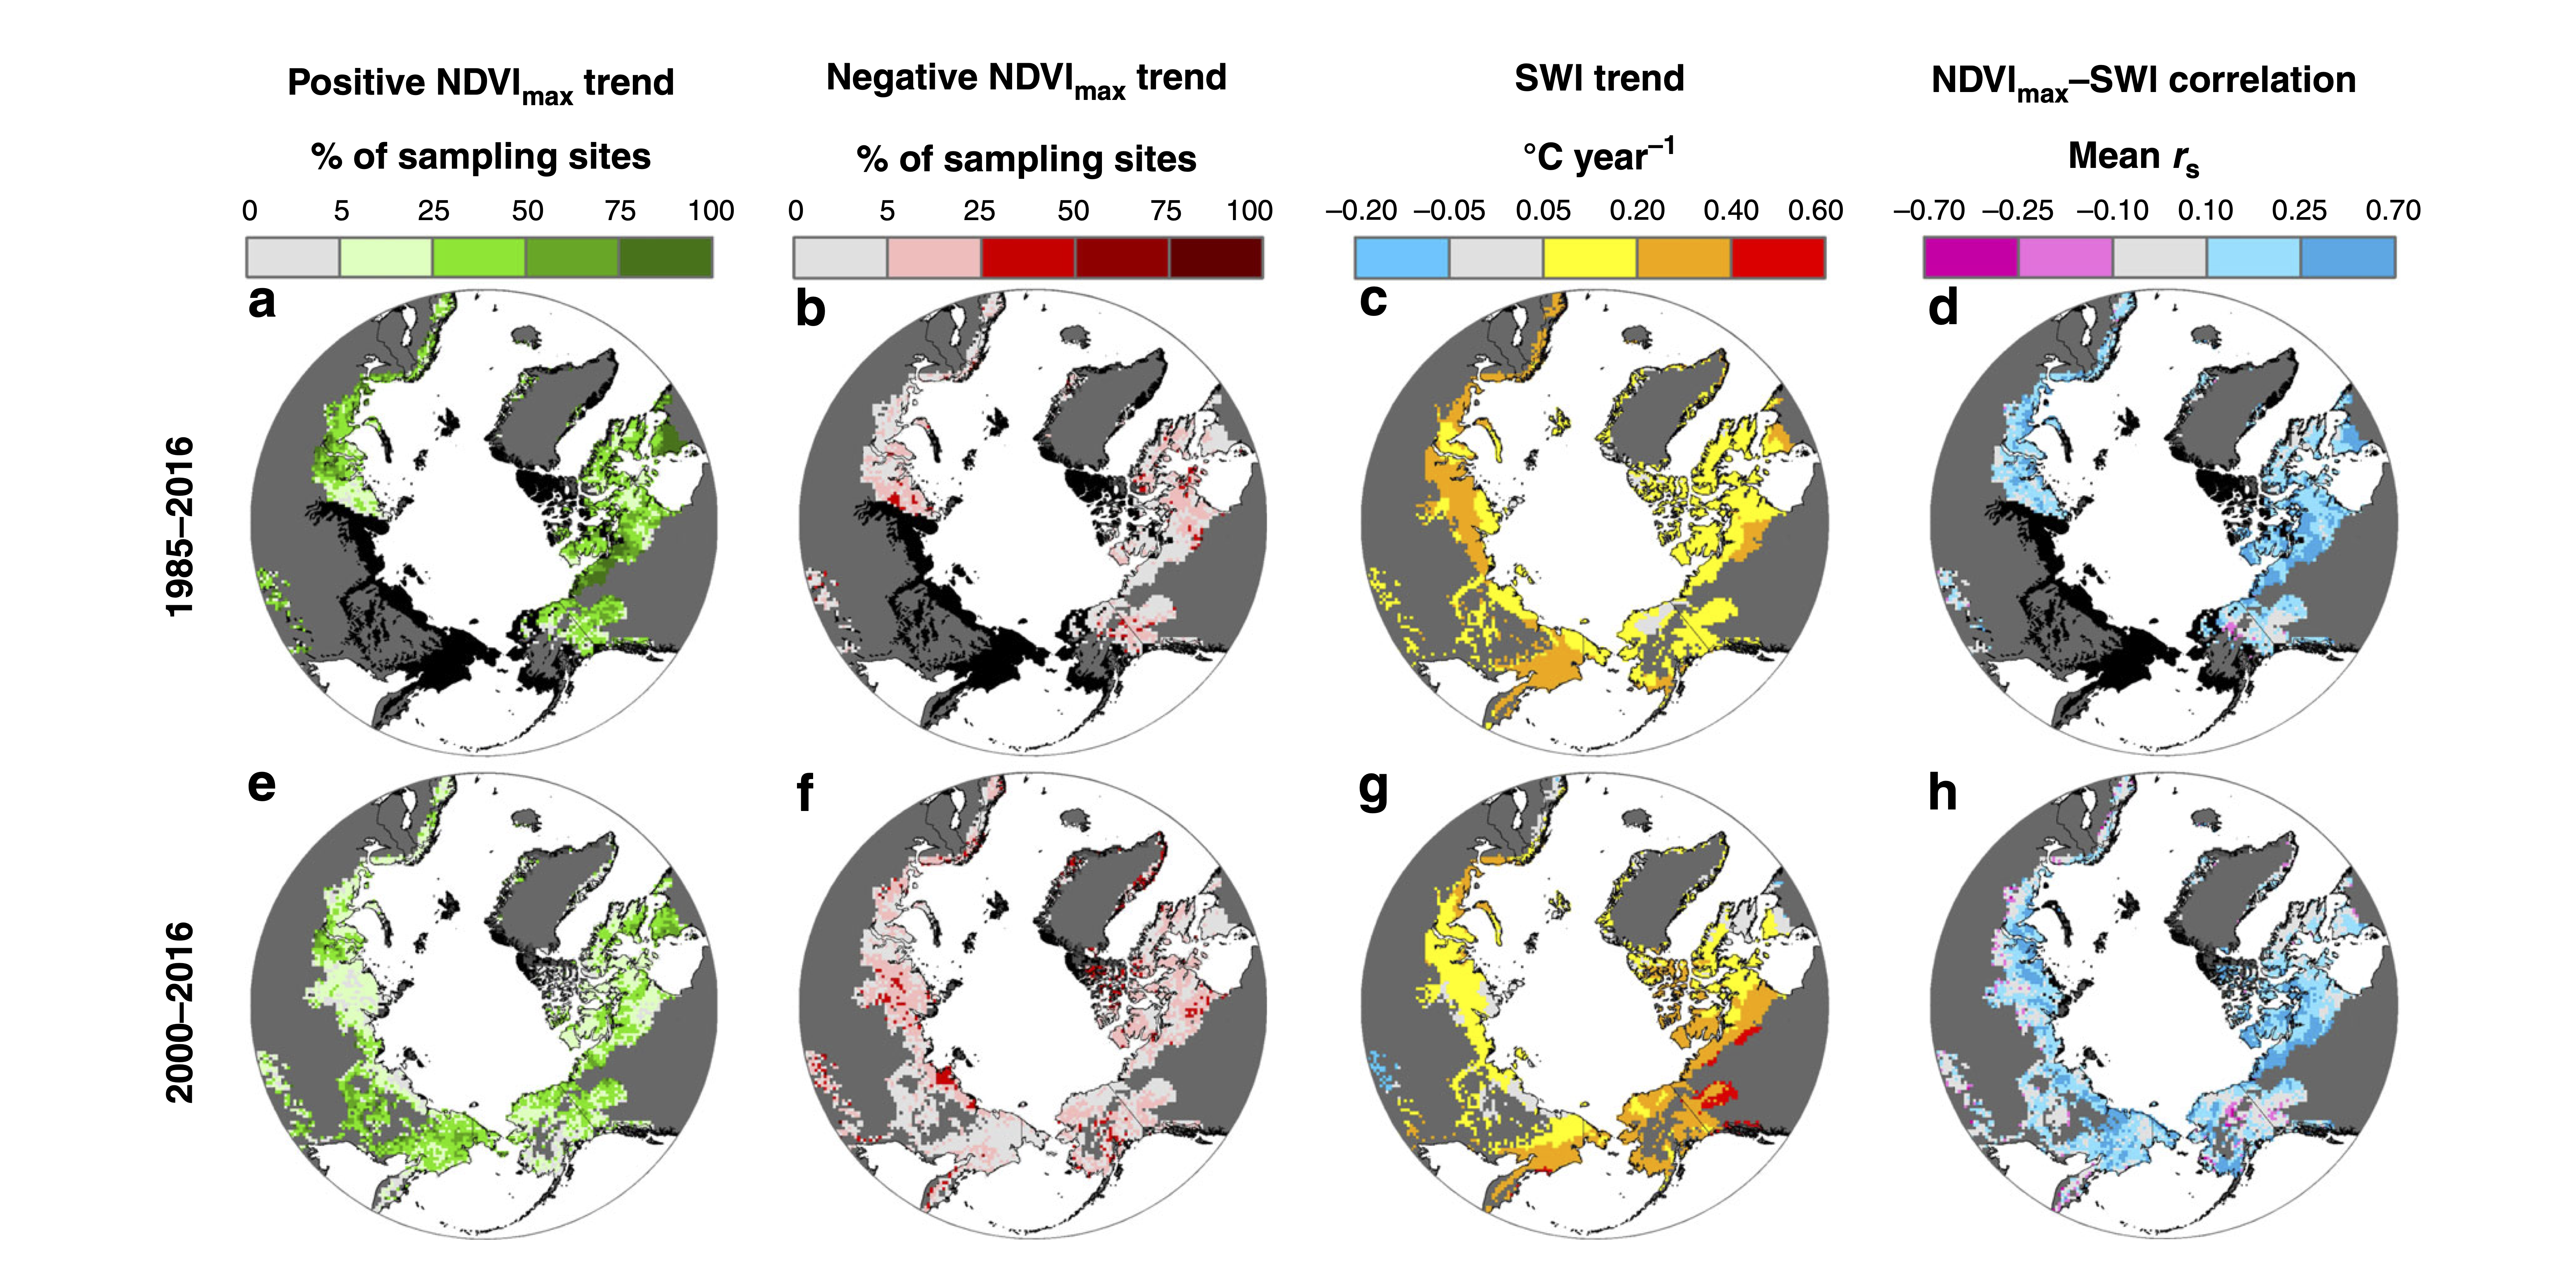
Figure 1. Tundra greenness and summer air temperature trends and correlations across the Arctic. Top panels (a-d) depict Landsat annual maximum Normalized Difference Vegetation Index (NDVImax) trends, summer warmth index (SWI) trends derived using an ensemble of five temperature datasets, and mean Spearman's correlation (rs) between annual NDVImax and SWI among sites from 1985 to 2016, while bottom panels (e-h) depict trends and correlations from 2000 to 2016. Areas that are barren or lacked adequate Landsat data for trend and correlation assessments are shown in black. Source: Berner et al., (2020)
Citation
Berner, L.T., R. Massey, and S.J. Goetz. 2021. ABoVE: Landsat Tundra Greenness and Summer Air Temperatures, Arctic Tundra, 1985-2016. ORNL DAAC, Oak Ridge, Tennessee, USA. https://doi.org/10.3334/ORNLDAAC/1893
Table of Contents
- Dataset Overview
- Data Characteristics
- Application and Derivation
- Quality Assessment
- Data Acquisition, Materials, and Methods
- Data Access
- References
Dataset Overview
This dataset provides annual tundra greenness and summer air temperatures at a resolution of 50 km over the pan-Arctic tundra biome above 31.5 degrees over the time period 1985 to 2016. Annual tundra greenness was assessed using the maximum Normalized Difference Vegetation Index (NDVImax) derived from surface reflectance measured by sensors on the Landsat satellites. Summer air temperatures were quantified using the Summer Warmth Index (SWI) derived from an ensemble of five global temperature datasets. Tabular data include NDVImax, SWI, and estimates of uncertainty using Monte Carlo simulations at 45,334 vegetated sampling sites. Raster data provide (1) annual SWI from 1985 to 2016; (2) temporal trends in annual NDVImax and SWI from 1985 to 2016 and from 2000 to 2016; and (3) temporal correlations between annual NDVImax - SWI during these two periods. Each raster also includes estimates of uncertainty that were generated using Monte Carlo simulations. This dataset provides a new pan-Arctic product for assessing inter-annual variability in tundra using moderate resolution observations from the Landsat satellites.
Project: Arctic-Boreal Vulnerability Experiment
The Arctic-Boreal Vulnerability Experiment (ABoVE) is a NASA Terrestrial Ecology Program field campaign being conducted in Alaska and western Canada, for 8 to 10 years, starting in 2015. Research for ABoVE links field-based, process-level studies with geospatial data products derived from airborne and satellite sensors, providing a foundation for improving the analysis, and modeling capabilities needed to understand and predict ecosystem responses to, and societal implications of, climate change in the Arctic and Boreal regions.
Related Publication
Berner, L.T., R. Massey, P. Jantz, B.C. Forbes, M. Macias-Fauria, I.H. Myers-Smith, T. Kumpula, G. Gauthier, L. Andreu-Hayles, B. Gaglioti, P.J. Burns, P. Zetterberg, R. D'Arrigo, and S.J. Goetz. 2020. Summer warming explains widespread but not uniform greening in the Arctic tundra biome. Nature Communications 11:4621. https://doi.org/10.1038/s41467-020-18479-5
Acknowledgments
This work was supported by NASA's Arctic Boreal Vulnerability Experiment (grants NNX17AE44G and 80NSSC19M0112), NASA Carbon Cycle Science (grant NNX17AE13G), and National Science Foundation Arctic Natural Sciences (grant 1661723).
Data Characteristics
Spatial Coverage: Circumpolar arctic tundra biome above 31.5 degrees
Spatial Resolution: 50 km
Temporal Coverage: 1985 to 2016 or 2000 to 2016
Temporal Resolution: Annual
Study Area: Latitude and longitude are given in decimal degrees.
| Site | Northernmost Latitude | Southernmost Latitude | Easternmost Longitude | Westernmost Longitude |
|---|---|---|---|---|
| Arctic Tundra | 90 | 31.5 | 180 | -180 |
Data File Information
There are 127 data files; 1 in comma-separated values (*.csv) format and 126 in GeoTIFF (*.tif) format. The naming convention for the GeoTiff files provided in Table 1, where
<variable> is either "greening" or "browning",
<period> is either "1985to2016" or "2000to2016",
<year> is a four-digit year between 1985 and 2016, and
<probability> is either "p025", "p050", or "p975".
Table 1. File names and descriptions.
| File Names | Description |
|---|---|
| arctic_lsat_ndvi_swi_sites.csv | Site-level information on annual maximum Normalized Difference Vegetation Index (NDVImax) and Summer Warmth Index (SWI). Each metric includes a best-estimate (50th percentile) as well as lower bound (2.5th percentile) and upper bound (97.5th percentile) of a 95% confidence interval derived from Monte Carlo simulations. |
| arctic_lsat_ndvi_pcnt_<variable>_<period>_<probability>.tif | The percentage of vegetated sampling sites in each grid cell that had a significant (α = 0.10) positive (greening) or negative (browning) NDVImax trend from 1985 to 2016 and 2000 to 2016. Trend significance was assessed using nonparametric Mann-Kendall trend tests after accounting for temporal autocorrelation. The estimated prevalence of greening or browning in each grid cell is accompanied by a 95% confidence interval derived from 103Monte Carlo simulations. |
| arctic_lsat_ndvi_swi_cor_<period>_<probability>.tif | Landsat NDVImax – SWI correlation: The mean Spearman correlation coefficient (rs) between annual NDVImax and SWI from 1985 to 2016 and 2000 to 2016 among vegetated sampling sites within each grid cell. Each correlation is accompanied by a 95% confidence interval derived from 103 Monte Carlo simulations. |
| arctic_lsat_site_cnt_<period>_<probability>.tif | Landsat NDVImax sampling site count: The number of vegetated sampling sites within each grid cell for the periods 1985 to 2016 and 2000 to 2016. These sampling sites were used when determining NDVImax trends and NDVImax – SWI correlations. |
| arctic_swi_<year>_<probability>.tif | SWI time series: The annual SWI from 1985 to 2016 for each grid cell. Each year includes a 95% confidence interval derived from 103Monte Carlo simulations. |
| arctic_swi_trend_<year>_<probability>.tif | SWI trend: The annual rate of change in SWI from 1985 to 2016 and 2000 to 2016 for each grid cell. These trends were derived using an ensemble of five temperature data sets and nonparametric Theil-Sen slope estimators. Each trend is accompanied by a 95% confidence interval derived from 103Monte Carlo simulations. |
Data File Details
For all data files, the uncertainty metric (e.g., identified as <probability> in the GeoTIFF file names) is the percentile of all Monte Carlo simulations. The best estimate was taken as the 50th percentile, lower bound as the 2.5th percentile, and upper bound as the 97.5th percentile.
For the CSV file,
- Missing values are represented by "-9999" for numeric columns and "NA" for character columns.
- There are 45,334 unique sites and each site has 32 rows corresponding to the number of years in the period 1985-2016.
- The CRS is "WGS84 - World Geodetic System 1984" (EPSG:4326).
For all GeoTIFF files,
- Missing values are represented by "-3.4E+38".
- There are 176 rows and 176 columns.
- The CRS is "WGS 84 / North Pole Lambert Azimuthal Equal Area (LAEA) Bering Sea" (EPSG:3571).
Table 2. Variable names and descriptions in the file arctic_landsat_ndvi_swi_site_data.csv.
| Variable Name | Units | Description |
|---|---|---|
| site | Unique alphanumeric identifier for each sampling site | |
| year | year | Year of data collection |
| latitude | decimal degrees | Latitude in decimal degrees using WGS84 |
| longitude | decimal degrees | Longitude in decimal degrees using WGS84 |
| n.obs.p025 | Number of observations used to estimate NDVImax (2.5th percentile) | |
| n.obs.p500 | Number of observations used to estimate NDVImax (50th percentile) | |
| n.obs.p975 | Number of observations used to estimate NDVImax (97.5th percentile) | |
| ndvi.max.p025 | unitless | Annual NDVImax (2.5th percentile) |
| ndvi.max.p500 | unitless | Annual NDVImax (50th percentile) |
| ndvi.max.p975 | unitless | Annual NDVImax (97.5th percentile) |
| swi.p025 | °C | Annual SWI (2.5th percentile) |
| swi.p500 | °C | Annual SWI (50th percentile) |
| swi.p975 | °C | Annual SWI (97.5th percentile) |
Application and Derivation
This dataset provides a new pan-Arctic assessment of inter-annual variability in tundra using moderate resolution observations from the Landsat satellites. See Berner et al., (2020) for details.
Quality Assessment
The Landsat observations were rigorously screened and cross-calibrated and then annual NDVImax was ascertained using phenological modeling. Estimates of annual Landsat NDVImax were then compared against spatial and temporal variability in plant productivity measured at field sites around the Arctic. Landsat NDVImax was positively correlated with graminoid aboveground net primary productivity from 1990 to 2017 at a long-term monitoring site on Bylot Island in northern Canada (rs = 0.68 [0.55, 0.78]). Furthermore, Landsat NDVImax exhibited correlations (rs) with annual shrub growth that ranged from -0.12 [-0.33, 0.04] to 0.84 [0.72, 0.93] with a median rs of 0.42 [0.34, 0.50] among 22 shrub chronologies from six Arctic countries. Lastly, spatial variability in mean annual Landsat NDVImax was positively correlated with mean annual gross primary productivity measured at 11 flux tower sites across the Arctic (rs = 0.72 [0.54, 0.88]). Numbers in brackets represent 95% confidence intervals derived from Monte Carlo simulations. These comparisons illustrate that Landsat NDVImax was associated with metrics of graminoid, shrub, and ecosystem productivity either through time or across tundra ecosystems.
Known Problems that Limit Use
Landsat satellite data sufficient for time series analysis were available for about 64% and 96% of the Arctic from 1985 to 2016 and 2000 to 2016, respectively. Prior to about the year 2000, there were data gaps across much of the eastern Eurasian Arctic and Alaska, as well as portions of northern Canada and western Greenland. Data gaps in these regions prevented assessment of NDVImax trends and NDVImax – SWI correlations from 1985 to 2016, but trends and correlations were assessed for these regions from 2000 to 2016. See Berner et al., (2020) for details.
Data Acquisition, Materials, and Methods
Following is a synopsis of the data processing that was performed to derive these products as described in Berner et al., (2020).
Annual maximum Normalized Difference Vegetation Index (NDVImax)
Time series of annual NDVImax were generated using Landsat satellite observations for vegetated sampling sites across the Arctic tundra using measurements of surface reflectance from the Landsat satellites. The sampling sites were randomly selected from vegetated areas in the Arctic tundra biome, as defined by Virtanen et al. (2016). Google Earth Engine was used to extract Landsat 5, 7, and 8 surface reflectance measurements (Landsat Collection 1, USGS EROS, 2017) acquired from June through August from 1984 to 2016 (Julian Days 152 to 243) for a 50 m window around each sampling site. After data screening (see Berner et al., (2020) for details), there were adequate measurements for time series analysis at 45,334 sampling sites. The NDVI was computed for each measurement and further cross-calibrated among sensors using a new approach based on random forest machine learning. Next, annual NDVImax was estimated using an iterative, phenology-based modeling approach. Importantly, estimates of annual NDVImax are sensitive to multiple sources of uncertainty including sensor radiometric calibration (±3-7%), systematic differences in NDVI among sensors, and the availability and seasonal timing of measurements. Consequently, uncertainty in annual NDVImax was estimated using Monte Carlo simulations (n=1,000) to randomly permute red and near-infrared reflectance and parameters used when cross-calibrating NDVI and modeling seasonal phenology.
Temporal trends in annual NDVImax during recent decades were assessed using measurements from sampling sites that excluded those that were barren (mean NDVImax<0.10) or had short measurement records (<10 years). Each site was evaluated for the presence of a monotonic trend from 1985 to 2016 and 2000 to 2016 using a rank-based Mann-Kendall trend test implemented using the zyp package in R. Sites with a positive NDVImax trend (α=0.10) were classified as "greening," while sites with a negative NDVImax trend (α=0.10) were classified as "browning." The percentage of sampling sites that greened or browned was then determined for each 50 km grid cell. These trends were assessed using each of the 103 Monte Carlo simulations of annual NDVImax at every sampling site, making it possible to derive the 50th percentile and 95% confidence intervals of all simulations.
Annual Summer Warmth Index (SWI)
Annual SWI, a widely used metric of cumulative summer heat load in the Arctic, was derived from an ensemble of five temperature datasets that were generated by NASA GISS (GISTEMP Team, 2019), Berkeley Earth (Rohde et al., 2013), University of Delaware (Willmott & Matsuura, 2018), University of East Anglia Climate Research Unit (Harris et al., 2014), and University of York (Cowtan & Way, 2014). Each temperature dataset was clipped to the Arctic domain and projected to Lambert Azimuthal Equal Area on a 50 km grid using bilinear interpolation. A common mask was derived and applied so that only grid cells with non-missing data from every dataset were kept. Annual SWI was then computed as the sum of monthly mean air temperatures exceeding 0°C. These data were then used to generate 103 synthetic domain-wide rasters of SWI for each year from 1985 to 2016. For each grid cell of every synthetic raster, a value for SWI was assigned that was randomly selected from the corresponding grid cell of one of the five temperature datasets. Consequently, each synthetic raster was built using a randomized assortment of grid cell values from the five temperature datasets. Each temperature dataset was constructed using different collections of climate station observations and analytical techniques, thus temporal trends in SWI and correlations between SWI and NDVImax are influenced by the specific temperature dataset used in the analysis. Time series of annual SWI were generated for the Arctic tundra biome from 1985 to 2016 at 50 km resolution using monthly mean air temperature from five global gridded climate datasets.
These data were then used to assess temporal trends in SWI as well as temporal correlation between NDVImax and SWI. The change in SWI per year (°C yr-1) was assessed from 1985 to 2016 and 2000 to 2016 for each 50 km grid cell across the study domain using Theil-Sen slopes evaluated in a Monte Carlo uncertainty framework. The NDVImax – SWI correlations were evaluated at each sampling site during these two periods using Spearman’s correlations and then the mean correlation coefficient (rs) was computed among sites within each 50 km grid cell. The correlations were also computed in using a Monte Carlo uncertainty framework.
The repository https://github.com/logan-berner/arctic_greening includes all of the scripts developed for analyses included in Berner et al. (2020).
Data Access
These data are available through the Oak Ridge National Laboratory (ORNL) Distributed Active Archive Center (DAAC).
ABoVE: Landsat Tundra Greenness and Summer Air Temperatures, Arctic Tundra, 1985-2016
Contact for Data Center Access Information:
- E-mail: uso@daac.ornl.gov
- Telephone: +1 (865) 241-3952
References
Berner, L.T., R. Massey, P. Jantz, B.C. Forbes, M. Macias-Fauria, I.H. Myers-Smith, T. Kumpula, G. Gauthier, L. Andreu-Hayles, B. Gaglioti, P.J. Burns, P. Zetterberg, R. D'Arrigo, and S.J. Goetz. 2020. Summer warming explains widespread but not uniform greening in the Arctic tundra biome. Nature Communications 11:4621. https://doi.org/10.1038/s41467-020-18479-5
Cowtan, K., and R.G. Way. 2014. Coverage bias in the HadCRUT4 temperature series and its impact on recent temperature trends. Quarterly Journal of the Royal Meteorological Society 140:1935–1944. https://doi.org/10.1002/qj.2297
GISTEMP Team. 2019. GISS Surface Temperature Analysis (GISTEMP): NASA Goddard Institute for Space Studies, https://data.giss.nasa.gov/gistemp/
Harris, I., P.D. Jones, T.J. Osborn, and D.H. Lister. 2013. Updated high-resolution grids of monthly climatic observations - the CRU TS3.10 Dataset. International Journal of Climatology 34:623–642. https://doi.org/10.1002/joc.3711
Muller, R.A., R. Rohde, R. Jacobsen, E. Muller, and C. Wickham. 2013. A New Estimate of the Average Earth Surface Land Temperature Spanning 1753 to 2011. Geoinformatics & Geostatistics: An Overview 01. https://doi.org/10.4172/2327-4581.1000101
USGS EROS. 2017. Landsat Collection 1 Level 1 Product Definition; USGS: Sioux Falls, SD, USA.
Virtanen, R., L. Oksanen, T. Oksanen, J. Cohen, B.C. Forbes, B. Johansen, J. Käyhkö, J. Olofsson, J. Pulliainen, and H. Tømmervik. 2015. Where do the treeless tundra areas of northern highlands fit in the global biome system: toward an ecologically natural subdivision of the tundra biome. Ecology and Evolution 6:143–158. https://doi.org/10.1002/ece3.1837
Willmott, C.J., and K. Matsuura. 2018. Terrestrial Air Temperature and Precipitation: Monthly Time Series (1900-2017) v. 5.01: University of Deleware. http://climate.geog.udel.edu/~climate