Documentation Revision Date: 2022-05-01
Dataset Version: 1
Summary
The Patch plots represent nearly pure species cover types located in a region of moist acidic coastal tundra with high-centered polygons. In 2001, the focus was on describing variability within general plant functional type groups: vascular plants, mosses, and lichens. In 2002, the focus was on describing variability within the microtopography of the area. The ITEX plots were located in two physiognomically similar areas with contrasting moisture regimes: frequently inundated wet meadow and well-drained dry heath communities.
There are seven files in comma-separated value (*.csv) format and a folder (*.zip) with 245 plot and instrumentation photos included in this dataset.
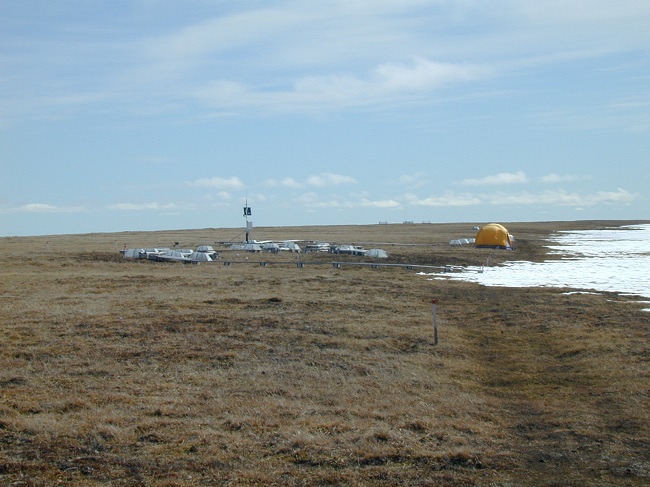
Figure 1. International Tundra EXperiment (ITEX) Barrow study site.
Citation
Huemmrich, K.F., and J.A. Gamon. 2022. Tundra Plant Reflectance, CO2 Exchange, PAM Fluorometry, and Pigments, AK, 2001-2002. ORNL DAAC, Oak Ridge, Tennessee, USA. https://doi.org/10.3334/ORNLDAAC/1960
Table of Contents
- Dataset Overview
- Data Characteristics
- Application and Derivation
- Quality Assessment
- Data Acquisition, Materials, and Methods
- Data Access
- References
Dataset Overview
This dataset provides measurements at tundra plots collected near Utqiagvik and Atqasuk, AK, including visible-near infrared spectral reflectance, chamber gas exchange measurements of CO2, pulse amplitude modulated (PAM) fluorometry, chlorophyll pigment contents, along with surface temperature, permafrost active layer depth, and soil temperature at 5 cm, through the growing seasons of 2001 and 2002. At all plots, spectral reflectance was measured using a portable spectrometer configured with a straight fiber optic foreoptic, surface temperatures were measured using a handheld Everest Infrared Thermometer, and thaw depth (or active layer depth) was measured using a metal rod graduated in centimeter intervals. At small plots (~15 cm) at Utqiagvik (referred to as Patch plots) chambers were constructed that enclosed an individual patch to determine photosynthetic rate and estimate respiration rate (made by covering the chamber in a dark cloth). Efficiency using PAM fluorometer, ambient yield estimations, and rapid light curve measurements were taken. Chlorophyll concentration was measured with a portable spectrometer configured as a spectrophotometer. At larger plots (approximately 1 m2) which were part of the International Tundra EXperiment (ITEX plots) at Utqiagvik (referred to as Barrow) and Atqasuk, a sub-sample of five control and five warmed plots at each site were fitted with 0.45 m diameter polyvinyl chloride collars for chamber flux measurements. To determine the total fraction of absorbed photosynthetically active radiation (fAPAR), a series of photosynthetically active radiation (PAR) measurements were made using a custom-made light bar consisting of a linear array of GaAsP sensors mounted within an aluminum U-bar under a white plastic diffuser. In addition, a visual estimate was made of the fraction of standing dead vegetation based on percent cover. The data are provided in comma-separated values (*.csv) format. In addition, photographs of plots and instruments are provided.
The Patch plots represent nearly pure species cover types located in a region of moist acidic coastal tundra with high-centered polygons. In 2001, the focus was on describing variability within general plant functional type groups: vascular plants, mosses, and lichens. In 2002, the focus was on describing variability within the microtopography of the area. The ITEX plots were located in two physiognomically similar areas with contrasting moisture regimes: frequently inundated wet meadow and well-drained dry heath communities.
Project: Arctic-Boreal Vulnerability Experiment
The Arctic-Boreal Vulnerability Experiment (ABoVE) is a NASA Terrestrial Ecology Program field campaign based in Alaska and western Canada between 2016 and 2021. Research for ABoVE links field-based, process-level studies with geospatial data products derived from airborne and satellite sensors, providing a foundation for improving the analysis and modeling capabilities needed to understand and predict ecosystem responses and societal implications.
Related Publications
Huemmrich, K.F., P. Campbell, C. Tweedie, S.A. Vargas, R. Hollister, M. Carroll, E. Middleton, J. Gamon, and S. Oberbauer. 2022. Hyperspectral mapping of tundra vegetation. In Process.
Huemmrich, K.F., J.A. Gamon, C.E. Tweedie, S. Oberbauer, G. Kinoshita, S.Houston, A. Kuchy, R.D. Hollister, H. Kwon, M. Mano, Y. Harazono, P.J. Weber, and W.C. Oechel. 2010. Remote sensing of tundra gross ecosystem productivity and light use efficiency under varying temperature and moisture conditions. Remote Sensing of Environment 114:481- 489. https://doi.org/10.1016/j.rse.2009.10.003
Related Datasets
Huemmrich, K.F., and P.K. Campbell. 2021. Tundra Plant Leaf-level Spectral Reflectance and Chlorophyll Fluorescence, 2019-2021. ORNL DAAC, Oak Ridge, Tennessee, USA. https://doi.org/10.3334/ORNLDAAC/2005
Acknowledgement
This study was funded under the NASA ABoVE program (grant NNX17AC58A).
Data Characteristics
Study Areas: Utqiagvik and Atqasuk, Alaska
ABoVE Reference Locations
Domain: Core ABoVE
State/Territory: Alaska
Grid cells (5 m): Ch049V006, Ch047V007, Ch048V007, Ch049V007, Ch050V007, Ch046V008, Ch047V008, Ch048V008, Ch049V008, Ch047V009, Ch048V009
Spatial Resolution: Point measurements
Temporal Coverage: 2001-06-19 to 2002-08-16
Temporal Resolution: Monthly during the growing season
Study Areas: Latitude and longitude are provided in decimal degrees.
| Site | Northernmost Latitude | Southernmost Latitude | Easternmost Longitude | Westernmost Longitude |
|---|---|---|---|---|
| Utqiagvik and Atqasuk, Alaska | 71.32 | 70.453 | -156.6 | -157.4073 |
Data File Information
There are seven files in comma-separated values (*.csv) format included in this dataset. Patch files refer to measurements made at small plots representing nearly uniform vegetation cover types. ITEX files refer to the International Tundra EXperiment, which has larger plots.
Table 1. File names and descriptions.
| File Name | Description |
|---|---|
| ITEX_Reflectance_Atqasuk_Barrow.csv | This file provides spectral reflectance interpolated to 1 nm intervals |
| ITEX_ThawDepth_TSoil_TSurface_fAPAR_Atqasuk_Barrow.csv | This file provides thaw depth, soil and surface temperature measurements, and fAPAR measurements |
| Patch_GasExchange_Utqiagvik.csv | This file provides respiration, CO2, net and gross photosynthesis, leaf temperature |
| Patch_Reflectance_Utqiagvik.csv | This file provides spectral reflectance interpolated to 1 nm intervals |
| Patch_Pigments_Utqiagvik.csv | This file provides concentrations of chlorophyll a and b, and leaf area |
| Patch_PAM_Fluorometer_Utqiagvik.csv | This file provides measurements made with a PAM fluorometer including maximum fluorescence, electron transport rate, photochemical and non-photochemical fluorescence quenching |
| Patch_ThawDepth_TSoil_TSurface_Utqiagvik.csv | This file provides thaw depth, surface temperature, and soil temperature |
Data File Details
ITEX Data File Variables and Descriptions
Table 2. Variable names and descriptions in the file ITEX_Reflectance_Atqasuk_Barrow.csv. Measurements were made in 2001 and 2002.
| Variable | Units | Description |
|---|---|---|
| site | Area where data were collected, Barrow or Atqasuk (see Table 10 for plot descriptions) | |
| plot_id | Plot ID | |
| latitude | degrees north | Latitude of study area |
| longitude | degrees east | Longitude of study area |
| elevation | m | Elevation above sea level |
| date | YYYY-MM-DD | Date of measurement |
| time_adt | HH:MM:SS | Start time of measurements in local time: Alaska Daylight time (UTC -8 h) |
| rfl_400 - rfl_1000 (multiple columns) |
unitless | Spectral reflectance interpolated to 1 nm intervals; the numbers in the column names refer to the wavelengths in nm |
Table 3. Variable names and descriptions in the file ITEX_ThawDepth_TSoil_TSurface_fAPAR_Atqasuk_Barrow.csv. Measurements were made in 2001 and 2002.
| Variable | Units | Description |
|---|---|---|
| site | Area where data were collected, Barrow or Atqasuk (see Table 10 for plot descriptions) | |
| plot_id | Plot ID | |
| latitude | degrees north | Latitude of study area |
| longitude | degrees east | Longitude of study area |
| elevation | m | Elevation above sea level |
| date | YYYY-MM-DD | Date of measurement |
| thaw_depth | cm | Depth of thawed ground measured with a probe |
| soil_temp_5cm | degrees C | Soil temperature at 5 cm depth |
| surface_temp | degrees C | IR surface temperature, measured using Everest IR thermometer |
| percent_standing_dead_matter | percent | Visual estimate of the fraction of dead material in the standing vegetation |
| total_fAPAR | The fraction of photosynthetically active radiation absorbed by the standing vegetation, measured with a mini light bar |
Patch Data File Variables and Descriptions
Table 4. Variable names and descriptions in the file Patch_GasExchange_Utqiagvik.csv. Measurements were made in 2001 and 2002.
| Variable | Units | Description |
|---|---|---|
| plot_id | Plot ID number (see Table 11 for plot descriptions) | |
| latitude | degrees north | Latitude of study area |
| longitude | degrees east | Longitude of study area |
| date | YYYY-MM-DD | Date of measurement |
| time_adt | HH:MM:SS | Start time of measurements in local time: Alaska Daylight time (UTC -8 h) |
| light_treatment | Describes the incident light on the chamber, whether it is full illumination or if screens were used to decrease incident light | |
| incident_PPFD_outside_chamber | mol m-2 s-1 | Incident photosynthetic photon flux PPFD outside of chamber |
| air_temp_inchamber | degrees C | Air temperature within chamber |
| leaf_temp | Thermocouple temperature of leaves | |
| co2_inchamber | µmol mol-1 | CO2 concentration in chamber |
| net_photosynthesis | µmol CO2 m-2 s-1 | Net photosynthesis measured in chamber |
| gross_photosynthesis | µmol CO2 m-2 s-1 | Gross photosynthesis, the net photosynthesis – respiration |
| respiration | µmol CO2 m-2 s-1 | Respiration measured with chamber covered blocking out all light |
| notes | Other information on the measurement |
Table 5. Variable names and descriptions in the file Patch_Reflectance_Utqiagvik.csv. Measurements were made in 2001 and 2002.
| Variable | Units | Description |
|---|---|---|
| plot_id_description | Plot ID | |
| plot_description | Plot description- species name or general description of cover type (see Table 11 for plot descriptions) | |
| latitude | degrees north | Latitude of study area |
| longitude | degrees east | Longitude of study area |
| date | YYYY-MM-DD | Date of measurement |
| time_adt | HH:MM:SS | Start time of measurements in local time: Alaska Daylight time (UTC -8 h) |
| rfl_400 - rfl_1000 multiple columns) |
Unitless | Spectral reflectance interpolated to 1 nm intervals; the numbers in the column names refer to the wavelengths in nm. |
Table 6. Variable names and descriptions in the file Patch_Pigments_Utqiagvik.csv. All measurements were made in 2001.
| Variable | Units | Description |
|---|---|---|
| species | Name of species sampled | |
| type | Plant functional type: vp-vascular plant, lichen, moss | |
| latitude | degrees north | Latitude of study area |
| longitude | degrees east | Longitude of study area |
| date | YYYY-MM-DD | Date of measurement |
| chla_conc | nmol ml-1 | Concentration of chlorophyll a in sample |
| chlb_conc | nmol ml-1 | Concentration of chlorophyll b in sample |
| total_chl_conc | nmol ml-1 | Concentration of total chlorophyll (a and b) in sample |
| leaf_area | cm2 | Area of leaf sample |
| final_volume | ml | Volume of sample |
| chla_per_area | µmol m-2 | Chlorophyll a per unit leaf area |
| chlb_per_area | µmol m-2 | Chlorophyll b per unit leaf area |
| total_Chl_per_area | µmol m-2 | Chlorophyll a per unit leaf area |
| notes | Other observations about the samples |
User Note for Table 6: Samples were collected three times during the summer of 2001 only. Plant samples had to be removed to make the pigment measurements, disturbing the plots, so for the most part the samples were not collected right at the established patch plots and thus do not have plot IDs associated with them. In a few cases, there were notes indicating plot numbers included in the notes column of the pigments table. However, there is a connection between the patch reflectance measurements and these pigment measurements, with reflectance measurements being collected within a few days of the pigment sampling of either the sampled plots or nearby areas of the same species.
Table 7. Variable names and descriptions in the file Patch_PAM_Fluorometer_Utqiagvik.csv. All measurements were made in 2001.
| Variable | Units | Description |
|---|---|---|
| plot_id | Plot ID (See Table 11 for plot descriptions) | |
| latitude | degrees north | Latitude of study area |
| longitude | degrees east | Longitude of study area |
| date | YYYY-MM-DD | Date of measurement |
| time_adt | HH:MM:SS | Start time of measurements in local time: Alaska Daylight time (UTC -8 h) |
| measurement_type | Measurement type: "Amb" for under ambient light, "RLC" for rapid light curve. Code is RLCxx_r where xx is plot ID and r is replicate number for that day | |
| mark | Actinic (A) vs. induction (I) light | |
| F | Instantaneous fluorescence: transient (Ft) or steady state (Fs) | |
| Fm' | 1 | Maximum fluorescence |
| yield | 1 | Operating efficiency of PSII (YII, au), (unitless) |
| etr | µmol electrons m-2 s-1 | Electron transport rate |
| par | µmol m-2 s-1 | Photosynthetically Active Radiation illumination from instrument |
| temp_internal | degrees C | Internal temperature |
| qP | 1 | Photochemical fluorescence quenching |
| qN | 1 | Non-photochemical fluorescence quenching |
| NPQ | 1 | Non-photochemical quenching |
Table 8. Variable names and descriptions in the file Patch_ThawDepth_TSoil_TSurface_Utqiagvik.csv. All measurements were collected in 2002.
| Variable | Units | Description |
|---|---|---|
| plot_id | Plot ID (See Table 11 for plot descriptions) | |
| Latitude | degrees north | Latitude of study area |
| Longitude | degrees east | Longitude of study area |
| date | YYYY-MM-DD | Date of measurement |
| thaw_depth | cm | Depth of thawed ground measured with a probe |
| soil_temp_5cm | degrees C | Soil temperature at 5 cm depth |
| surface_temp | degrees C | IR surface temperature, measured using Everest IR thermometer |
| notes | Comments about condition of plots at time of measurement |
There are 245 plot photos within the plot_photos.zip folder. The file names for plot photos are in the form YYMMDDPlot_ID.JPG. For example, 010630PLOT7.JPG is a photo of plot 17 taken on June 30, 2001. There are also photos showing instruments and data collection activities.
Table 9. Example photo file names and descriptions.
| File Name | Description |
|---|---|
| 010707_GasExchange.JPG and 020611_GasExchange.JPG | Chamber gas exchange measurements being collected |
| GasExchangeDark.JPG | Chamber gas exchange respiration measurements being collected with the chamber covered |
| CHAMBER1.JPG | Picture of the clear chamber used for the gas exchange measurements |
| LICOR3.JPG | Picture of the chamber gas exchange equipment |
| FluormeterMeasurement.JPG | PAM fluorometer measurements being collected |
| FLUOROMETER.JPG and FLUOROMETER1.JPG | Pictures of the PAM fluorometer |
| PatchReflMeasurements1.JPG | Unispec being used to collect spectral reflectance measurement |
Application and Derivation
This dataset provides field data for the growing seasons in 2001–2002 which could be useful to carbon cycling and climate change studies.
Quality Assessment
Uncertainty was not analyzed.
Data Acquisition, Materials, and Methods
Site Description: ITEX sites
ITEX study sites were located near Utqiagvik and Atqasuk, Alaska. At both sites, the ITEX plots were located in two physiognomically similar areas with contrasting moisture regimes: frequently inundated wet meadow and well-drained dry heath communities. The Utqiagvik dry heath site was on a formerly raised beach ridge, about 5.0 m above sea level, with moderately well-drained xeric pergelic cryaquept soils, Dominant species included Salix rotundifolia, Cassiope tetragona, Luzula confusa, Dicranum elongatum, and Alectoria nigricans. The Utqiagvik wet meadow site was in a transition zone between the former beach ridge and a drained lake basin at approximately 4 m above sea level. Soils at the wet site were poorly drained histic pergelic cryaquepts. Dominant species at the Utqiagvik wet sites were Carex aquatilis, Eriophorum angustifolium, and Dupontia fisheri mixed with Drepanocladus brevifolius and Campylium stellatum. The Atqasuk dry heath site was on the rim of a partially drained lake at 15.5 m above sea level, with well-drained pergelic cryopsamment soils. Ledum palustre, C. tetragona, and L. confusa were the dominant species along with A. nigricans and Polytrichastrum alpinum. The Atqasuk wet meadow site was near a lake at 15 m above sea level, with poorly drained histic pergelic cryaquept soils. Dominant species cover included C. aquatilis, Eriophorum russeolum, and Salix pulchra mixed with Onocphorus wahlenbergii and Peltigera aphthosa. A comprehensive description of the ITEX sites is given in Hollister (2003).
Each of the four ITEX studies (wet and dry, Utqiagvik and Atqasuk) sites had 24 warmed and 24 control plots. All plots were 1 m2. Plots were warmed using Open Top Chambers (OTC) built following Molau and Mølgaard (1996) plans out of Sun-Lite HPTM fiberglass (Solar Components Corporation, Manchester, New Hampshire) (Hollister and Webber, 2000; Marion et al., 1997).
The plots were established in 1994 in Utqiagvik and in 1996 in Atkasuk with OTC used to warm plots during the growing season every year (Hollister, 2003; Hollister et al., 2005). A sub-sample of five control and five warmed plots at each site were fitted with 0.45 m diameter polyvinyl chloride collars for chamber flux measurements (Oberbauer et al., 2007). Spectral reflectance measurements were collected only for the plots with collars.
Table 10. Plot descriptions with locations from the Barrow Area Information Database (BAID) (https://barrowmapped.org/ accessed on 2018-07-25).
| Site | Plot_ID | Plot_type | Manipulation | Latitude (deg N) | Longitude (deg E) | Elevation (m) |
|---|---|---|---|---|---|---|
| Barrow | OTC8 | Wet | warmed | 71.3110 | -156.5980 | 2.8 |
| Barrow | CTL6 | Wet | control | 71.3109 | -156.5980 | 2.8 |
| Barrow | OTC7 | Wet | warmed | 71.3110 | -156.5981 | 2.8 |
| Barrow | CTL5 | Wet | control | 71.3110 | -156.5982 | 2.8 |
| Barrow | OTC6 | Wet | warmed | 71.3111 | -156.5981 | 2.8 |
| Barrow | CTL3 | Wet | control | 71.3111 | -156.5981 | 2.8 |
| Barrow | CTL4 | Wet | control | 71.3111 | -156.5982 | 2.8 |
| Barrow | OTC5 | Wet | warmed | 71.3111 | -156.5981 | 2.8 |
| Barrow | OTC4 | Wet | warmed | 71.3112 | -156.5982 | 2.8 |
| Barrow | CTL2 | Wet | control | 71.3112 | -156.5982 | 2.8 |
| Barrow | OTC19 | Dry | warmed | 71.3134 | -156.5987 | 4.4 |
| Barrow | OTC20 | Dry | warmed | 71.3134 | -156.5987 | 4.4 |
| Barrow | CTL18 | Dry | control | 71.3134 | -156.5987 | 4.4 |
| Barrow | CTL17 | Dry | control | 71.3134 | -156.5987 | 4.3 |
| Barrow | OTC21 | Dry | warmed | 71.3134 | -156.5988 | 4.2 |
| Barrow | CTL19 | Dry | control | 71.3134 | -156.5987 | 4.3 |
| Barrow | CTL21 | Dry | control | 71.3134 | -156.5986 | 4.4 |
| Barrow | CTL23 | Dry | control | 71.3133 | -156.5987 | 4.3 |
| Barrow | OTC22 | Dry | warmed | 71.3134 | -156.5986 | 4.3 |
| Barrow | OTC23 | Dry | warmed | 71.3134 | -156.5986 | 4.4 |
| Atqasuk | CTL5 | Wet | control | 70.4531 | -157.4004 | 17.4 |
| Atqasuk | CTL6 | Wet | control | 70.4530 | -157.4004 | 17.4 |
| Atqasuk | CTL7 | Wet | control | 70.4530 | -157.4004 | 17.4 |
| Atqasuk | CTL8 | Wet | control | 70.4530 | -157.4004 | 17.5 |
| Atqasuk | CTL9 | Wet | control | 70.4530 | -157.4004 | 17.4 |
| Atqasuk | OTC1 | Wet | warmed | 70.4531 | -157.4004 | 17.3 |
| Atqasuk | OTC2 | Wet | warmed | 70.4530 | -157.4003 | 17.3 |
| Atqasuk | OTC3 | Wet | warmed | 70.4530 | -157.4004 | 17.3 |
| Atqasuk | OTC4 | Wet | warmed | 70.4530 | -157.4004 | 17.3 |
| Atqasuk | OTC5 | Wet | warmed | 70.4530 | -157.4004 | 17.4 |
| Atqasuk | CTL19 | Dry | control | 70.4537 | -157.4072 | 21.6 |
| Atqasuk | CTL20 | Dry | control | 70.4537 | -157.4072 | 21.6 |
| Atqasuk | CTL21 | Dry | control | 70.4538 | -157.4073 | 21.6 |
| Atqasuk | CTL22 | Dry | control | 70.4538 | -157.4072 | 21.5 |
| Atqasuk | CTL23 | Dry | control | 70.4538 | -157.4073 | 21.5 |
| Atqasuk | OTC20 | Dry | warmed | 70.4537 | -157.4072 | 21.6 |
| Atqasuk | OTC21 | Dry | warmed | 70.4538 | -157.4072 | 21.4 |
| Atqasuk | OTC22 | Dry | warmed | 70.4538 | -157.4072 | 21.4 |
| Atqasuk | OTC23 | Dry | warmed | 70.4538 | -157.4073 | 21.5 |
| Atqasuk | OTC24 | Dry | warmed | 70.4539 | -157.4073 | 21.5 |
Measurement Methods
For ITEX Barrow plots, diurnal CO2 fluxes were measured weekly during the 2002 growing season on the following dates: June 4, 11, 18, 25, July 2, 9, 15, 22, 29, August 6, and 12. Diurnal CO2 fluxes were measured bi-weekly in Atqasuk in 2002 on the following dates: June 7, 20, July 6, 18, and August 1.
Spectral Reflectance
Spectral reflectance was measured using a portable spectrometer (UniSpec SC, PP Systems, Amesbury MA, USA) configured with a straight fiber optic foreoptic (UNI684, PP Systems, Inc.). Five reflectance measurements were made within each flux collar and averaged. The field of view of the measurements was approximately 10 cm. For the warmed plots the OTC was removed for the reflectance measurement.
Reflectance was determined by dividing the plot radiance by the irradiance determined using a white reference standard (Spectralon, LabSphere, North Dutton, NH, USA). Calibration panel irradiance measurements were collected within seconds of the target measurements. The Unispec instrument has a spectral resolution of approximately 3 nm, the processed reflectance spectra were interpolated to 1 nm bands.
The reflectance curve often has spikes over wavelengths between 759 and 766 nm, most likely due to the effect of the atmospheric O2 absorption band in that spectral region. These spikes have not been removed from this dataset.
Surface Temperature
Surface temperatures were measured using a handheld Everest Infrared Thermometer (Everest Interscience Inc., Chino Hills, CA). Three measurements were collected within the flux collars at each plot and averaged. Surface temperature measurements were collected within minutes of the spectral reflectances.
Thaw Depth
Thaw depth (or active layer depth) was measured using a metal rod graduated in centimeter intervals. The rod was inserted into the ground until stopped by a frozen layer of soil and the depth was read off of the rod and recorded in a notebook. Thaw depth measurements were collected within minutes of the spectral reflectance measurements. Thaw depth can be underestimated due to the rod hitting a rock instead of the permafrost.
Soil Temperatures
Soil temperatures were measured at 5 cm depth using a probe. The temperatures were recorded to the nearest °C. Soil temperature measurements were collected within minutes of the spectral reflectance measurements.
fAPAR
To determine the total fraction of absorbed photosynthetically active radiation (fAPAR), a series of photosynthetically active radiation (PAR) measurements were made using a custom-made “light bar” consisting of a linear array of GaAsP sensors (G1118 Hamamatsu Corp., Bridgewater, N.J) mounted within an aluminum U-bar under a white plastic diffuser. The size of this light bar (1 cm wide × 1 cm deep × 10 cm long) was specifically chosen to fit under the low tundra vegetation canopy and within the constraints of the flux collars around each plot. A datalogger (LI-1000, LI-COR, Lincoln, NE, USA) was used to read the PAR values from the light bar sensor array. fAPAR was determined from a set of light bar measurements, first, the light bar was held horizontally above the canopy approximately 30 cm above the ground with the sensors looking downward to measure the reflected PAR (Qr), then flipped over to measure incident PAR (Qin). Due to the low stature of the canopy, and the dark understory surface (typically covered by moss or a thin layer of standing water), it was difficult to obtain a measurable value of the PAR reflected from the ground under the canopy (Qrb), and this value was found to be negligible so set to zero in the calculation of fAPAR. The PAR transmitted through the canopy (Qt) was measured by placing the light bar at ground level under the vascular plant canopy. Three repetitions of Qt were made for each plot and averaged. fAPAR was then calculated as:
fAPAR = (Qin – Qr – Qt)/Qin
The fAPAR measurements were collected under cloudy (diffuse light) conditions.
Fraction of Standing Dead Vegetation
In many of the plots, dead material made up a significant fraction of the standing vegetation. To adjust for dead material in the calculation of green fAPAR (the PAR absorbed by green vegetation) a visual estimate was made of the fraction of standing dead vegetation based on percent cover. This estimate was not calibrated; therefore, accuracy is probably no better than 15%.
Patch Plot Site Descriptions
Study plots were located near Utqiagvik. Plots were located in a region of moist acidic coastal tundra with high-centered polygons. All plots were south of an east-west running 100 m long transect with a tram track running along with it. The plots were within 10 m of the tram transect.
In 2001, the focus was on describing variability within general plant functional type groups: vascular plants, mosses, and lichens. On each measurement day, samples of each of these types were measured. A number of plots had repeat measurements. In 2002, the focus was on describing variability within the microtopography of the area, so 17 plots were established for repeated measurements. These plots represented a range of topographic conditions. The 2002 plot IDs indicate the position of the plot relative to the transect in terms of meters from the western end of the plot.
Table 11. Descriptions of plots with repeated measurements.
| Plot | Cover description or Dominant species | Other significant species and approximate % cover | Year measured |
|---|---|---|---|
| 1 | Carex aquatilis | 5% E. angustifolium, 5% D. fischerii | 2001 |
| 2 | Carex aquatilis | 25% E. angustifolium | 2001 |
| 3 | Dicranum undulatum | n/a | 2001 |
| 4 | Cetraria cucullata | 20% D. arctica, 5% Cetraria ericetorum,25% D. uncinatus | 2001 |
| 5 | Dactylina arctica | 10% C. ericetorum | 2001 |
| 6 | Cetraria nivalis | n/a | 2001 |
| 7 | Drepanocladus uncinatus | n/a | 2001 |
| 8 | Luzula confusa | n/a | 2001 |
| 9 | Dactylina arctica | 10% A. nigricans | 2001 |
| 10 | Alectoria nigricans | 15% D. arctica, 10% Thamnolia subuliformis, 5% C. cucullata | 2001 |
| 11 | Salix rotundifolia | n/a | 2001 |
| 12 | Luzula confusa | n/a | 2001 |
| 13 | Polytrichum spp | n/a | 2001 |
| 14 | Dicranum elongatum | n/a | 2001 |
| 15 | Eriophorum angustifolium | n/a | 2001 |
| 16 | Eriophorum angustifolium | n/a | 2001 |
| 17 | Eriophorum angustifolium | 5% P. frigidus | 2001 |
| 18 | Drepanocladus revolvens | n/a | 2001 |
| 19 | Drepanocladus revolvens | n/a | 2001 |
| 20 | Eriophorum angustifolium | 10% P. frigidus, 15% E. scheuzerii | 2001 |
| 21 | Dupontia fiscerii | 5% E. scheuzerii | 2001 |
| 22 | Eriophorum scheuzerii | 10% D. fischerii | 2001 |
| 23 | Dupontia fiscerii | n/a | 2001 |
| A | Potentilla hyparctica | n/a | 2001 |
| B | Petasites frigidus | n/a – D. undulatum 25% visible | 2001 |
| C | Potentilla hyparctica | n/a | 2001 |
| M6 | moss w/sedge | Plot in local high point | 2002 |
| M10 | wet w/ sedge | Plot in local low, wet point | 2002 |
| M16 | mostly moss | Plot in local high point | 2002 |
| M17 | moss | Plot in local high point | 2002 |
| M18 | moss | Plot in local high point | 2002 |
| M28 | salix, lichen, moss | Plot in local high point | 2002 |
| M29 | ranunculas, sedge | Plot on intermediate slope | 2002 |
| M38 | sedge w/ sphagnum | Plot in local low, wet point | 2002 |
| M48 | dirt | Plot in local high point | 2002 |
| M49 | small leaf salix | Plot in local high point | 2002 |
| M50 | sedge | Plot on slope | 2002 |
| M57 | sedge | Plot in local low, wet point | 2002 |
| M59 | sedge, eriophorum | Plot in local low, wet point | 2002 |
| M60 | moss/lichen | Plot in local high point | 2002 |
| M66 | grass | Plot in local high point | 2002 |
| M83 | eriophorum | Plot in local low, wet point | 2002 |
| M84 | sedge | Plot in local wet spot | 2002 |
Measurement Methods
Measurements were collected multiple times over the growing seasons of 2001 and 2002 to describe characteristics during green-up, peak growth, and senescence.
Spectral Reflectance
Visible-near infrared spectral reflectance was measured using a portable spectrometer (UniSpec SC, PP Systems, Amesbury MA, USA) configured with a straight fiber optic foreoptic (UNI684, PP Systems, Inc.). A glass fiber optic (part# 400029-0200, RoMack, Williamsburg, VA) was attached to the spectrometer and fitted with a metal ferule that allowed for ~20° field of view. The fiber was held approximately 15 cm above each vegetation patch and three reflectance scans were taken of each patch and averaged together. Each individual patch was approximately 15 cm in diameter.
Reflectance was determined by dividing the plot radiance by the irradiance determined using a white reference standard (Spectralon, LabSphere, North Dutton, NH, USA). Calibration panel irradiance measurements were collected within seconds of the target measurements. The Unispec instrument had a spectral resolution of approximately 3 nm, and the processed reflectance spectra were interpolated to 1 nm bands.
The reflectance curve often has spikes over wavelengths between 759 and 766 nm, most likely due to the effect of the atmospheric O2 absorption band in that spectral region. These spikes have not been removed from this dataset.
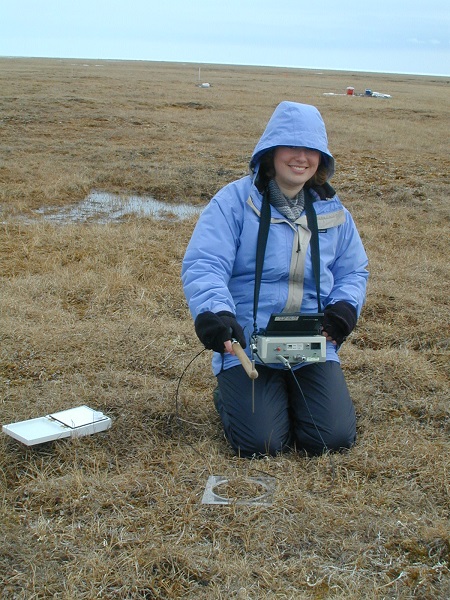
Figure 2. Reflectance data collection. Source: PatchReflMeasurements1.JPG
Gas Exchange
To determine photosynthetic rates, chambers were constructed that enclosed an individual patch allowing for photosynthetic rate determination as well as respiration estimates (made by covering the chamber in a dark cloth). Each gas exchange sample consisted of a small patch (14.6 cm in diameter, matching the scale of reflectance sampling) dominated by one species of one functional type or microtopographic location.
The chamber was constructed out of a 0.3175 cm thick acrylic tube glued to a 0.635 cm thick acrylic top. Collars were embedded in the ground and a clear chamber was attached to the collars for the gas exchange measurements. A closed gas exchange system was connected to the chamber to measure CO2 rates (LI-6200, LI-COR, Lincoln, NE).
The photosynthetic photon flux density (PPFD) measurements are the values outside the chamber. Measurements of the clear chamber found transmittance of PPFD of 95%. In some cases, incident light levels were altered to examine light responses by using neutral screens to attenuate incident light. Each value is an average of multiple measurements (3-10).
The photos 010707_GasExchange.JPG and 020611_GasExchange.JPG show chamber gas exchange measurements being collected, GasExchangeDark.JPG shows respiration measurements being collected with the chamber covered, LICOR3.JPG shows the chamber gas exchange equipment, and CHAMBER1.JPG is a close up of the clear chamber.
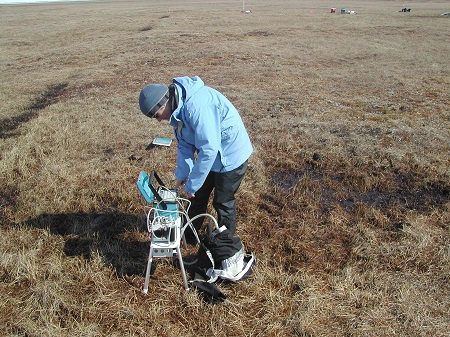
Figure 3. Chamber gas exchange equipment. Source: GasExchangeDark.JPG
Fluorescence
Fluorescence or “yield” measurements (F/Fm’) were used to assess PSII efficiency, an optical estimate of the vegetation’s photosynthetic activity (Maxwell and Johnson 2000). The fluorometer (Mini-PAM, WALZ, Germany) was fitted with a plastic fiber optic and a leaf clip that held the fiber at a 60° angle relative to the surface of the vegetation. Distance from the fiber surface to the vegetation surface was approximately 1-2 mm.
Two types of measurements were taken: ambient yield estimations and rapid light curves. Ambient measurements were made by taking a yield measurement under the natural incident photosynthetic active radiation. Rapid light curves were collected by positioning the fiber probe above the sample then a light curve sequence was initiated using the fluorometer’s built-in light source while the sample was shaded from incoming light. Rapid light curves were a built-in function of the WALZ portable fluorometer and they take about a minute and a half, much faster than a traditional gas-exchange light curve. Except when sampling vascular plants, fluorescence measurements proved to be quite difficult because lichens and mosses showed almost no measurable fluorescence response to the light source. The photos FLUOROMETER.JPG and FLUOROMETER2.JPG are pictures of the PAM fluorometer and the leaf clip, and FluormeterMeasurement.JPG shows PAM fluorometer measurements being collected.
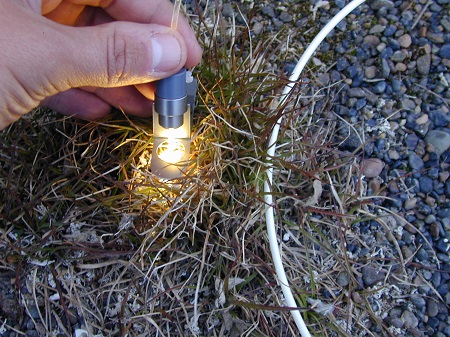
Figure 4. Fluorometer measurements collected. Source: FLUOROMETER.JPG
Chlorophyll Concentration Estimates
Chlorophyll concentration was measured using standard spectrophotometric techniques with a portable spectrometer (UniSpec, PP Systems, Haverhill, MA) configured as a spectrophotometer (Gamon and Surfus, 1999). Chlorophyll concentration was expressed per unit leaf area (μmol m-2). Since mosses and lichens do not have leaves, their area was estimated differently than vascular plants whose leaf area was taken with leaf punches. Moss “leaf” area was estimated by taking a plug of the sample moss using a leaf punch. The leaf punch was then trimmed to only use the surface of a moss layer approximately 1-2 mm thick. Lichen area was easier to estimate than mosses because lichen thalli are easy to flatten. The lichen thallus was flattened, and then a sample was taken with a leaf punch. Note, due to the difficulty in estimating a “leaf area” for mosses and lichens, there is some uncertainty with their chlorophyll concentration compared with vascular plants’ concentrations.
Samples were collected three times during the summer of 2001 (July 3, August 13, and September 5). Samples were taken to the lab where chlorophyll concentration measurements were made. The dates were chosen to estimate early, peak, and late-season chlorophyll concentrations for each plant functional type.
Surface Temperature
In 2002, surface temperatures were measured using a handheld Everest Infrared Thermometer (Everest Interscience Inc., Chino Hills, CA). One measurement was collected within the flux collars at each plot.
Thaw Depth
In 2002, thaw depth (or active layer depth) was measured using a metal rod graduated in centimeter intervals. The rod was inserted into the ground until stopped by a frozen layer of soil and the depth was read off of the rod and recorded in a notebook. Thaw depth can be underestimated due to the rod hitting a rock instead of the permafrost.
Soil Temperatures
In 2002, soil temperatures were measured at 5 cm depth using a temperature probe. The temperatures were recorded to the nearest °C.
Refer to Huemmrich et al. (2021, In Process) for additional information.
Data Access
These data are available through the Oak Ridge National Laboratory (ORNL) Distributed Active Archive Center (DAAC).
Tundra Plant Reflectance, CO2 Exchange, PAM Fluorometry, and Pigments, AK, 2001-2002
Contact for Data Center Access Information:
- E-mail: uso@daac.ornl.gov
- Telephone: +1 (865) 241-3952
References
Gamon, J. and J.S. Surfus. 1999. Assessing leaf pigment content and activity with a reflectometer. New Phytologist 143:105-117. https://doi.org/10.1046/j.1469-8137.1999.00424.x
Huemmrich, K.F., P. Campbell, C. Tweedie, S.A. Vargas, R. Hollister, M. Carroll, E. Middleton, J. Gamon, and S. Oberbauer. 2021. Hyperspectral mapping of tundra vegetation. In Process.
Huemmrich, K.F., and P.K. Campbell. 2021. Tundra Plant Leaf-level Spectral Reflectance and Chlorophyll Fluorescence, 2019-2021. ORNL DAAC, Oak Ridge, Tennessee, USA. https://doi.org/10.3334/ORNLDAAC/2005
Hollister, R.D. 2003. Response of tundra vegetation to temperature: Implications for forecasting vegetation change. Dissertation, Michigan State University. https://doi.org/10.25335/zrkd-q929
Hollister, R.D., and P.J. Webber. 2000. Biotic validation of small open-top chambers in a tundra ecosystem. Global Change Biology 6:835-842.
Hollister, R.D., P.J. Webber, and C.E. Tweedie. 2005. The response of Alaskan arctic tundra to experimental warming: differences between short- and long-term responses. https://doi.org/10.1111/j.1365-2486.2005.00926.x
Marion G.M., G.H.R. Henry, and D.W. Freckman,J. Johnstone, G. Jones, M.H. Jones,E. Lévesque, U. Molau, P. Molgaard, A.N. Parsons, J. Svoboda, and R.A. Virginia. 1997. Open-top designs for manipulating field temperature in high-latitude ecosystems. Global Change Biology 3:20-32. https://doi.org/10.1111/j.1365-2486.1997.gcb136.x
Maxwell, K. and G.N. Johnson. 2000. Chlorophyll fluorescence - a practical guide. Journal of Experimental Botany 51:659-668. https://doi.org/10.1093/jexbot/51.345.659
Molau, U., and Mølgaard, P. 1996: ITEX Manual. 2nd edition. Copenhagen: Danish Polar Center. https://www.gvsu.edu/cms4/asset/3A8AF24B-DDCC-71FD-83D796AFC483CEEF/itexmanualfull.pdf
Oberbauer, S.F., C.E. Tweedie, J.M. Welker, J.T. Fahnestock, G.H.R. Henry, P.J. Webber, R.D. Hollister, M.D. Walker, A. Kuchy, E. Elmore, and G. Starr. 2007. Tundra CO2 Fluxes in Response to Experimental Warming Across Latitudinal and Moisture Gradients. ESA. https://doi.org/10.1890/06-0649
Instrumentation
Bay Instruments, Mini-PAM Flourometer. https://bayinstruments.com/collections/chl-fluorescence-p700-absorbance
Everest Interscience Inc. http://www.everestinterscience.com
Hamamatsu Corp., Bridgewater, New Jersey, USA. https://www.hamamatsu.com
Licor, LI-6200, https://www.licor.com/documents/khhkw8llg3e2rqnh333a
RoeMack Inc. Fiberoptics: components and assemblies ics. https://optics.org/buyers/B000013864
Spectralon, LabSphere, North Dutton, New Hampshire, USA. https://www.labsphere.com/product/spectralon-diffuse-reflectance-standards
PP Systems, Unispec SC portable spectrometers. PP Systems, Inc; Amesbury, Massachusetts, USA. https://labcontrol.com.br/wp-content/uploads/2015/09/unispec-sc.pdf