Documentation Revision Date: 2020-02-14
Dataset Version: 1
Summary
The 79 study sites spanned two ecozones (Boreal Plains and Boreal Shield), two stand-replacing history types (fire and timber harvest), three soil moisture classes (xeric, mesic, and subhygric), and three stand dominance classifications (coniferous, deciduous, and mixed). The sites were selected using a stratified random sampling design to represent potentially important dimensions of carbon stock variation in southern Canadian boreal forests.
There is one data file in comma-separated (.csv) format with this dataset.
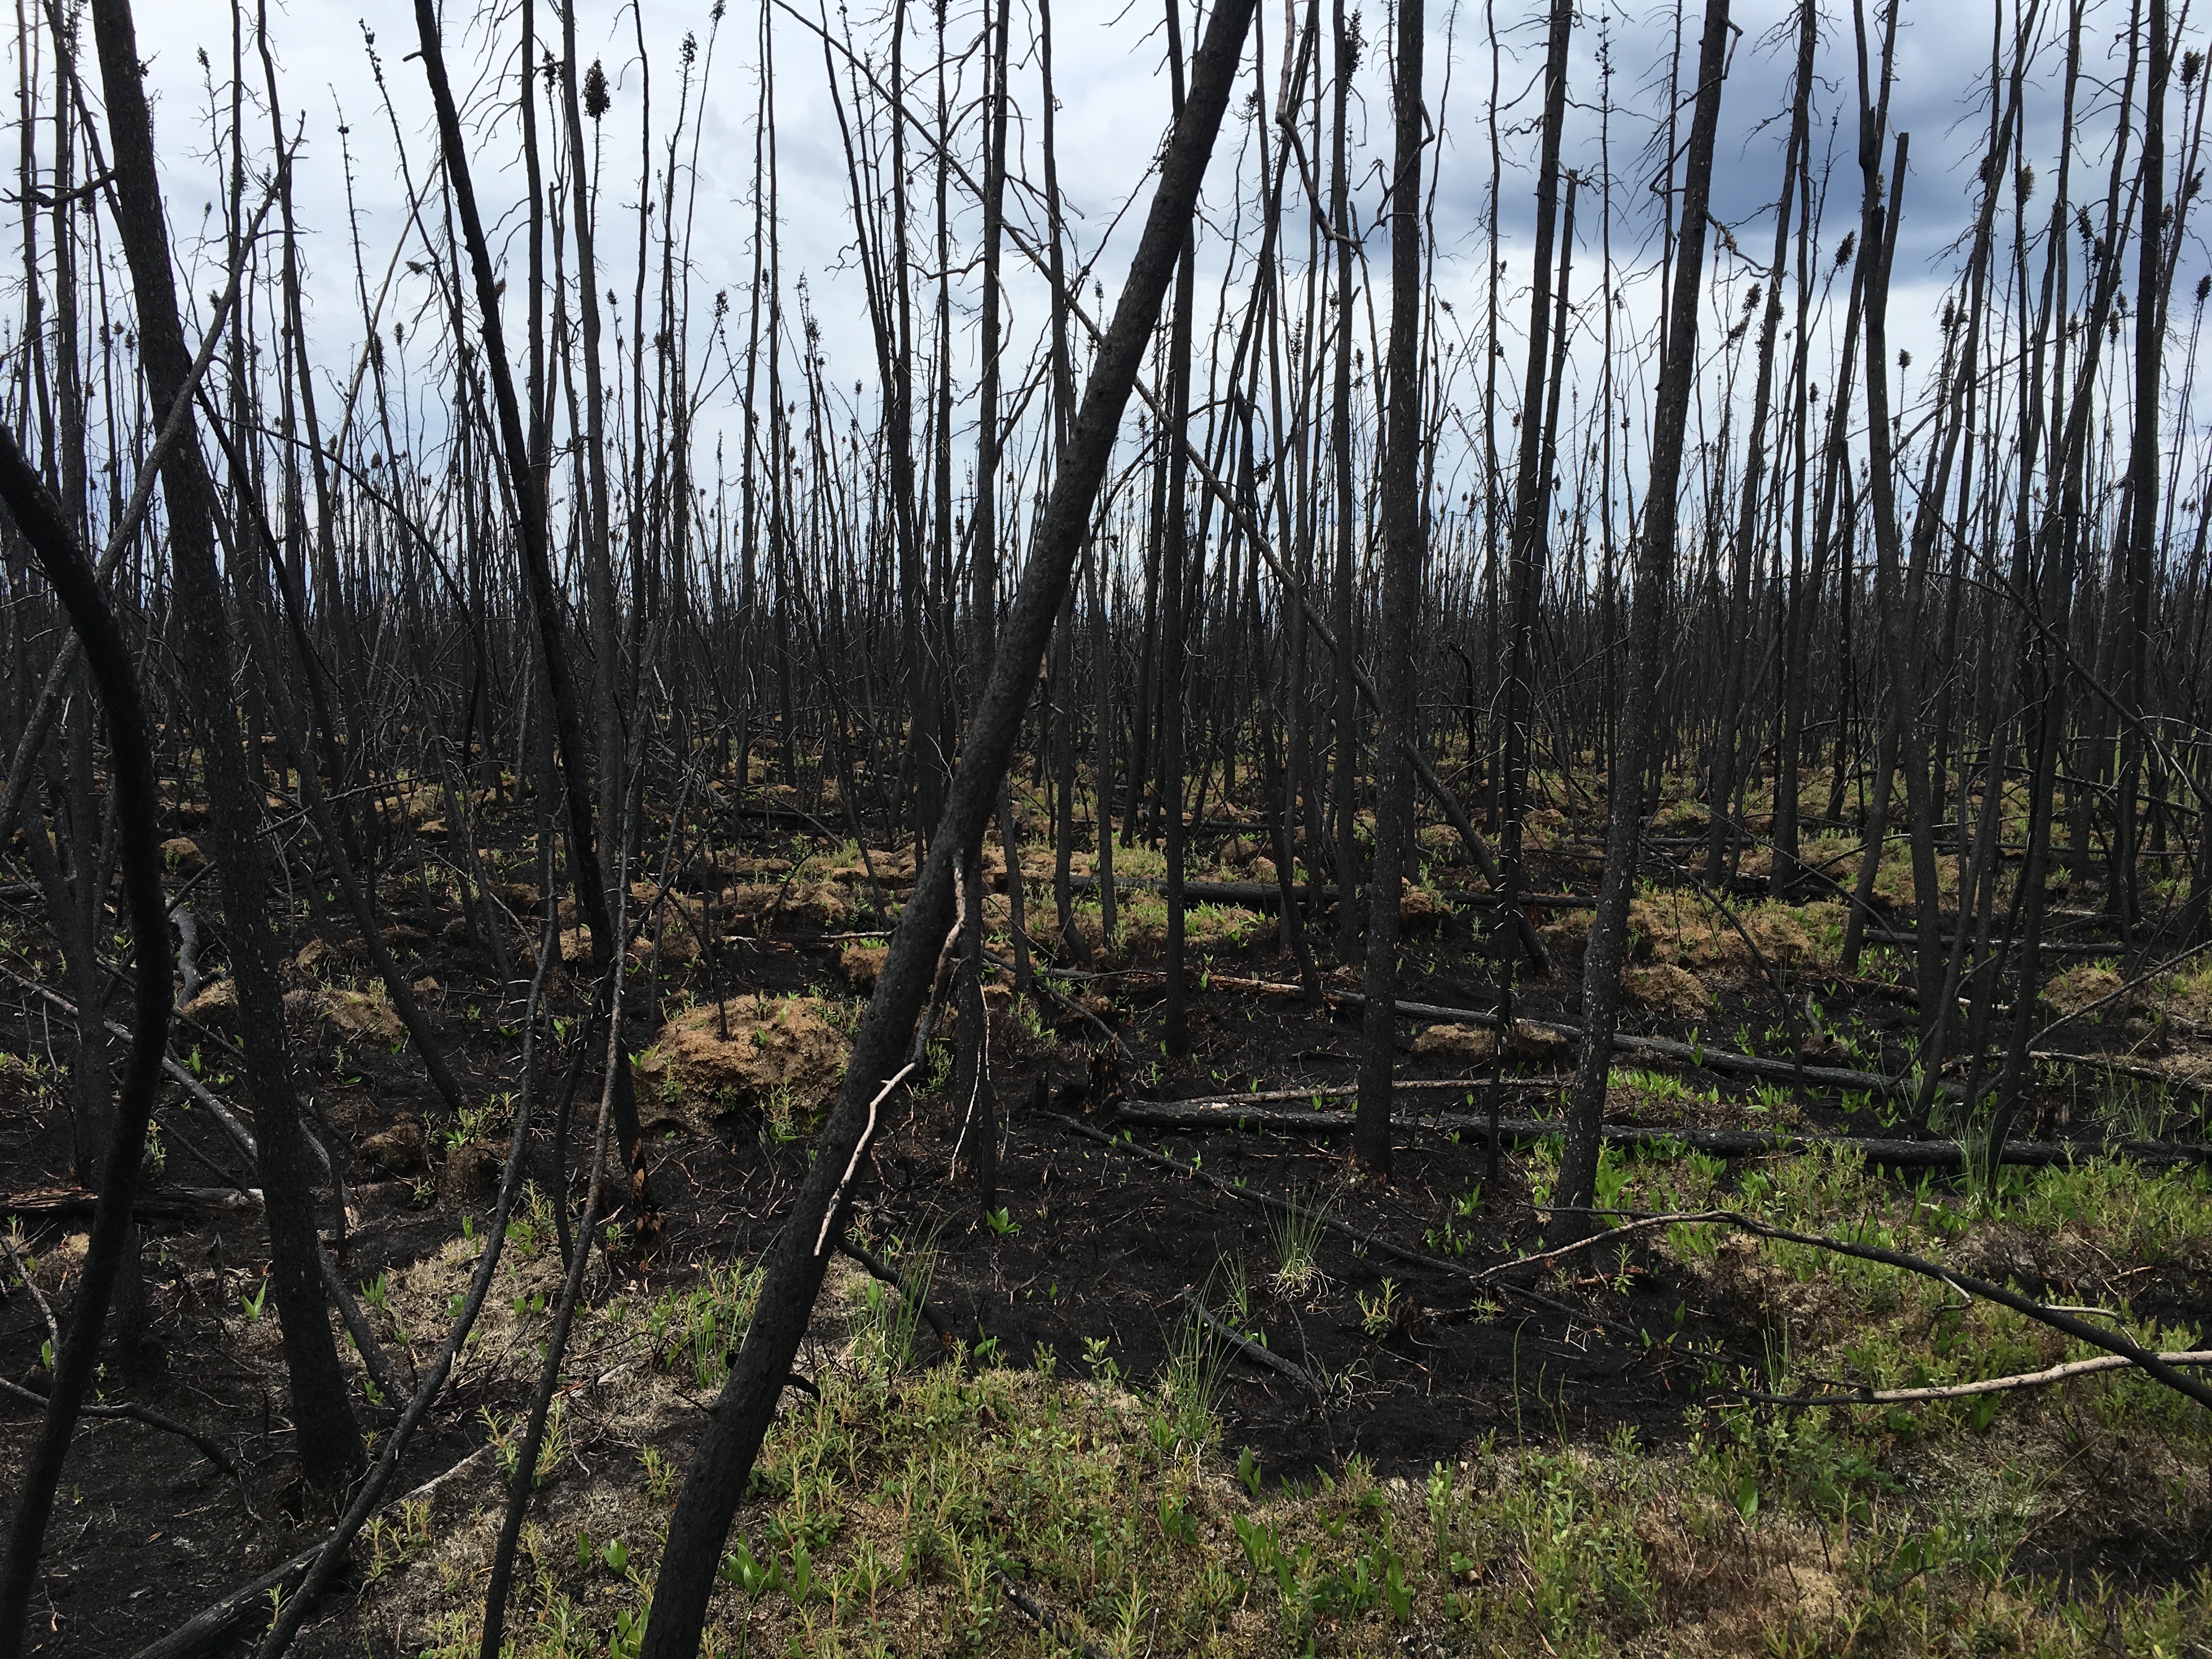
Figure 1. A typical burned plot in the Saskatchewan, Canada, boreal forest study area. Photo provided by C. Dieleman.
Citation
Dieleman, C., B.M. Rogers, S. Veraverbeke, J.F. Johnstone, J. Laflamme, L. Gelhorn, K. Solvik, X.J. Walker, M.C. Mack, and M.R. Turetsky. 2019. ABoVE: Characterization of Burned and Unburned Boreal Forest Stands, SK, Canada, 2016. ORNL DAAC, Oak Ridge, Tennessee, USA. https://doi.org/10.3334/ORNLDAAC/1740
Table of Contents
- Dataset Overview
- Data Characteristics
- Application and Derivation
- Quality Assessment
- Data Acquisition, Materials, and Methods
- Data Access
- References
Dataset Overview
This dataset provides the results of field measurements and estimates of carbon stocks and combustion rates that characterize burned and unburned southern boreal forest stands near the La Ronge and Weyakwin communities in central Saskatchewan (SK), Canada. Measurements were completed in 2016 at 47 stands that burned in the 2015 Saskatchewan wildfires (Egg, Philion, and Brady) and at 32 unburned stands in comparable adjacent areas. Stands were characterized through field observations and sampling of the vegetative community (i.e., tree species, abundance, and biophysical measurements, stand age, coarse woody debris, history of fires or logging), soils (i.e., soil moisture class, unburned and burned soil organic layer depth, samples for bulk density and carbon analyses), and basic landscape geophysical traits. From these results, the pre-fire carbon stocks and carbon combustion values from both the above- and below-ground pools were estimated using a combination of linear and mixed-effects modeling and were calibrated against carbons stocks from the unburned stands. Estimates of uncertainty were generated for above- and below-ground carbon stocks and combustion values using a Monte Carlo framework paired with classic uncertainty propagation techniques.
The 79 study sites spanned two ecozones (Boreal Plains and Boreal Shield), two stand-replacing history types (fire and timber harvest), three soil moisture classes (xeric, mesic, and subhygric), and three stand dominance classifications (coniferous, deciduous, and mixed). The sites were selected using a stratified random sampling design to represent potentially important dimensions of carbon stock variation in southern Canadian boreal forests.
Project: Arctic-Boreal Vulnerability Experiment
The Arctic-Boreal Vulnerability Experiment (ABoVE) is a NASA Terrestrial Ecology Program field campaign based in Alaska and western Canada between 2016 and 2021. Research for ABoVE links field-based, process-level studies with geospatial data products derived from airborne and satellite sensors, providing a foundation for improving the analysis and modeling capabilities needed to understand and predict ecosystem responses and societal implications.
Related Datasets:
There are additional ABoVE fire disturbance datasets archived at the ORNL DAAC which provide similar observations at other boreal forest burned sites.
Related Publication:
Dieleman, C.M., B.M. Rogers, S. Veraverbeke, J.F. Johnstone, J. Laflamme, L. Gelhorn, K. Solvik, X.J. Walker, M.C. Mack, and M.R. Turetsky. Wildfire combustion and carbon stocks in the southern Canadian boreal forest: Implications for a warming world. Global Change Biology (in process).
Acknowledgements:
This research was performed with support from NASA ABoVE, Grant numbers NNX15AU56A and NX15AT71A.
Data Characteristics
Spatial Coverage: Central Saskatchewan, Canada
ABoVE Reference Locations
Domain: Core ABoVE
Grid cells: Ah2Av2.Bh14Bv14.Ch87Cv88, Ah2Av2.Bh14Bv14.Ch87Cv89, Ah2Av2.Bh14Bv15.Ch87v90, Ah2Av2.Bh15Bv15.Ch95v95, Ah2Av2.Bh15Bv16.Ch94v96, Ah2Av2.Bh15Bv16.Ch92Cv97, Ah2Av2.Bh15Bv16.Ch93Cv97, Ah2Av2.Bh15Bv16.Ch94Cv97, Ah2Av2.Bh15Bv16.Ch91Cv99, Ah2Av2.Bh15Bv16.Ch91Cv100, Ah2Av2.Bh15Bv16.Ch92Cv100, Ah2Av2.Bh15Bv16.Ch91Cv101
Spatial Resolution: 30 x 30m quadrat paired with 30 x 2m belt transect
Temporal Coverage: Sampling between 2016-05-30 to 2016-06-16
Temporal Resolution: Each site was sampled once
Study Areas (All latitude and longitude given in decimal degrees)
| Site | Westernmost Longitude | Easternmost Longitude | Northernmost Latitude | Southernmost Latitude |
|---|---|---|---|---|
| Central Saskatchewan, Canada | -109.173 | -104.693 | 57.365 | 54.091 |
Data File Information
There is one data file in comma-separated (.csv) format with this data set:
boreal_vegplots_c_combustion.csv: This file provides site geophysical characteristics, forest composition, above-and below-ground carbon stocks, and wildfire combustion values. The file is sorted by burned and then by plot_id. Note that several fire-related variables and “_postfire_” quantities do not apply to the unburned plots; these values are set to missing. Missing values are represented by -9999.
Table 1. Variables in the file boreal_vegplots_c_combustion.csv.
| Column Name | Units | Description |
|---|---|---|
| plot_id | Plot identifier with appended “B” for burned or “C” for unburned control plot. | |
| burned | Designation as a burned (1) or unburned (0) control stand | |
| longitude | Decimal degrees | Plot longitude |
| latitude | Decimal degrees | Plot latitude |
| sample_date | YYYY-MM-DD | Sample date |
| ecozone | Ecozone: Shield or Plains | |
| elevation | meters above sea level | Plot elevation |
| aspect | Radians | Plot aspect |
| slope | Radians | Plot slope |
| moisture | Six-point soil moisture classification: xeric, subxeric, subxeric to mesic, mesic, mesic to subhygric, and subhygric | |
| moisture_cond_3 | Soil moisture classification, condensed to three classes: xeric, mesic, subhygric | |
| burn_date_julian | Julian Days | Julian day plot burned in 2015 |
| comp_burn_index | Composite burn index | |
| fire_id | Fire scar name from the Canadian National Fire Database | |
| dominance | Plot stand dominance: coniferous, deciduous, mixed | |
| stand_age | Years | Plot stand age from tree ring analysis |
| stand_age_cond | Plot stand age classified as Mature (>60 yrs), Intermediate (20-60 yrs), or Young (<20 yrs) | |
| origin | Stand origin history: Harvest or Fire | |
| density | Stems m-2 | Number of trees per m2. total_abundance divided by 60 m2 of belt transect. |
| principlecomp_analysis_abundance | Principle component scores from vegetation abundance data | |
| unknown_pct | Percent | Percent cover of unknown tree species |
| blackspruce_pct | Percent | Percent cover of black spruce trees |
| jackpine_pct | Percent | Percent cover of jack pine trees |
| tamarack_pct | Percent | Percent cover of tamarack trees |
| paperbirch_pct | Percent | Percent cover of paper birch trees |
| trembling_aspen_pct | Percent | Percent cover of trembling aspen trees |
| greenalder_pct | Percent | Percent cover of green alder trees |
| willow_pct | Percent | Percent cover of willow tree species |
| whitespruce_pct | Percent | Percent cover of white spruces trees |
| balsamfir_pct | Percent | Percent cover of balsam fir trees |
| balsampoplar_pct | Percent | Percent cover of balsam popular trees |
| conifer_pct | Percent | Percent cover of conifer trees |
| deciduous_pct | Percent | Percent cover of deciduous, broad-leafed trees |
| shrub_pct | Percent | Percent cover of shrubs (diameter < 5cm) |
| unknown_abundance | Abundance | Abundance of unknown tree species |
| blackspruce_abundance | Abundance | Abundance of black spruce trees |
| jackpine_abundance | Abundance | Abundance of jack pine trees |
| tamarack_abundance | Abundance | Abundance of tamarack trees |
| paperbirch_abundance | Abundance | Abundance of paper birch trees |
| trembling_aspen_abundance | Abundance | Abundance of trembling aspen trees |
| greenalder_abundance | Abundance | Abundance of green alder trees |
| willow_abundance | Abundance | Abundance of willow tree species |
| whitespruce_abundance | Abundance | Abundance of white spruces trees |
| balsamfir_abundance | Abundance | Abundance of balsam fir trees |
| balsampoplar_abundance | Abundance | Abundance of balsam poplar trees |
| total_abundance | Abundance | Abundance of all trees |
| adventitious_roots | Presence of adventitious roots at the site, Yes(Y)/No(N) | |
| prefire_soil_depth | cm | Organic soil depth pre-fire |
| prefire_soil_depth_se | cm | Uncertainty of organic soil depth pre-fire |
| postfire_soil_depth | cm | Organic soil depth post-fire |
| postfire_org_soil_depth_se | cm | Uncertainty of organic soil depth post-fire |
| soil_burn_depth | cm | Organic soil depth of burn |
| soil_burn_depth_se | cm | Uncertainty of organic soil depth of burn |
| bg_prefire_c | kg C m-2 | Organic soil carbon stocks pre-fire |
| bg_prefire_c_se | kg C m-2 | Uncertainty of organic soil carbon stocks pre-fire |
| bg_postfire_c | kg C m-2 | Organic soil carbon stocks post-fire |
| bg_postfire_c_se | kg C m-2 | Uncertainty of organic soil carbon stocks post-fire |
| bg_combusted_c | kg C m-2 | Combusted organic soil carbon stocks |
| bg_combusted_c_se | kg C m-2 | Uncertainty of combusted organic soil carbon stocks |
| tree_prefire_biomass | g | Tree biomass pre-fire |
| tree_postfire_biomass | g | Tree biomass post-fire |
| tree_combusted_biomass | g | Combusted tree biomass |
| tree_prefire_c | kg C m-2 | Carbon stocks in tree biomass pre-fire |
| tree_postfire_c | kg C m-2 | Carbon stocks in tree biomass post-fire |
| tree_combusted_c | kg C m-2 | Combusted carbon stocks in tree biomass |
| cwd_prefire_c | kg C m-2 | Carbon stocks in coarse woody debris (CWD) pre-fire |
| cwd_postfire_c | kg C m-2 | Carbon stocks in coarse woody debris (CWD) post-fire |
| cwd_combusted_c | kg C m-2 | Combusted carbon stocks in coarse woody debris (CWD) |
| ag_prefire_c | kg C m-2 | Carbon stocks aboveground (trees + CWD) pre-fire |
| ag_prefire_sd | kg C m-2 | Uncertainty of carbon stocks aboveground (tree + CWD) pre-fire |
| ag_postfire_c | kg C m-2 | Carbon stocks aboveground (trees + CWD) post-fire |
| ag_combusted_c | kg C m-2 | Combusted carbon stocks aboveground (trees + CWD) |
| ag_combusted_c_sd | kg C m-2 | Uncertainty of combusted carbon stocks aboveground (trees + CWD) |
| total_prefire_c | kg C m-2 | Total carbon stocks (trees + CWD + soils) pre-fire |
| total_prefire_c_se | kg C m-2 | Uncertainty of total carbon stocks (trees + CWD + soils) pre-fire |
| total_postfire_c | kg C m-2 | Total carbon stocks (trees + CWD + soils) post-fire |
| total_combusted_c | kg C m-2 | Total combusted carbon stocks (trees + CWD + soils) |
| total_combusted_c_se | kg C m-2 | Uncertainty of total combusted carbon stocks (trees + CWD + soils) |
Application and Derivation
Understanding the factors that govern carbon accrual and combustion losses across the boreal region are important for predicting future radiative forcing effects on the climate system. This study directly addresses this knowledge gap by identifying stand age, soil moisture class, and ecozone as key drivers of carbon dynamics in boreal Saskatchewan (Dieleman et al., 2020).
Quality Assessment
Uncertainty estimates were generated for core measures of carbon stocks and combustion rates using a combination of Monte Carlo techniques paired with classic uncertainty propagation methods (Dieleman et al., 2020).
Data Acquisition, Materials, and Methods
The 79 study sites were located in central Saskatchewan, Canada near the La Ronge and Weyakwin communities.The sites spanned three distinct wildfires (Egg, Philion, Brady), two ecozones (Boreal Plains, Boreal Shield), two stand replacing history types (fire, timber harvest), three soil moisture classes (xeric, mesic, subhygric), and three stand dominance classifications (coniferous, deciduous, mixed). Sites were selected using a stratified random sampling design to represent potential important dimensions of carbon stock variation in the southern Canadian boreal. For every pre-selected, potential burned site, a corresponding 30-m unburned site was selected within a subsample surrounding each fire scar for those that had similar tree cover (± 3% based on Hansen et al. (2013)), slope (± 0.5º), and the same aspect quadrant (N, E, S, W, or flat) according to the Canadian Digital Elevation Model (CDEM; Government of Canada, 2016). Ecozone was derived from the Ecological Framework of Canada (Ecological Stratification Working Group, 1995), and historical fire perimeters since 1945 were from the Canadian National Fire Database (Stocks et al., 2003).
In the field, 47 random burned sites chosen from the pre-selected site pool were sampled and 32 unburned sites in the field were chosen to best match conditions at sampled burned sites (Dieleman et al., 2020).
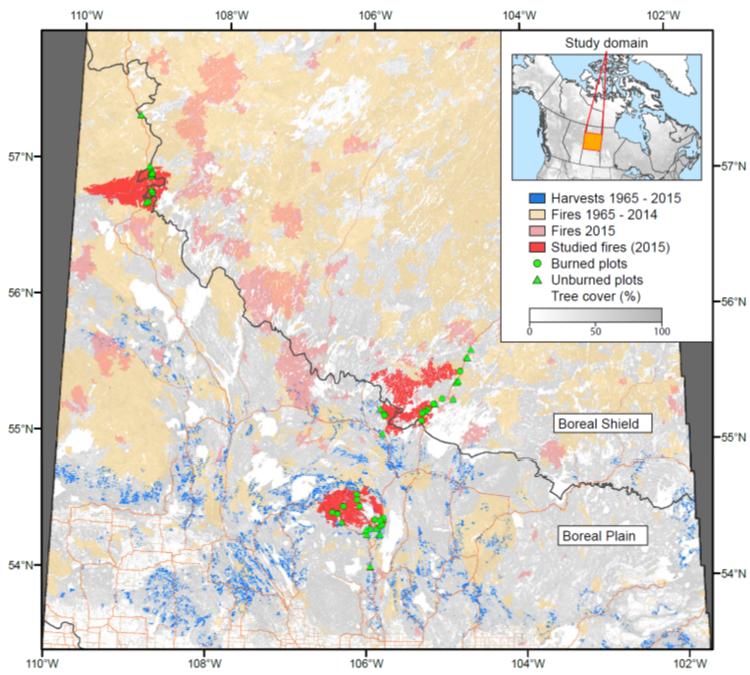
Figure 2. Study domain within the southern boreal forest of central Saskatchewan, Canada. From Dieleman et al., 2020.
Field measurements
At all sites, a 30-m × 30-m quadrat was established with a 2-m × 30-m belt transect oriented from north to south intersecting the site’s center. At each site's center, a high-precision GPS receiver (GeoExplorer 6000 series GeoXH GPS device, Trimble, Sunnyvale, CA; 0.3 – 1.4 m horizontal and 0.5 – 1.7 m vertical errors at the sites) was used to record latitude, longitude, elevation, and aspect, and a clinometer to determine slope. Site moisture was classified according to a six-point scale defined by Johnstone et al. (2008) (xeric, subxeric, subxeric to mesic, mesic, mesic to subhygric, and subhygric), using site-level observations of topographic position, permafrost prevalence, and soil texture. The soil moisture classes were condensed into three categories: xeric (xeric + subxeric), mesic (subxeric to mesic + mesic), and subhygric (mesic to subhygric + subhygric).
The belt transect was used to characterize both the soil environment and vegetation community. Organic soil depth was measured approximately every three meters along the transect (6 – 10 equally-spaced measures per site). To determine organic soil carbon stocks, complete organic soil profiles (5-cm × 10-cm area) were harvested volumetrically approximately every 6 meters (3 – 5 equally-spaced measures per site) using sharp bread knives and shears. The cores were subdivided in the field by soil horizon class including live moss, dead moss, fibric, mesic, and humic layers. Regenerated vegetation and unscorched litter above the ash layer were excised from the surface layer of the soil core at burned sites, as it represented biomass accumulated after the fire event. Where possible, the organic soil depth also was determined under 10 spruce trees along the transect to calculate pre-fire organic depths in relationship to adventitious root depth. The distance from the uppermost adventitious root down to the surface of the mineral soil was measured at one to three locations per tree. At unburned sites, the distance from the uppermost adventitious root to the surface of the organic soil was measured.
For every tree with at least 50% of its visible rooting system within the 2-m wide transect, the species and mortality status (i.e. alive, post-fire mortality, fire mortality, pre-fire mortality, unknown) were recorded, and the consumption of the tree fuels using a five-point scale was visually assessed. Using tree species abundance data, stands were classified as ‘Coniferous’ if >50% of the individual trees were needle-leaf species and ‘Broadleaf’ if >50% of the individual trees were flat-leaved deciduous species, otherwise stands were classified as ‘Mixed’. Tree diameter at breast height (DBH) was recorded for all individuals greater than 1.3 m in height, and basal diameter (D0) for shorter trees. To determine stand age cores or disks were collected from 2 – 4 trees of the dominant cohort within each site. Samples were taken from the base of the dominant tree species within the site and stored for further processing.
To estimate coarse woody debris (CWD) a linear transect (East side of the 2 × 30-m belt) was used to estimate the cross-sectional area of CWD. For every piece of CWD decay class (sound, soft, crumbly) as well as the major and minor axis of the ellipse intersecting our line transect, applying a minimum diameter threshold of 5 cm. were recorded. Within burned sites, the percent consumption at the site-level that produced the remaining amount of CWD was visually estimated. Finally, the Composite Burn Index (CBI; Key & Benson, 2005) was assigned for each site, modified for burned environments in the North American boreal (Kasischke et al., 2008; Rogers et al., 2014) (Dieleman et al., 2020).
Soil processing and analysis
To determine organic soil carbon content, 339 complete organic soil profiles were analyzed from the burned and unburned sites. The remaining materials were then oven dried at 65°C and bulk density was subsequently calculated as the soil dry mass divided by the soil volume as measured in the field (kg soil m-3). Following drying, soil samples were ground to achieve full homogenization. To determine loss on ignition (LOI), 1-g soil subsamples were weighed into pre-fired porcelain crucibles and re-dried at 65°C for approximately 18 hours. The samples were then reweighed and ignited in a muffle furnace at 550°C for four hours before the final weight was recorded. LOI (%) was then calculated as the difference in mass in the pre- versus post-ignition weights multiplied by 100.
To determine percent soil carbon, a subset of 58 soil subsamples were processed on an elemental analyzer (630-100-100 TruSpec CN Analzyer, LECO Corporation, St. Joseph, MI). These 58 subsamples spanned the range of organic soil types and LOI values observed in this study. A regressive linear relationship was built between the percent carbon and LOI values for these 58 subsamples (C% = 0.444 × LOI + 4.883; R2 = 0.89; p < 0.001), which was then used to calculate percent carbon for the remainder of the soil samples. Soil carbon content (kg C m-2) was determined by multiplying sample bulk density by its percent carbon and depth. Samples from the same soil profile were then summed together to determine cumulative organic soil carbon stocks.
Pre-fire soil depths were estimated using two approaches: (i) adventitious root height at sites with spruce trees and (ii) a mixed-effects model for sites without spruce species (19 of the 47 burned stands). For sites with spruce trees, a linear regression model was developed relating the average organic soil depth at unburned sites to their respective average adventitious root height above the mineral soil (pre-fire organic soil depth = 1.080 × adventitious root height above mineral + 0.956; R2 = 0.94; p < 0.001). For stands without spruce species (19 of the 47 burned stands), pre-fire organic soil depth was calculated using a mixed-effects model relating the average organic soil depth at unburned sites to predictive landscape variables. Nine predictors were tested for collinearity and removed if a significant relationship was found (Spearman’s p < 0.5).
Post-fire organic soil carbon stocks were calculated for each site by averaging the carbon stocks from the 3 to 5 cores collected within each burned site. Combusted organic soil carbon values were determined via a mixed-effects model, considering ecozone, transformed soil depth, soil moisture class, and stand dominance type. Depth of burn of the organic soil layer was input to the resultant model in place of soil depth to calculate combusted carbon emitted from the organic soil layer. Pre-fire carbon stocks at burned sites were calculated as the sum of post-fire and combusted organic carbon stocks. For simplicity, organic soil carbon is referred to as ‘belowground’ carbon (Dieleman et al., 2020).
Vegetation processing and analysis
To quantify stand age, tree cores and disks were processed using standard dendrochronology techniques. The oldest representative tree age from each stand was compared to digital spatial records of historical fire and harvest events. When both tree age and the historical records were within 10% of each other, the ages from the historical records (23 of the 79 sites) were used. When the biological and historical records did not coincide, or historical records did not exist, the oldest tree core that was representative of the stand was used to age the site (41 of the 79 sites). Finally, historical records were used to age the stand when tree cores could not be collected, or those collected were exceptionally poor quality (15 of the 79 sites).
To calculate the carbon stocks and fluxes attributed to trees, their biomass was calculated using a suite of D0- and DBH-based allometric equations. These equations were used to estimate the biomass associated with total, stem, bark, branches, and foliage pools. To estimate carbon stocks and emissions associated with trees, the estimated combustion levels were then related to each biomass pool and a mean carbon fraction was assumed for woody plants 0.50 (Thomas and Martin, 2012).
To estimate carbon stocks and combustion losses in CWD, site-level CWD volume (cm3 m-2) by decay class (sound, soft, or crumbly) was calculated from the two-dimensional transects by dividing the cross-sectional area for each decay class by the length of the transect (30 m). Density values from previous studies were used to estimate CWD mass (kg m-2) and assumed a mean carbon fraction of 0.50 to estimate carbon stocks (kg C cm-2). Because it was hard to discern the species of most CWD, the relative proportion of basal area was used from each tree species recorded in the 2 x 30-m transect to linearly interpolate between relevant species-specific parameters. Combusted CWD (kg C cm-2) was estimated as:
CWD Combustion = %Combustion/100 x (CWD Postfire)
(100-%Combustion)
Where % Combustion = Estimated site-level combustion
For simplicity, the combined carbon associated with the CWD and tree pools is referred to as ‘aboveground’ carbon (Dieleman et al., 2020).
Data Access
These data are available through the Oak Ridge National Laboratory (ORNL) Distributed Active Archive Center (DAAC).
ABoVE: Characterization of Burned and Unburned Boreal Forest Stands, SK, Canada, 2016
Contact for Data Center Access Information:
- E-mail: uso@daac.ornl.gov
- Telephone: +1 (865) 241-3952
References
Dieleman, C.M., B.M. Rogers, S. Veraverbeke, J.F. Johnstone, J. Laflamme, L.Gelhorn, K. Solvik, X.J. Walker, M.C. Mack, and M.R. Turetsky. Wildfire combustion and carbon stocks in the southern Canadian boreal forest: Implications for a warming world. (in process, 2020).
Ecological Stratification Working Group. (1995). A National Ecological Framework for Canada. Ottawa, ON: Canada. Canadian Soil Information System (CANSIS).
Government of Canada (2016) Canadian Digital Elevation Model, Retrieved from https://open.canada.ca/data/en/dataset/7f245e4d-76c2-4caa-951a-45d1d2051333, 2016
Hansen, M.C., P.V. Potapov, R. Moore, M. Hancher, S.A. Turubanova, A. Tyukavina, S. Thau, S.V. Stehman, S.J. Goetz, T.R. Loveland, A. Kommareddy, A. Egorov, L. Chini, C.O. Justice, and J.R.G. Townshend. (2013). High-Resolution Global Maps of 21st-Century Forest Cover Change, Science, 342, 850–853. https://doi.org/10.1126/science.1244693.
Johnstone, J.F., T.N. Hollingsworth, and F.S Chapin. (2008). A Key Predicting Postfire Successional Trajectories in Black Spruce Stands of Interior Alaska (General Technical Report NO. PNW-GTR-767). Portland, OR: U.S. U.S. Department Agriculture.
Kasischke, E.S., M.R. Turetsky, R.D. Ottmar, N.H. French, E.E. Hoy, and E. Kane. (2008). Evaluation of the composite burn index for assessing fire severity in Alaskan black spruce forests. Wildland Fire, 17, 515-526. https://doi.org/10.1071/WF08002
Key, C.H., and N.C. Benson. (2005). Landscape assessment: ground measure of severity, the composite burn index; and remote sensing of severity, the normalized burn ratio. In D.C. Lutes, R.E. Keane, J.F. Caratti, C.H. Key, N.C. Benson, S. Sutherland, and L.J. Gangi, (Eds.). FIREMON: fire effects monitoring and inventory system (pp. 25-36). Ogden, UT: USDA Forest Service, Rocky Mountain Monitoring and Inventory System.
Rogers, B.M., S. Veraverbeke, G. Azzari, C.I. Czimczik, S.R. Holden, G.O. Mouteva, F. Sedano, K.K. Treseder, and J.T. Randerson. (2014). Quantifying fire-wide carbon emissions in interior Alaska using field measurements and Landsat imagery. Journal of Geophysical Research: Biogeosciences, 119, 1608-1629. https://doi.org/10.1002/2014JG002657
Stocks, B.J., Mason, J.A., J.B. Todd, E.M. Bosch, B.M. Wotton, B.D. Amiro, M.D. Flannigan, K.G. Hirsch, K.A. Logan, D.L. Martell, and W.R. Skinner. (2003). Large forest fires in Canada, 1959-1997. Journal of Geophysical Research, 108, 1-5. https://doi.org/10.1029/2001JD000484
Thomas, Sean C.; Martin, Adam R. 2012. "Carbon Content of Tree Tissues: A Synthesis." Forests 3, no. 2: 332-352. https://doi.org/10.3390/f3020332