Documentation Revision Date: 2019-09-12
Dataset Version: 1
Summary
There are three soil CO2 flux data files in netCDF (*.nc4) format: one for the baseline period, and one each for the RCP 4.5 and RCP 8.5 future periods. Supplemental data files of (1) vegetation land cover to allow spatial delineation of fluxes according to land cover types used in the modeling and (2) a fractional lake map to calculate terrestrial land area for each pixel used to obtain total budget estimates (gCO2-C) for each pixel are provided in GeoTIFF (*.tif) format. There are also 19 data quality files in GeoTIFF (*.tif) format, with average NGS estimate error for both Baseline and Future Climate BRT simulations.
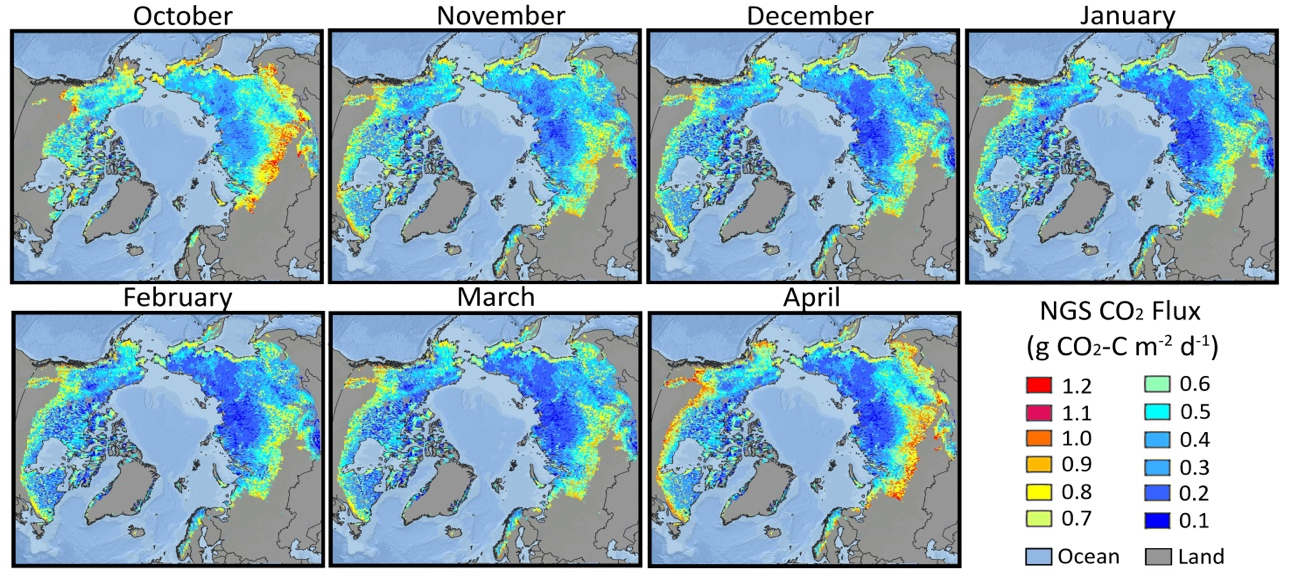
Figure 1. Soil CO2 flux estimates for the Arctic-boreal permafrost region, during the non-growing season (NGS), Julian days 274 through 120. (Source J.D. Watts)
Citation
Watts, J.D., S. Natali, S. Potter, and B.M. Rogers. 2019. Gridded Winter Soil CO2 Flux Estimates for pan-Arctic and Boreal Regions, 2003-2100. ORNL DAAC, Oak Ridge, Tennessee, USA. https://doi.org/10.3334/ORNLDAAC/1683
Table of Contents
- Dataset Overview
- Data Characteristics
- Application and Derivation
- Quality Assessment
- Data Acquisition, Materials, and Methods
- Data Access
- References
Dataset Overview
This dataset provides gridded estimates of soil CO2 flux (g C m-2 d-1) for the winter non-growing season (NGS) across pan-Arctic and Boreal permafrost regions (>49 Deg N), at 25 km spatial resolution. The data are the daily average flux over a monthly period for two climate periods: the baseline climate period represents 2003-2018 and the future climate scenarios period represents 2018-2100 under Representative Concentration Pathways (RCP) 4.5 and 8.5. The data were produced by applying a Boosted Regression Tree machine learning approach to create gridded estimates of emissions based on in situ observations of NGS fluxes provided in a related dataset. The resulting monthly average flux data records can be used to calculate annual NGS soil CO2 flux budgets from 2003-2100.
Project: Arctic-Boreal Vulnerability Experiment
The Arctic-Boreal Vulnerability Experiment (ABoVE) is a NASA Terrestrial Ecology Program field campaign conducted in Alaska and western Canada between 2016 and 2021. Research for ABoVE links field-based, process-level studies with geospatial data products derived from airborne and satellite sensors, providing a foundation for improving the analysis, and modeling capabilities needed to understand and predict ecosystem responses to, and societal implications of, climate change in the Arctic and Boreal regions.
Related Publication:
Natali, S. J.D. Watts, S. Potter, B.M. Rogers, and S.M. Ludwig et al., 2019. Large loss of CO2 in winter observed across the northern permafrost region. Nature Climate Change.
Related Dataset:
Natali, S., J. Watts, S. Potter, B.M. Rogers, S. Ludwig, A. Selbmann, P. Sullivan, B. Abbott, K. Arndt, A.A. Bloom, G. Celis, T. Christensen, C. Christiansen, R. Commane, E. Cooper, P.M. Crill, C.I. Czimczik, S. Davydov, J. Du, J. Egan, B. Elberling, S.E. Euskirchen, T. Friborg, H. Genet, J. Goodrich, P. Grogan, M. Helbig, E. Jafarov, J. Jastrow, A. Kalhori, Y. Kim, J.S. Kimball, L. Kutzbach, M. Lara, K. Larsen, B. Lee, Z. Liu, M.M. Loranty, M. Lund, M. Lupascu, N. Madani, A. Malhotra, R. Matamala, J. McFarland, A. McGuire, A. Michelsen, C. Minions, W. Oechel, D. Olefeldt, F. Parmentier, N. Pirk, B. Poulter, W. Quinton, F. Rezanezhad, D. Risk, T. Sachs, K. Schaefer, N. Schmidt, E. Schuur, P. Semenchuk, G. Shaver, O. Sonnentag, G. Starr, C. Treat, M. Waldrop, Y. Wang, J. Welker, C. Wille, X. Xu, Z. Zhang, Q. Zhuang, and D. Zona. 2019. Synthesis of Winter In Situ Soil CO2 Flux in pan-Arctic and Boreal Regions, 1989-2017. ORNL DAAC, Oak Ridge, Tennessee, USA. https://doi.org/10.3334/ORNLDAAC/1692
Acknowledgements:
This research was funded as part of NASA's Arctic Boreal Vulnerability Experiment under grant number NNX15AT81A. This work was also supported by the Permafrost Carbon Network (PCN). The PCN is part of the Study of Environmental Arctic Change (SEARCH) project headed by the University of Alaska Fairbanks and Northern Arizona University. Both PCN and SEARCH seek to connect the science of Arctic change with decision makers and the main objective of PCN is to synthesize existing research about permafrost carbon and climate in a format that can be assimilated by biospheric and climate models, and that will contribute to future assessments of Intergovernmental Panel on Climate Change (IPCC).
Data Characteristics
Spatial Coverage: Permafrost landscapes in the circumpolar Arctic-boreal region of the northern hemisphere above 49 degrees latitude.
Spatial Resolution: 25 km
Temporal Coverage (YYYY-MM): Baseline: 2003-10 to 2018-04 and Future Climate: 2018-10 to 2100-04
Temporal Resolution: Monthly during the winter non-growing season of each year
Study Area: (all latitude and longitude given in decimal degrees)
|
Site |
Westernmost Longitude |
Easternmost Longitude |
Northernmost Latitude |
Southernmost Latitude |
|---|---|---|---|---|
|
Arctic-Boreal Region |
-180.00 |
179.90 |
89.98 |
-84.69 |
Data File Information:
There are three soil CO2 flux data files in netCDF format: one for the baseline period, and one each for the RCP 4.5 and 8.5 future periods. Ancillary data files of (1) vegetation land cover to allow spatial delineation of fluxes according to land cover types used in the modeling and (2) a fractional lake map to calculate terrestrial land area for each pixel used to obtain total budget estimates (gCO2-C) for each pixel are provided in GeoTIFF (*.tif) format. There are also 19 data quality files in GeoTIFF (*.tif) format, with average NGS estimate error for both Baseline and Future Climate simulations.
| Filename | Description |
|---|---|
| Flux Data | |
| Baseline.Soil.CO2.Flux.2003-2017.nc4 | Daily average flux (gCO2-C m-2 d-1) over a monthly period for baseline period 2003-2018 |
| RCP45.Soil.CO2.Flux.2017-2100.nc4 | Daily average flux (gCO2-C m-2 d-1) over a monthly period for RCP 4.5 future climate period 2017-2100 |
| RCP85.Soil.CO2.Flux.2017-2100.nc4 | Daily average flux (gCO2-C m-2 d-1) over a monthly period for RCP 8.5 future climate period 2017-2100 |
| Quality Files | |
| Baseline.Soil.CO2.QA.0310.tif | Contains average NGS estimate error ( gCO2-C m-2 d-1) for Baseline BRT simulations for years 2003 through 2010. |
| Baseline.RCP45.Soil.CO2.QA.1020.tif | Contains average NGS estimate error ( gCO2-C m-2 d-1) representing Baseline and RCP 4.5 future climate BRT simulations for years 2010 through 2020. |
| Baseline.RCP85.Soil.CO2.QA.1020.tif | Contains average NGS estimate error ( gCO2-C m-2 d-1) representing Baseline and RCP 8.5 future climate BRT simulations for years 2010 through 2020. |
| RCP45.Soil.CO2.QA.2030.tif | Contains average NGS estimate error( gCO2-C m-2 d-1) for RCP 4.5 future climate BRT simulations for years 2020 through 2030. |
| RCP45.Soil.CO2.QA.3040.tif | … for years 2030 through 2040. |
| RCP45.Soil.CO2.QA.4050.tif | … for years 2040 through 2050. |
| RCP45.Soil.CO2.QA.5060.tif | … for years 2050 through 2060. |
| RCP45.Soil.CO2.QA.6070.tif | … for years 2060 through 2070. |
| RCP45.Soil.CO2.QA.7080.tif | … for years 2070 through 2080. |
| RCP45.Soil.CO2.QA.8090.tif | … for years 2080 through 2090. |
| RCP45.Soil.CO2.QA.9000.tif | … for years 2090 through 2100. |
| RCP85.Soil.CO2.QA.2030.tif | Contains average NGS estimate error (gCO2-C m-2 d-1) for RCP 8.5 future climate BRT simulations for years 2020 through 2030. |
| RCP85.Soil.CO2.QA.3040.tif | … for years 2030 through 2040. |
| RCP85.Soil.CO2.QA.4050.tif | … for years 2040 through 2050. |
| RCP85.Soil.CO2.QA.5060.tif | … for years 2050 through 2060. |
| RCP85.Soil.CO2.QA.6070.tif | … for years 2060 through 2070. |
| RCP85.Soil.CO2.QA.7080.tif | … for years 2070 through 2080. |
| RCP85.Soil.CO2.QA.8090.tif | … for years 2080 through 2090. |
| RCP85.Soil.CO2.QA.9000.tif | … for years 2090 through 2100. |
| Ancillary Data | |
| fractional_water.tif | Provides 25 km grid fractional water information for the Arctic-boreal study domain (and beyond). FW values of 0 indicate that lake area is absent within the 25 km pixel. FW values of 1 indicate that the 25 km pixel contains 100% water and terrestrial area is absent. The FW data are in the same format as the corresponding Spatial Data except that the data type is float 32-bit. |
| vegetation_landcover.tif | Vegetation land cover map, 25 km resolution, for the Arctic-boreal study domain (and beyond). Values indicate the dominant plant community types used to inform the BRT model simulations. The vegetation data are in the same format as the corresponding Spatial Data except that the data type is 32-bit unsigned integer. Land cover classes for the vegetation map are listed in Table 1. |
Data File Properties
Flux Data Files in NetCDF format: The no-data value = 0; Grid cells are at 25-km spatial resolution; EPSG = 6933 (EASE-GRID Version 2): All geospatial data were regridded to the National Snow and Ice Data Center Equal Area Scalable Earth (EASE) 2.0 format at a 25-km spatial resolution prior to the CO2 flux upscaling and simulations.
QA and Ancillary Files in GeoTIFF format: All GeoTIFF files contain a single band of data. The no-data value for QA files is 0 and for the ancillary files it is -9999; Grid cells are at 25-km spatial resolution; EPSG = 6933 (EASE-GRID Version 2).
Table 1. Vegetation classes for land cover provided in vegetation_landcover.tif. Pixel count indicates the number of 25 km equal area pixels for each land cover type within the study domain. Land cover represents merged Circumpolar Arctic Vegetation Map (CAVM) and Climate Change Initiative (CCI) grids.
| Source | Land Cover Code | Pixel Code | Land Cover Description | Pixel Count |
|---|---|---|---|---|
| CAVM | P2 | 1 | Prostrate dwarf shrub and forb tundra | 739 |
| CAVM | S1 | 2 | Erect dwarf shrub tundra | 1166 |
| CAVM | S2 | 3 | Erect low shrub tundra | 920 |
| CAVM | G1-G4 | 4 | Graminoid tussock and non-tussock (sedge, moss, minimal shrub) | 2078 |
| CAVM | W1 | 5 | Wet sedge, grass and moss tundra | 129 |
| CAVM | W2 | 6 | Wet sedge, shrub and moss tundra | 413 |
| CAVM | NMC | 7 | Noncarbonate mountain complex (barren; minimal plant cover) | 723 |
| CAVM | CMC | 8 | Carbonate mountain complex (barren; minimal plant cover) | 33 |
| CCI | SBV | 9 | Sparse boreal vegetation (tree, shrub, herb) | 6922 |
| CCI | BDF | 10 | Deciduous broadleaved forest, closed to open canopy | 484 |
| CCI | DNF | 11 | Deciduous needle leaf forest, closed to open canopy | 7322 |
| CCI | ENLF | 12 | Evergreen needle leaf forest, closed to open canopy | 6952 |
| CCI | BSW | 13 | Shrub or herb cover, flooded | 1372 |
| Total | 29,253 |
Application and Derivation
The dataset provides gridded average monthly soil carbon fluxes (gCO2-C m-2 d-1) for the NGS (October-April) over the Arctic-boreal region from 2003-2100. The gridded fluxes were used to obtain regional NGS soil CO2 emission budgets (gCO2-C; Figure 3). The budgets can be used in baseline comparisons against estimates from regional process-based and Earth System models.
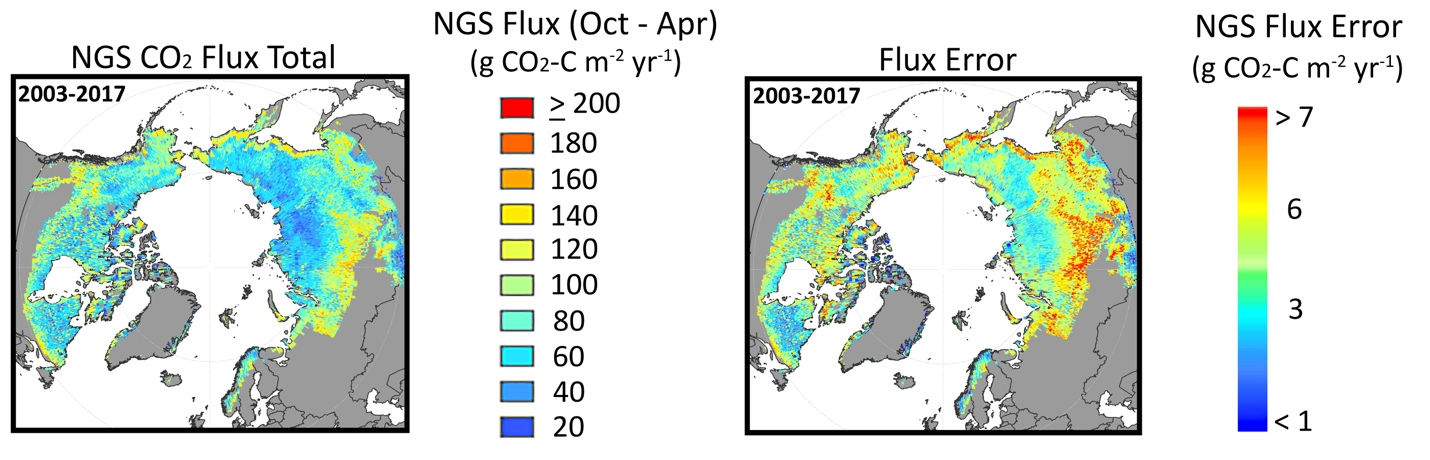
Figure 2. Average per-pixel soil CO2 emission budgets for the NGS, years 2003-2017. Pixels represent 25 km equal area grids. Source J. Watts.
Quality Assessment
The data set was generated using the “In-situ nongrowing-season CO2 flux synthesis dataset for the northern Arctic-Boreal permafrost domain” compilation of NGS (October-April) soil flux records. Over 1,000 flux observations were collected from literature and data records, spanning the period 1989 to 2016. The in-situ soil fluxes are reported in gCO2-C m-2 d-1 averaged over a monthly observation period and were collected for permafrost regions within the Arctic-boreal domain (>49 °N) using flux chamber, chamber-snow, diffusion, soda lime and eddy covariance methods. The fluxes characterize loss of CO2 from the soil to the atmosphere stemming from soil respiration (heterotrophic and root autotrophic) processes.
Data Acquisition, Materials, and Methods
The data set was generated using data from 'Synthesis of Winter In Situ Soil CO2 Flux in pan-Arctic and Boreal Regions, 1989-2017' (https://doi.org/10.3334/ORNLDAAC/1692 ), a compilation of NGS (October-April) soil flux records. The in-situ soil fluxes are reported in gCO2-C m-2 d-1 averaged over a monthly observation period and were collected for permafrost regions within the Arctic-boreal domain (>49 °N) using flux chamber, chamber-snow, diffusion, soda lime and eddy covariance methods. The flux measurements characterize loss of CO2 from the soil to the atmosphere stemming from soil respiration (heterotrophic and root autotrophic) processes. Over 1,000 flux observations were collected from literature and data records, spanning the period 1989 to 2016.
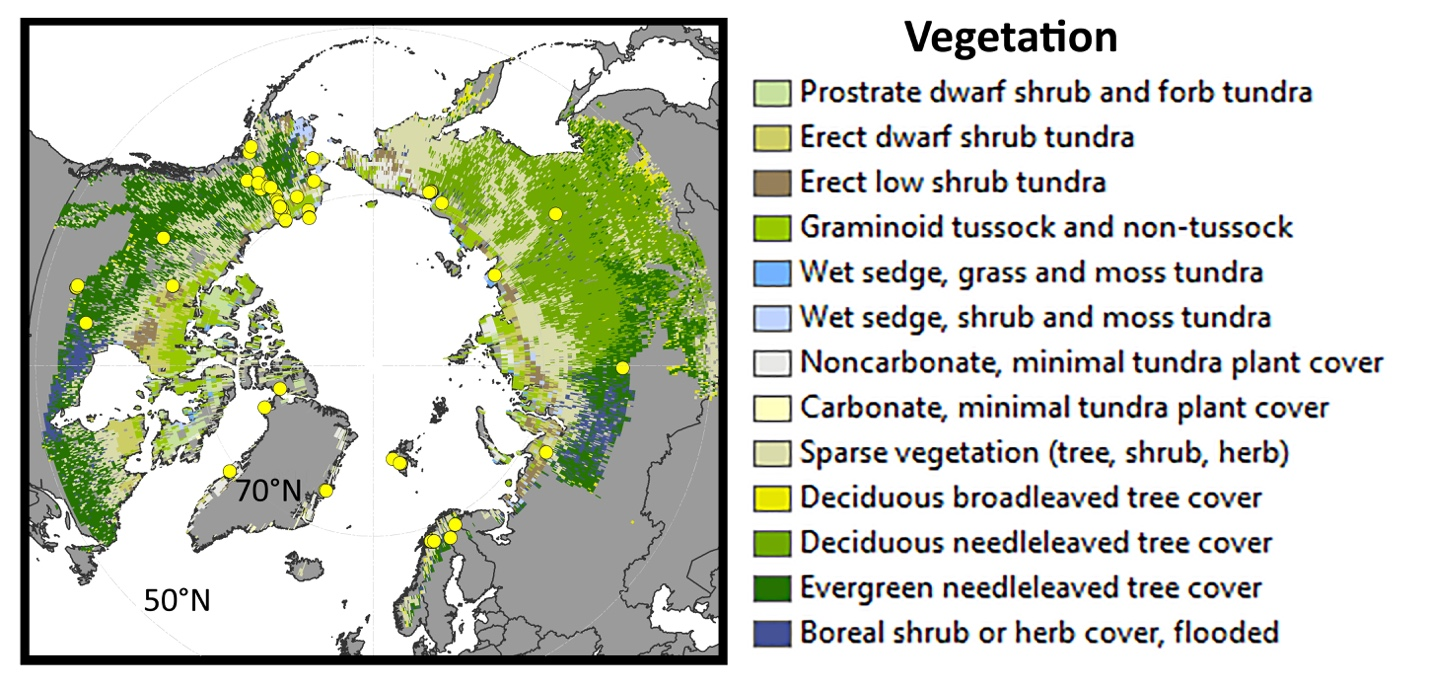
Figure 3. Land cover classes used in the model simulations. Yellow circles indicate the locations of soil CO2 flux measurements used to develop the model. Source J. Watts.
The fluxes were scaled to the Arctic-boreal permafrost domain (>49°N), which includes 16.95 x 10⁶ km2 of tundra and boreal forest lands, using a boosted-regression tree (BRT) machine learning approach. A summary of satellite remote sensing, reanalysis and ancillary geospatial inputs used as predictors in the baseline climate (years 2003-2018) BRT models are provided in Table 2. These predictors include merged Circumpolar Arctic Vegetation Map (CAVM) and Climate Change Initiative (CCI) vegetation cover (Table 1; Figure 1). Inputs from global SoilGrids maps include sand, clay and organic carbon properties. Inputs from satellite remote sensing include Moderate Resolution Imaging Spectroradiometer (MODIS) leaf area index and tree cover; Soil Moisture Active Passive (SMAP) vegetation gross primary productivity; Advanced Microwave Scanning Radiometer (AMSR) surface and litter soil moisture. Inputs from reanalysis include Modern-Era Retrospective analysis for Research and Applications Version 2 (MERRA2) air temperature at 2 m and layer 1 soil temperature. The MODIS derived fractional lake cover was used to determine terrestrial land area for CO2 budget calculations following the BRT flux simulations.
Table 2. Input predictor datasets used for BRT mapping of “baseline” (2003-2018) climate years. *Lake fraction cover is used to calculate per-pixel terrestrial area for CO2 emission budget calculations.
| Variable | Description | Native Resolution | Source | Reference |
|---|---|---|---|---|
| Land Cover | Vegetation type | 1 km | CAVM/CCI | 1, 2 |
| MODIS LAI | Annual summer max. leaf area index (m2/m2) | MODIS | 3 | |
| MODIS Tree Cover | Annual tree cover (%) | 500 m | MODIS | 4 |
| Lake Cover* | Fractional lake cover (%) within grid cell | 250 m | MODIS | 5 |
| % Sand | Soil sand content (percent) in top 30 cm | 250 m | Soil Grids | 5 |
| % Clay | Soil clay content (percent) in top 30 cm | 250 m | Soil Grids | 5 |
| Soil Organic Carbon | Organic carbon stock (kgC/m2) in top 30 cm | 250 m | Soil Grids | 6 |
| GPP | Annual summed vegetation gross primary productivity (GPP; gC/m2/yr) | 9 km | SMAP Level 4 Carbon | 7 |
| Air Temperature | Average air temp (K) at 2 m height during measurement month | 1/2 x 2/3º | MERRA2 | 8 |
| Soil Temperature | Average layer 1 soil temp. (K) during measurement month | 1/2 x 2/3º | MERRA2 | 8 |
| Soil Moisture | Average surface soil moisture (cm3/cm3) during measurement month | 25 km | AMSRE | 9 |
| Soil Moisture | Average surface soil moisture (cm3/cm3) for prior June-July period | 25 km | AMSRE | 9 |
1Walker et al. 2005, 2ESA 2014, 3Myneni et al. 2015, 4Hansen et al. 2003, 5Carroll et al. 2017, 6Hengl et al. 2017, 7Jones et al. 2017, 8Reichle et al. 2017, 9Du et al. 2017
Geospatial predictors used for future climate scenarios are summarized in Table 3 and were obtained from ensemble (version r1i1p1) Earth System Model (ESM) outputs from the Fifth Coupled Model Intercomparison Project (CMIP5; Knutti et al. 2013) for RCPs 4.5 and 8.5. The RCP 4.5 assumes a peak in greenhouse gas emissions around 2040 and stabilized Earth radiative forcing at 4.5 Watts m-2 at year 2100; emissions in RCP 8.5 continue to rise during the 21st century with a global radiative forcing of 8.5 Watts m-2 at year 2100. Tree cover and fractional lake cover used in future climate scenario BRT analysis were taken from average baseline climate conditions as they were not available in CMIP5 ESM outputs.
BRT model performance was determined using correlations between predicted and observed values using training flux observations withheld during model fitting, and the deviance explained by the model relative to the point-based flux synthesis dataset. Training data correlation (r) was 0.81 and mean correlation resulting from cross-validation was 0.71. Estimated model mean residual deviance was 0.05 gCO2-C m-2. Bootstrapped runs for 1,000 individual BRT model simulations were used to provide error maps constraining 95% confidence levels for each decadal period.
The resulting BRT model was applied on a per-month basis over the 2003-2018 baseline NGS period and from 2019-2100 over the RCP 4.5 and 8.5 future emission scenario NGS periods to produce gridded monthly average soil emission estimate maps (gCO2-C m-2 d-1) for the Arctic-boreal domain.
Table 3. Earth System Model (ESM) input datasets used for BRT mapping for “future climate” RCP 4.5 and 8.5 scenario (Jan. 2019-Apr. 2100) years. The ‘x’ indicates ESM model ensemble combinations used for each predictor.
| ESM | GPP | LAI | Air Temp. | Soil Temp. | Soil Moist. |
|---|---|---|---|---|---|
| ACCESS1-3 | x | x | x | ||
| CanESM2 | x | x | |||
| CCSM4 | x | x | x | x | |
| CMCC-CM | x | x | |||
| CNRM-CM5 | x | x | |||
| CSIRO-Mk3-6-0 | x | ||||
| GISS-E2-H | x | x | x | x | |
| GISS-E2-R | x | x | x | x | |
| HadGEM2-CC | x | x | |||
| HadGEM2-ES | x | x | |||
| IMNCM4 | x | x | x | x | x |
| MIROC5 | x | x | x | ||
| MIROC-ESM | x | x | x | ||
| MPI-ESM-LR | x | x | x | x | |
| MPI-ESM-MR | x | x | |||
| MRI-ESM1 | x | ||||
| NorEsm1-M | x | x | x | x | x |
Data Access
These data are available through the Oak Ridge National Laboratory (ORNL) Distributed Active Archive Center (DAAC).
Gridded Winter Soil CO2 Flux Estimates for pan-Arctic and Boreal Regions, 2003-2100
Contact for Data Center Access Information:
- E-mail: uso@daac.ornl.gov
- Telephone: +1 (865) 241-3952
References
Brodzik, M.J., Billingsley, B., Haran, T., Raup, B., & Savoie, M.H. Correction: Brodzik, M.J. et al. EASE-Grid 2.0: Incremental but Significant Improvements for Earth-Gridded Data Sets. ISPRS Int. J. Geo-Inform. 3, 1154-1156 (2014). https://doi.org/10.3390/ijgi1010032
Carroll, M.L. et al. Development of an operational land water mask for MODIS Collection 6, and influence on downstream data products. Int. J. Digit. Earth. 10, 207–218 (2017). https://doi.org/10.1080/17538947.2016.1232756
Du, J. et al. A global satellite environmental data record derived from AMSR-E and AMSR2 microwave Earth observations. Earth Syst. Sci. Data. 9, 791–808 (2017). https://doi.org/10.5194/essd-9-791-2017
ESA. Climate Change Initiative-Land Cover-PUG, ESA Land Cover CCI Product User Guide V2 (2014).
Hansen, M.C. Global percent tree cover at a spatial resolution of 500 meters: first results of the MODIS vegetation continuous fields algorithm. AMS, (2003). https://doi.org/10.1175/1087-3562(2003)007%3C0001:GPTCAA%3E2.0.CO;2
Hengl, T. et al., SoilGrids250m: Global gridded soil information based on machine learning. PLoS One. 12, e0169748 (2017). https://doi.org/10.1371/journal.pone.0169748
Jones, L.A. et al. The SMAP Level 4 Carbon Product for Monitoring Ecosystem Land–Atmosphere CO2 Exchange. IEEE Trans. Geosci. Remote Sens. 55, 6517–6532 (2017). http://dx.doi.org/10.1109/TGRS.2017.2729343
Knutti, R., Masson, D. & Gettelman, A. Climate model genealogy: Generation CMIP5 and how we got there. Geophys. Res. Lett. 40, 1194–1199 (2013). https://doi.org/10.1002/grl.50256
Myneni, R. et al. MOD15A2H MODIS Leaf Area Index/FPAR 8-Day L4 Global 500m SIN Grid V006. NASA EOSDIS Land Processes DAAC (2015). http://doi.org/10.5067/MODIS/MOD15A2H.006 (Terra) http://doi.org/10.5067/MODIS/MYD15A2H.006 (Aqua)
Reichle, R.H. et al., Assessment of MERRA-2 Land Surface Hydrology Estimates. J. Clim. 30, 2937–2960 (2017). https://doi.org/10.1175/JCLI-D-16-0720.1
Walker, D.A., Raynolds, M.K., Daniëls, F.J., Einarsson, E., Elvebakk, A., Gould, W.A., Katenin, A.E., Kholod, S.S., Markon, C.J., Melnikov, E.S. and Moskalenko, N.G., 2005. The circumpolar Arctic vegetation map. Journal of Vegetation Science, 16(3), pp.267-282. http://dx.doi.org/10.1111/j.1654-1103.2005.tb02365.x