Documentation Revision Date: 2023-09-07
Dataset Version: 1
Summary
There is one data file in comma-separated values format (.csv) with this dataset.
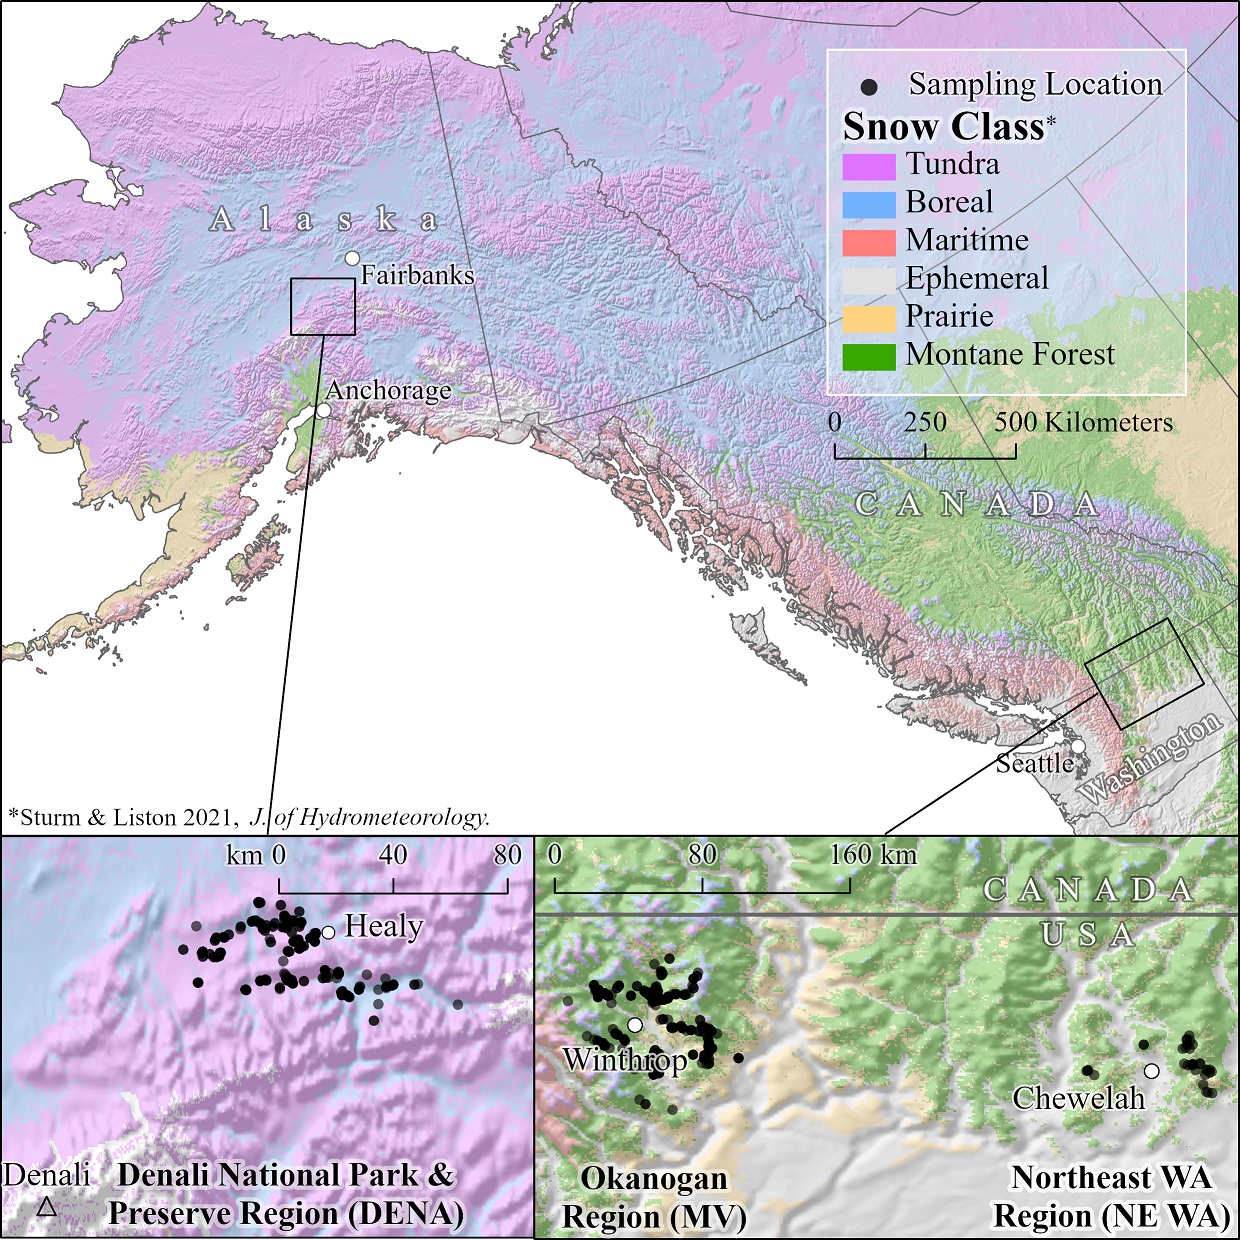
Figure 1. Study areas. The Denali study area in interior Alaska comprises mostly tundra and boreal snow. The Okanogan study area in Washington is diverse but comprised mostly montane forest. Other Okanogan snow classes are prairie and ephemeral, with some maritime on the western extremes and very limited boreal/tundra at the highest elevations. Northeast Washington contains montane forest, prairie, and ephemeral snow classes. Black points show locations of sampled snow tracks in each study area.
Citation
Sullender, B.K., C.X. Cunningham, J.D. Lundquist, and L.R. Prugh. 2023. Snow Properties and Wildlife Tracks in Washington and Alaska. ORNL DAAC, Oak Ridge, Tennessee, USA. https://doi.org/10.3334/ORNLDAAC/2188
Table of Contents
- Dataset Overview
- Data Characteristics
- Application and Derivation
- Quality Assessment
- Data Acquisition, Materials, and Methods
- Data Access
- References
Dataset Overview
This dataset is comprised of three field seasons of snow-wildlife observations, conducted at 707 sites from January 2021 to March 2023 in Northeast Washington (NE), Okanogan County/Methow Valley (MV), and Denali National Park & Preserve (DENA), spanning a broad range of snow conditions. Relatively fresh tracks (<24 hrs) of common large mammal predators (bobcats, coyotes, cougars, and wolves) and their ungulate prey (caribou, Dall sheep, moose, mule deer, and white-tailed deer) were investigated to determine how snow affects predator-prey interactions. The track sink depth and dimensions (width and length) of three consecutive footprints were measured from one individual. Age class was recorded for moose based either on visual confirmation of an individual creating snow tracks or based on track dimensions. The ability to differentiate age classes for smaller ungulates was more uncertain, so age classes for deer, caribou, or sheep were not specified. Animal gait was identified using a simple classification scheme (Rezendes, 1999). Data also include animal species, snow density, hardness, total ice, surface temperature, and vegetation type.
Penetrability was measured by dropping a 200-g cylindrical penetrometer (7-oz tuna can) from a height of 50 cm above the snow surface and then measuring its sink depth. Snow density was measured using a 1000-cc steel density cutter. Hand-hardness was measured using the hand-hardness scale. The presence (1) or absence (0) of any knife-hardness layers was determined within the top 10, 20, 30, 40, and 50 cm of the snowpack for the ice presence metric (ice_top), and the total knife-hardness layers thickness was summed to calculate total ice thickness (total_ice) within the top 10, 20, 30, 40, and 50 cm of the snowpack.
Project: Arctic-Boreal Vulnerability Experiment
The Arctic-Boreal Vulnerability Experiment (ABoVE) is a NASA Terrestrial Ecology Program field campaign being conducted in Alaska and western Canada, for 8 to 10 years, starting in 2015. Research for ABoVE links field-based, process-level studies with geospatial data products derived from airborne and satellite sensors, providing a foundation for improving the analysis, and modeling capabilities needed to understand and predict ecosystem responses to, and societal implications of, climate change in the Arctic and Boreal regions.
Related Publication
Sullender, B.K., C.X. Cunningham, J.D. Lundquist, and L.R. Prugh. 2023. Defining the danger zone: critical snow properties for predator–prey interactions. Oikos e09925. https://doi.org/10.1111/oik.09925
Acknowledgement
Funding suppport was provided by NASA Interdisciplinary Sciences (grant 80NSSC20K1291).
Data Characteristics
Spatial Coverage: Stevens County, Washington, USA; Okanogan County, Washington, USA; Denali Borough, Alaska, USA
ABoVE Reference Locations
Domain: Core ABoVE
State/Territory: Alaska
Grid cells: Ah000v000, Ah001v000, Bh005v005, Bh006v005, Ch034v033, Ch035v032, Ch035v033,
Ch035v034, Ch035v035, Ch036v033, Ch036v034, Ch036v035
Spatial Resolution: Point locations determined with ~2-m GPS accuracy.
Temporal Coverage: 2021-01-09 to 2023-03-13
Temporal Resolution: Sampling times recorded to nearest minute
Study Area: Latitude and longitude are given in decimal degrees.
| Site | Westernmost Longitude | Easternmost Longitude | Northernmost Latitude | Southernmost Latitude |
|---|---|---|---|---|
| Alaska and Washington, US | -150.00791 | -117.172166 | 63.96878 | 48.05233 |
Data File Information
There is one data file in comma-separated values format (.csv) with this dataset: Snow_Properties_Wildlife_Tracks.csv. The file has 707 observations.
Missing numeric data are reported as -9999. Missing text data are reported as NA.
Table 1. Variables in the data file.
| Field Name | Units/format | Description |
|---|---|---|
| pit_id | Unique identifier for each snowpit. | |
| region | Study region code: "NE WA" = Northeast Washington; "MV" = Okanogan County (Methow Valley), Washington; "DENA" = Denali National Park & Preserve, Alaska. | |
| date | YYYY-MM-DD | Date of observation |
| time | hh:mm:ss | Time of observation. |
| latitude | degree north | Latitude of observation in decimal degrees |
| longitude | degree east | Longitude of observation in decimal degrees |
| pair_id | If observation was conducted adjacent to and simultaneous to another observation, this sampling approach may violate the independent assumption common to some analytical frameworks. All adjacent/simultaneous observations share a pair ID. If observation is independent, pair ID is unique for that record | |
| species | Common name for wildlife species observed. Scientific names are listed below in Section 5. | |
| stride_pattern | Wildlife gait. Only includes tracks with walking, trotting, or loping stride pattern | |
| age_class | Age class of wildlife, if relevant. Obvious juveniles and adults specified; if unable to identify age class, then "Unknown" | |
| surface_temp | degrees C | Surface (skin) temperature of snow (degree Celsius), to the nearest half degree Celsius |
| avg_tuna | cm | Average tuna can sink depth (cm). A 200-g tuna can was used (cylindrical penetrometer) and dropped from a 50 cm height, to measure surface compaction. Average of two replicates reported |
| avg_track_depth | cm | Average wildlife sink depth (cm). For a single individual, the total depth of three discrete adjacent tracks were recorded to the nearest half cm. Average of three tracks reported |
| avg_dens_0_10 | kg m-3 | Average snow density from 0 cm (surface) to 10 cm below the surface (kg m-3). A 1000-cc steel density cutter was used to measure snow density. Average of two replicates reported |
| avg_dens_0_20 | kg m-3 | Average snow density from 0 cm (surface) to 20 cm below the surface (kg m-3). A 1000-cc steel density cutter was used to measure snow density. Average of both replicates at each depth class reported (= 4 density samples total) |
| avg_dens_0_30 | kg m-3 | Average snow density from 0 cm (surface) to 30 cm below the surface (kg m-3). A 1000-cc steel density cutter was used to measure snow density. Average of both replicates at each depth class reported (= 6 density samples total) |
| track_length | cm | Wildlife track length (cm), reported to the nearest half cm |
| track_width | cm | Wildlife track width (cm), reported to the nearest half cm |
| avg_hh_0_10 | 1 to 5 | Average hand-hardness from 0 cm (surface) to 10 cm below the surface. The hand-hardness scale (1=fist, 2=4 fingers, 3=1 finger, 4=pencil, 5=knife) was used to delineate each layers' hardness (penetration resistance). Layers are identified to the nearest 1 cm. A layer-thickness-weighted average hand-hardness was reported from 1 (softest) to 5 (hardest) |
| avg_hh_0_20 | 1 to 5 | Average hand-hardness from 0 cm (surface) to 20 cm below the surface. The hand-hardness scale (1=fist, 2=4 fingers, 3=1 finger, 4=pencil, 5=knife) was used to delineate each layers' hardness (penetration resistance). Layers are identified to the nearest 1 cm. A layer-thickness-weighted average hand-hardness was reported from 1 (softest) to 5 (hardest) |
| avg_hh_0_30 | 1 to 5 | Average hand-hardness from 0 cm (surface) to 30 cm below the surface. The hand-hardness scale (1=fist, 2=4 fingers, 3=1 finger, 4=pencil, 5=knife) was used to delineate each layers' hardness (penetration resistance). Layers are identified to the nearest 1 cm. A layer-thickness-weighted average hand-hardness was reported from 1 (softest) to 5 (hardest) |
| avg_hh_0_40 | 1 to 5 | Average hand-hardness from 0 cm (surface) to 40 cm below the surface. The hand-hardness scale (1=fist, 2=4 fingers, 3=1 finger, 4=pencil, 5=knife) was used to delineate each layers' hardness (penetration resistance). Layers are identified to the nearest 1 cm. A layer-thickness-weighted average hand-hardness was reported from 1 (softest) to 5 (hardest) |
| avg_hh_0_50 | 1 to 5 | Average hand-hardness from 0 cm (surface) to 50 cm below the surface. The hand-hardness scale (1=fist, 2=4 fingers, 3=1 finger, 4=pencil, 5=knife) was used to delineate each layers' hardness (penetration resistance). Layers are identified to the nearest 1 cm. A layer-thickness-weighted average hand-hardness was reported from 1 (softest) to 5 (hardest) |
| ice_top_10 | 1 or 0 | Ice present (1) or absent (0) from the top 10 cm of snowpack. Ice was defined as any layer with a hand-hardness of 5 (knife) |
| ice_top_20 | 1 or 0 | Ice present (1) or absent (0) from the top 20 cm of snowpack. Ice was defined as any layer with a hand-hardness of 5 (knife) |
| ice_top_30 | 1 or 0 | Ice present (1) or absent (0) from the top 30 cm of snowpack. Ice was defined as any layer with a hand-hardness of 5 (knife) |
| ice_top_40 | 1 or 0 | Ice present (1) or absent (0) from the top 40 cm of snowpack. Ice was defined as any layer with a hand-hardness of 5 (knife) |
| ice_top_50 | 1 or 0 | Ice present (1) or absent (0) from the top 50 cm of snowpack. Ice was defined as any layer with a hand-hardness of 5 (knife) |
| total_ice_10 | cm | Total thickness of ice in the top 10 cm of snowpack (cm). Ice was defined as any layer with a hand-hardness of 5 (knife) and summed all ice layers within top portion of the snowpack. |
| total_ice_20 | cm | Total thickness of ice in the top 20 cm of snowpack (cm). Ice was defined as any layer with a hand-hardness of 5 (knife) and summed all ice layers within top portion of the snowpack. |
| total_ice_30 | cm | Total thickness of ice in the top 30 cm of snowpack (cm). Ice was defined as any layer with a hand-hardness of 5 (knife) and summed all ice layers within top portion of the snowpack. |
| total_ice_40 | cm | Total thickness of ice in the top 40 cm of snowpack (cm). Ice was defined as any layer with a hand-hardness of 5 (knife) and summed all ice layers within top portion of the snowpack. |
| total_ice_50 | cm | Total thickness of ice in the top 50 cm of snowpack (cm); values 0 to 31. Ice was defined as any layer with a hand-hardness of 5 (knife) and summed all ice layers within the top portion of the snowpack. |
| vegetation_type | General vegetation type at each observation. Seven classes were used: open forest (approximately >10 m between trees), dense forest (<10 m between trees), road (either on roadbed surface, drainage ditch, or other anthropogenic landcover such as groomed snowmobile trail), riparian (alongside river corridor), rocky (no vegetation), shrub (<2 m-tall plants), and tundra (vegetation <0.5 m). |
Application and Derivation
Climate change is leading to rapid shifts in snow properties, with the potential to shift the balance between predators and prey. This study uses multiple seasons of fieldwork to integrate snow science into wildlife ecology, detailing how snow affects wildlife movement and influences predator-prey interactions. The study spanned diverse snow classes from the dry, shallow snow of Alaska to the wet, deep snow of Washington, making these findings widely applicable to most seasonally snow-covered ecosystems. Furthermore, the study provides an essential foundation for applying our mechanistic results to expand on correlational animal movement models, coupling spatially explicit snow metrics with GPS wildlife data, and investigating how predator-prey interactions mediate or amplify climate change projections.
Quality Assessment
Many points are on an anthropogenic or disturbed substrate; for this reason, all data classified as Vegetation.Type = “Road” should not be used for validation of snow models or data products without explicitly taking these unique snow physical processes into consideration.
Most data points are taken as pairs, with adjacent (generally, >2 m and <10 m apart) observations conducted along the same individual animal tracks. If observation was conducted adjacent to and simultaneous to another observation, this sampling approach may violate the independent assumption common to some analytical frameworks. All adjacent/simultaneous observations share a Paired ID. If observation is independent, pair ID is unique for that record.
Snow densities should be considered accurate only to the nearest 10 kg m-3.
Although observations were only considered with species identification confidence >60 %, species or age class misidentification is possible.
Data Acquisition, Materials, and Methods
Large mammal snow tracks were sampled in Denali National Park and Preserve, Alaska and at two sites in Washington (Okanogan and Northeast Washington). The study areas include portions of all six global snow classes per Sturm and Liston (2021). Denali is comprised of tundra and boreal forest, and the Washington sites contain primarily montane forest, with some prairie, ephemeral, and maritime areas. Fieldwork was conducted in Washington during three consecutive winters (9 January – 17 March 2021, 4 January – 22 March 2022, and 4 – 21 January 2023), and during two winters (18 January – 25 March 2022 and 27 January - 14 March 2023) in Denali.
Sampling was focused on common ungulates and their main predators in the study areas. Sampling included moose (Alces alces), coyotes (Canis latrans), and wolves (C. lupus) in both Alaska and Washington, whereas caribou (Rangifer tarandus) and Dall sheep (Ovis dalli) occurred only in the Alaska study area and cougars (Puma concolor), bobcats (Lynx rufus), mule deer (Odocoileus hemionus), and white-tailed deer (O. virginianus) occurred only in the Washington sites. Deer species could not be differentiated based on tracks alone; therefore, the species of deer was recorded only when the animal making the snow track was observed.
Study areas were traversed using snowmobiles, skis, dogsleds, and snowshoes, following a semi-structured stratified sampling approach to disperse observations over a wide variety of snow conditions, landcover, and snow classes. Sampling was restricted to tracks that appeared to have been made recently (usually <24 h) when snow conditions were likely the same as the time of a survey. Track freshness was estimated based on a variety of cues including comparisons of disturbed and undisturbed snow texture, presence or absence of melt-freeze crusts within the track, and hardness of snow track sidewalls (Rezendes, 1999). Once a set of fresh tracks was identified, the sink depth and dimensions (width and length) of three consecutive footprints were measured from one individual. For moose, age class was recorded, based either on visual confirmation of an individual creating snow tracks or based on track dimensions. The ability to differentiate age classes for smaller ungulates was more uncertain, so age classes for deer, caribou, or sheep were not specified. Animal gait was identified using a simple classification scheme (Rezendes, 1999), and observations were limited to walking or trotting individuals.
To measure snow properties, a snow pit was excavated adjacent to each set of measured tracks, aligning the pit face parallel with the animal’s direction of travel and set back 25-30 cm from the tracks to ensure that the 20 cm-long density cutter would not intercept animal-disturbed snow. Because only very recent tracks were sampled, it was assumed that snow conditions did not change significantly between when the tracks were made and snow observations were conducted. Importantly, only tracks where the animal was fully supported by the snow were selected and all tracks were disregarded that went through the entire snowpack and made contact with the ground. This approach was necessary to quantify thresholds of snow strength (e.g., hardness or density) required to support the body mass of each species, but this sampling design precludes analyzing snow depth as a covariate of track sink depth.
Five snow properties were measured at each site: snow density, penetrability, average hand-hardness, presence of ice layers, and total thickness of ice layers. Snow density was measured using a 1000-cc steel density cutter (SnowMetrics RIP 1 Cutter) measuring 10 cm x 10 cm x 20 cm. Two replicates were made at each of three depth classes: 0-10 cm, 10-20 cm, and 20-30 cm. The average value at each depth was used as the snow density metric (avg_dens). The average difference in replicate measurements was 15.2 kg m-3, so final density values were rounded to the nearest 10 kg m-3 when reporting results to account for measurement error. Sampling was limited to the top 30 cm based on prior studies that indicated the near-surface density is a better predictor of sink depth than overall density throughout the snow column (Bunnell at el., 1990; Sivy et al., 2018).
To best capture snow hardness, surface penetrability and hand-hardness were measured throughout the snowpack. Penetrability (analogous to surface compaction; Fierz et al., 2009) was measured by dropping a 200-g cylindrical penetrometer (7 oz tuna can, Chicken of the Sea Chunk Light; 8.2 cm diameter x 4.2 cm height) from a height of 50 cm above the snow surface and then measuring its sink depth, a key component of a snowpack’s stratigraphy (Kinar and Pomeroy, 2015). Two tuna can drops were conducted at each site and averaged to quantify penetrability (avg_tuna). Similar simple and inexpensive methods have been used as a proxy for animal sink depth in prior wildlife studies (Murray and Boutin, 1991; Kolbe et al., 2007; Pozzanghera et al., 2016; Droghini and Boutin, 2018; Peers et al., 2020). Hand-hardness was measured using the hand-hardness scale. To best capture snow hardness, surface penetrability and hand-hardness was measured throughout the snowpack. Each layer is assigned a hardness based on whether a fist, 4 fingers, 1 finger, pencil, or knife can be pushed into the layer (given a relatively constant force applied). These were reclassified on a numerical scale from 1 (fist-hardness; softest) to 5 (knife-hardness; hardest). For five depth horizons (top 10, 20, 30, 40, or 50 cm), each hardness unit (1-5) was multiplied by the total layer thickness (in cm), all measurements were summed, and divided by depth to calculate thickness-weighted hand-hardness (Sivy et al., 2018).
The hand-hardness measurements formed the basis for delineating ice layers, which have been shown to significantly affect large mammal movements and foraging ability (Hansen et al., 2011). Ice, corresponding with knife-hardness, is typically formed through liquid water percolating into and refreezing on top of or within the snowpack (Fierz et al., 2009). Extreme wind events were observed tightly sintering snow grains into knife-hardness layers, which were also included as ice layers (Fierz et al., 2009). The presence (1) or absence (0) of any knife-hardness layers was determined within the top 10, 20, 30, 40, and 50 cm of the snowpack for the ice presence metric (ice_top), and the total knife-hardness layers’ thickness was summed to calculate total ice thickness (total_ice) within the top 10, 20, 30, 40, and 50 cm of the snowpack. Because stratigraphy data were collected for the full snow column, the 0-40 cm and 0-50 cm depth classes for avg_hh, ice_top, and total_ice were able to be calculated without having to conduct additional field measurements. Therefore, these depths were included although density measurements terminated at 30 cm from snow surface.
Data Access
These data are available through the Oak Ridge National Laboratory (ORNL) Distributed Active Archive Center (DAAC).
Snow Properties and Wildlife Tracks in Washington and Alaska
Contact for Data Center Access Information:
- E-mail: uso@daac.ornl.gov
- Telephone: +1 (865) 241-3952
References
Bunnell, F.L., K.L. Parker, R.S. McNay, and F.W. Hovey. 1990. Sinking depths of black-tailed deer in snow, and their indices. Canadian Journal of Zoology 68:917–922. https://doi.org/10.1139/z90-13
Droghini, A., and S. Boutin. 2018. The calm during the storm: Snowfall events decrease the movement rates of grey wolves (Canis lupus). PLoS ONE 13:e0205742. https://doi.org/10.1371/journal.pone.0205742
Fierz, C., R.L. Armstrong, Y. Durand, P. Etchevers, E. Greene, D.M. McClung, K. Nishimura, P.K. Satyawali, and S.A. Sokratov. 2009. The International Classification for Seasonal Snow on the Ground. - IHP-VII Technical Documents in Hydrology, 83; IACS Contribution, 1, UNESCO-IHP, Paris. https://unesdoc.unesco.org/ark:/48223/pf0000186462
Hansen, B.B., R. Aanes, I. Herfindal, J. Kohler, and B-E. Saether. 2011. Climate, icing, and wild arctic reindeer: past relationships and future prospects. Ecology 92:1917–1923. https://doi.org/10.1890/11-0095.1
Kinar, N.J., and J.W. Pomeroy. 2015. Measurement of the physical properties of the snowpack. Reviews of Geophysics 53:481–544. https://doi.org/10.1002/2015RG000481
Kolbe, J.A., J.R. Squires, D.H. Pletscher, and L.F. Ruggiero. 2007. The effect of snowmobile trails on coyote movements within lynx home ranges. Journal of Wildlife Management 71:1409–1418. https://doi.org/10.2193/2005-682
Murray, D. L., and S. Boutin. 1991. The influence of snow on lynx and coyote movements: does morphology affect behavior? Oecologia 88:463–469. https://doi.org/10.1007/BF00317707
Peers, M.J.L., Y.N. Majchrzak, A.K. Menzies, E.K. Studd, G. Bastille-Rousseau, R. Boonstra, M. Humphries, T.S. Jung, A.J. Kenney, C.J. Krebs, D.L. Murray, and S. Boutin. 2020. Climate change increases predation risk for a keystone species of the boreal forest. Nature Climate Change 10:1149–1153. https://doi.org/10.1038/s41558-020-00908-4
Pozzanghera, C.B., K.J. Sivy, M.S. Lindberg, and L.R. Prugh. 2016. Variable effects of snow conditions across boreal mesocarnivore species. Canadian Journal of Zoology 94:697-705. https://doi.org/10.1139/cjz-2016-005
Rezendes, P. 1999. Tracking and the Art of Seeing: How to read animal tracks and sign, 2nd ed. New York, NY: HarperCollins Publishers, Inc. 336 p.
Sivy, K.J., A.W. Nolin, C.L. Cosgrove, and L.R. Prugh. 2018. Critical snow density threshold for Dall’s sheep (Ovis dalli dalli). Canadian Journal of Zoology 96:1170–1177. https://doi.org/10.1139/cjz-2017-0259
Sturm, M. and G.E. Liston. 2021. Revisiting the Global Seasonal Snow Classification: an updated dataset for Earth System Applications. Journal of Hydrometeorology 22:2917-2938. https://doi.org/10.1175/JHM-D-21-0070.1
Sullender, B.K., C.X. Cunningham, J.D. Lundquist, and L.R. Prugh. 2023. Defining the danger zone: critical snow properties for predator–prey interactions. Oikos e09925. https://doi.org/10.1111/oik.09925