Documentation Revision Date: 2019-04-12
Dataset Version: 1
Summary
This dataset includes 11 data files with snow pit observations and snow depths in .csv format. Companion files include 37 snowpit photographs, hourly snow stake images for each of 44 camera locations, a MATLAB script for snow stake image analysis to derive snow depth, and a snow depth time-lapse video of snow stake images at noon of each collection day for one location, from 2016-2017.
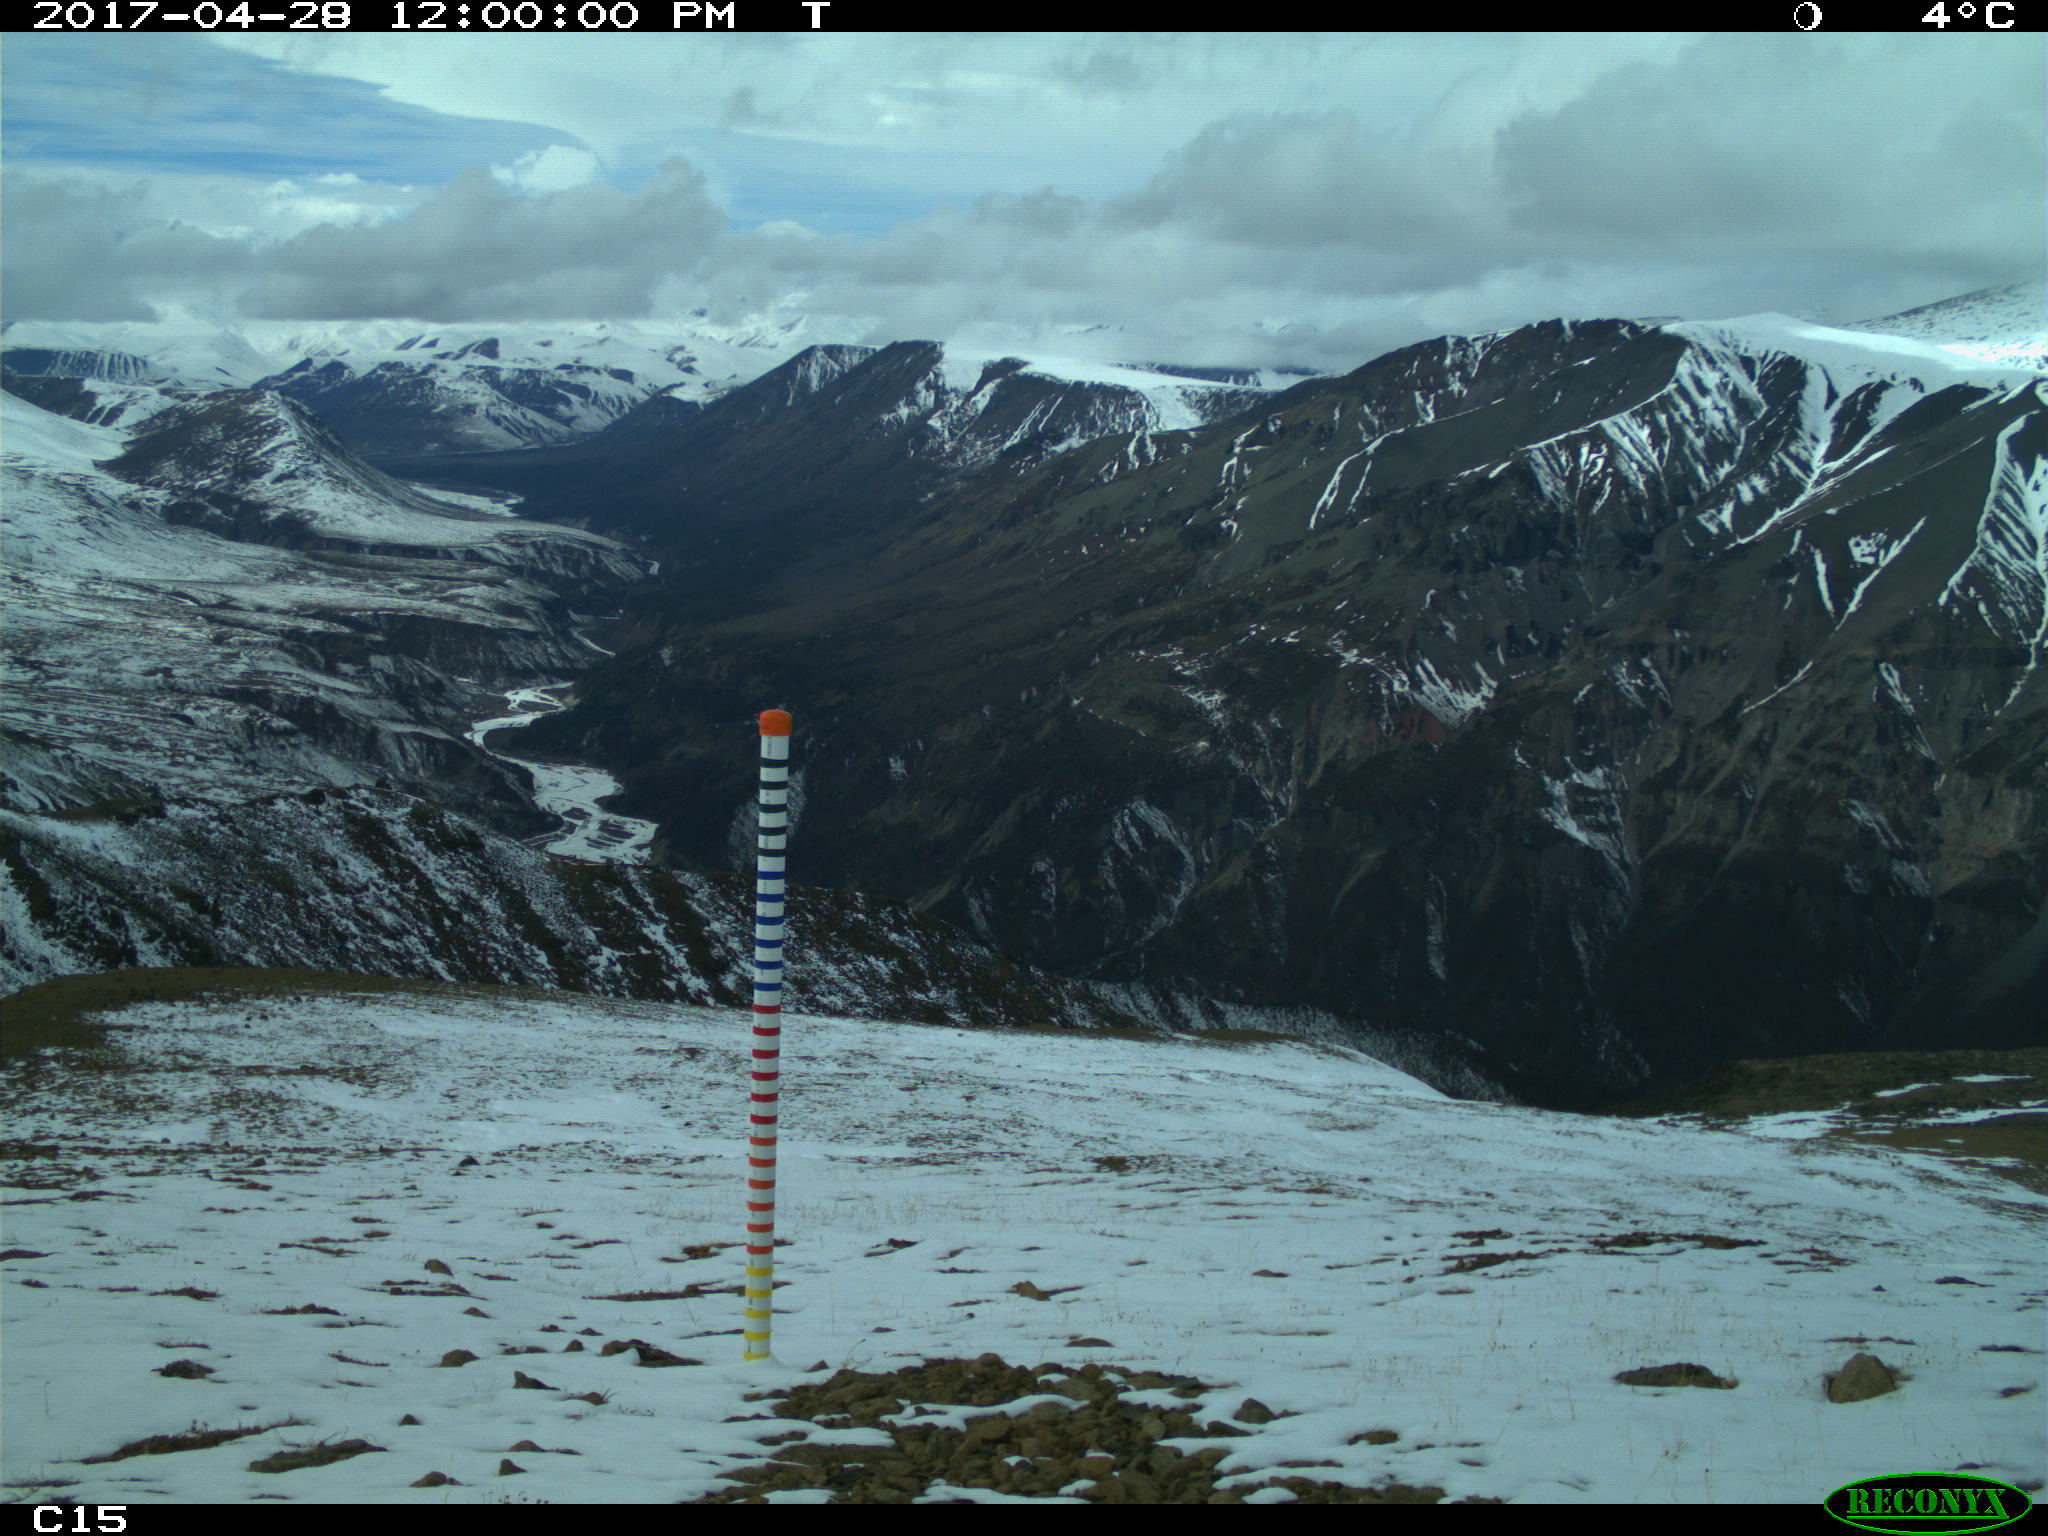
Figure 1. A remote camera image showing the snow stake at plot 15 of the Jaeger Mesa/Rambler Mine study area. Snow depth can be determined using a provided image analysis script.
Citation
Cosgrove, C.L., L.R. Prugh, A.W. Nolin, K.J. Sivy, R.L. Crumley, and M.E. Tedesche. 2019. Snow Depth, Stratigraphy, and Temperature in Wrangell St Elias NP, Alaska, 2016-2018. ORNL DAAC, Oak Ridge, Tennessee, USA. https://doi.org/10.3334/ORNLDAAC/1656
Table of Contents
- Dataset Overview
- Data Characteristics
- Application and Derivation
- Quality Assessment
- Data Acquisition, Materials, and Methods
- Data Access
- References
Dataset Overview
This dataset includes data from late-March snow surveys and hourly digital camera images from two study areas within the Wrangell St Elias National Park, Alaska. These data comprise snow density, stratigraphy, and temperature profiles obtained by snow pits; snow depth data obtained from transects between snow pits. Daily snow depths, adjacent to each pit, were derived from hourly camera images of snow stakes. These data were taken to constrain and validate a physically-based, spatially-distributed snow evolution model used to simulate snow conditions in Dall sheep habitat. The two study areas are both located within the Jacksina Park Unit (JPU). The first study area, surveyed in 2017, included the northern end of Jaeger Mesa and an area nearby Rambler mine in the North East of the JPU. The second study area, surveyed in 2018, is within the upper watershed of Pass Creek in the North of the JPU. The remote cameras operated from September 2016 to August 2017 on Jaeger Mesa/Rambler Mine, and from September 2017 to July 2018 at Pass Creek.
Project: Arctic-Boreal Vulnerability Experiment
The Arctic-Boreal Vulnerability Experiment (ABoVE) is a NASA Terrestrial Ecology Program field campaign that will take place in Alaska and western Canada between 2016 and 2021. Research for ABoVE will link field-based, process-level studies with geospatial data products derived from airborne and satellite sensors, providing a foundation for improving the analysis, and modeling capabilities needed to understand and predict ecosystem responses and societal implications.
Related Data Sets:
Sivy, K.J., A.W. Nolin, C.L. Cosgrove, and L.R. Prugh. 2018. ABoVE: Dall Sheep Track Sinking Depths, Snow Depth, Hardness, and Density, 2017. ORNL DAAC, Oak Ridge, Tennessee, USA. https://doi.org/10.3334/ORNLDAAC/1583
Acknowledgements:
This research was funded under NASA grant numbers NNX15AU13A and NNX15AU21A.
Data Characteristics
Spatial Coverage: Alaska
ABoVE Reference Locations:
Domain: Core ABoVE
State/territory: Alaska
Grid cell: Ah001v001Bh006v007Ch039v045
Spatial Resolution: point
Temporal Coverage: The data covers the period 2016-09-01 to 2018-03-30.
Temporal Resolution: Snow surveys: single event at each study area. Camera images: hourly for 10-12 months at each study area.
Study Area: (All latitude and longitude given in decimal degrees)
| Site | Westernmost Longitude | Easternmost Longitude | Northernmost Latitude | Southernmost Latitude |
|---|---|---|---|---|
| Northern Alaska | -143.3226 | -143.0001 | 62.3113 | 62.2562 |
Data file information:
This dataset includes 11 data files in .csv format.
Companion files include:
- 37 snowpit photographs in JPEG (.jpg) format
- a copy of the snow pit data collection field form
- one snow depth time-lapse video in .mp4 format
- one Matlab script in .m format
- hourly snow stake images for each of 44 cameras locations (approximately 300,000 total images)
File naming conventions are listed below the file names and descriptions.
In all files, null values are represented as “-9999” for numerical data and “NA” for text data.
Table 1. Data file names and descriptions
| File name | Description |
|---|---|
| jaegermesa_nabesna_pitdata_mar_2017.csv | Data on snow pit location, setting, surveyors and survey conditions at Jaeger Mesa and Rambler Mine. |
| jaegermesa_nabesna_depth_density_mar_2017.csv | Depth (height) and density profiles of snowpits at Jaeger Mesa and Rambler Mine. |
| jaegermesa_nabesna_stratigraphy_mar_2017.csv | Stratigraphic profiles of snowpits at Jaeger Mesa and Rambler Mine. |
| jaegermesa_nabesna_temperature_mar_2017.csv | Temperature profiles of snowpits at Jaeger Mesa and Rambler Mine. |
| jaegermesa_nabesna_snowdepths_2017.csv | Snow depth measurements taken by Magnaprobe or manual methods at Jaeger Mesa and Rambler Mine. |
| passcreek_pitdata_mar_2018.csv | Data on snow pit location, setting, surveyors and survey conditions at Pass Creek. |
| passcreek_depth_density_mar_2018.csv | Depth (height) and density profiles of snowpits at Pass Creek. |
| passcreek_stratigraphy_mar_2018.csv | Stratigraphic profiles of snowpits at Pass Creek. |
| passcreek_temperature_mar_2018.csv | Temperature profiles of snowpits at Pass creek. |
| passcreek_snowdepths_2018.csv | Snow depth measurements taken by Magnaprobe or manual methods at Pass Creek. |
| jaegermesa_nabesna_camera_snow_depths.csv | A file produced by getCameraDepth.m listing the snow depth at noon for each day during the 2016-2017 photography period for all 22 cameras in the Jaegermesa/Rambler Mine area. |
Snow Survey data file naming conventions:
There are five data files provided in comma-separated (.csv) format for each study area.
- Snowpit metadata - <studyarea>_pitdata_mar_<year>.csv
- Density profiles - <studyarea>_depth_density_mar_<year>.csv
- Stratigraphy data - <studyarea>_stratigraphy_mar_<year>.csv
- Temperature profiles - <studyarea>_temperature_mar_<year>.csv
- Snow depth data - <studyarea>_snowdepths_mar_<year>.csv
where <studyarea> is either 'jaegermesa_nabesna' or 'pass_creek'
<year> is either 2017 or 2018
Variables in the data files
Table 2. Variables in the files <studyarea>_pitdata_mar_<year>.csv
| Column name | Units | Description |
|---|---|---|
| id | Sort order ID, beginning at 1. | |
| location | Study area location, Jaeger Mesa / Rambler Mine / Pass Creek. | |
| site | Pit location, e.g., camera 1. | |
| pit_no | Pit number. When pit_no is missing, no pit was dug because location was a snow-free area. Other observations also missing. | |
| latitude | Decimal degrees | Latitude of measurement. |
| longitude | Decimal degrees | Longitude of measurement. |
| altitude | m | Altitude of measurement. |
| surveyors | First/last initials of surveyor(s). | |
| weather_notes | Notes on weather conditions. | |
| time | HH:MM:SS | Time in HH:MM:SS format. |
| date | YYYY-MM-DD | Date in YYYY-MM-DD format. |
| time_zone | The time zone for “date” and “time” columns. UTC. |
Table 3. Variables in the files <studyarea._depth_density_mar_<year>.csv.
| Column name | Units | Description |
|---|---|---|
| id | Sort order ID, beginning at 1. | |
| location | Study area location, Jaeger Mesa / Rambler Mine / Pass Creek. | |
| site | Pit location, e.g., camera 1. | |
| pit_no | Pit number. When pit_no is missing, no pit was dug because location was a snow-free area. Other observations also missing. | |
| time | HH:MM:SS | Time in HH:MM:SS format. |
| date | YYYY-MM-DD | Date in YYYY-MM-DD format. |
| time_zone | The time zone for “date” and “time” columns. UTC. | |
| height | cm | Snow height in cm. |
| slope | degrees | Slope angle in degrees. |
| pit comments | Comments on snowpit. | |
| top_sample_h | cm | Height in snowpack of the top of the density cutter. |
| bottom_sample_h | cm | Height in snowpack of the bottom of the density cutter. |
| density_sample_a | kg m-3 | Density of snow sample A. |
| density_sample_b | kg m-3 | Density of snow sample B. |
Table 4. Variables in the files <studyarea>_temperature_mar_<year>.csv
| Column name | Units | Description |
|---|---|---|
| id | Sort order ID, beginning at 1. | |
| location | Study area location, Jaeger Mesa / Rambler Mine / Pass Creek. | |
| site | Pit location, e.g., camera 1. | |
| pit_no | Pit number. When pit_no is missing, no pit was dug because location was a snow-free area. Other observations also missing. | |
| time | HH:MM:SS | Time in HH:MM:SS format. |
| date | YYYY-MM-DD | Date in YYYY-MM-DD format. |
| time_zone | The time zone for “date” and “time” columns. UTC. | |
| height | cm | Snow height in cm. |
| sample_h | cm | Height of temperature sample in snow pit in centimeters. |
| temperature | °C | Temperature of snow in degrees Celsius. |
Table 5. Variables in the files <studyarea>_stratigraphy_mar_<year>.csv.
| Column name | Units | Description |
|---|---|---|
| id | Sort order ID, beginning at 1. | |
| location | Study area location, Jaeger Mesa / Rambler Mine / Pass Creek. | |
| site | Pit location, e.g., camera 1. | |
| pit_no | Pit number. When pit_no is missing, no pit was dug because location was a snow-free area. Other observations also missing. | |
| time | HH:MM:SS | Time in HH:MM:SS format. |
| date | YYYY-MM-DD | Date in YYYY-MM-DD format. |
| time_zone | The time zone for “date” and “time” columns. UTC. | |
| height | cm | Snow height in cm. |
| slope | degrees | Slope angle in degrees. |
| pit comments | Comments on snowpit. | |
| layer_top_h | cm | Top of layer height in centimeters. |
| layer_bottom_h | cm | Bottom of layer height in centimeters. |
| grain_min | mm | Minimum diameter of snow grains in layer in millimeters. |
| grain_max | mm | Maximum diameter of snow grains in layer in millimeters. |
| grain_mean | mm | Mean diameter of snow grains in layer in millimeters. |
| grain_type | Grain type in layer, New Snow/Rounds/Facets/Mixed Forms/Melt-Freeze/Crust/Ice | |
| snow_wetness | Snow wetness in layer, Dry/Moist/Wet/Very Wet/Slush |
Table 6. Variables in the files <studyarea>_snowdepths_mar_<year>.csv.
| Column name | Units | Description |
|---|---|---|
| id | Sort order ID, beginning at 10001. | |
| date | YYYY-MM-DD | Date in YYYY-MM-DD format. |
| time | HH:MM:SS | Time in HH:MM:SS format. |
| time_zone | The time zone for “date” and “time” columns. UTC. | |
| method | Method of measurement, Magnaprobe / Manual. | |
| latitude | Decimal degrees | Latitude of measurement. |
| longitude | Decimal degrees | Longitude of measurement. |
| altitude | m | Altitude of measurement. |
| depth | cm | Snow depth in centimeters. |
| fix_quality | Quality of GPS fix 1=high 5=low. | |
| nmbr_satellites | Number of satellites detected. | |
| hdop | Horizontal dilution of precision. |
Table 7. Variables in the data file jaegermesa_nabesna_camera_snow_depths.csv
| Column name | Units | Description |
|---|---|---|
| datetime | yyyy-mm-ddThh:mm-0800 |
Date/time of camera images in ISO 8601 format: where date (yyyy-mm-dd) is followed by the letter T, then the time (hh:mm), then "-0800", the offset from UTC for the local data reporting time zone – Alaska Daylight Time (AKDT). |
| c## (01-22) | cm | Snow depth for each camera in the Jaeger Mesa / Rambler Mine site (cameras 01-22) with snow depths by date/time in centimeters. |
Table 8. Companion file names and descriptions.
| File name | Description |
|---|---|
| pit_template_snowex.pdf | Template data entry sheet used in field for pit measurements. |
| Pit_photos.zip | Contains 37 .jpg images depicting some of the snowpits from various orientations. |
| c15_lapse.mp4 | A time-lapse video of the camera images taken by Camera 15 at the Jaeger Mesa / Rambler Mine site at noon (local time, UTC-0800) for each day of photography. Created by ORNL DAAC. |
| getCameraDepth.m | MatLab script used to retrieve snow depth from the stakes positioned in front of each camera. |
| <studyarea>_c##.zip | 44 .zip files, each containing all hourly images from a specific remote camera in .jpg format. The naming convention is described in the section below. |
Companion file naming conventions:
Pit_photos.zip
- Example images of the snow depths in different elevation and vegetation are included. The format of these files is:<studyarea>_pit#_<orientation>_YYYYMMDD.jpg>, where orientation is either; 'face' - showing the pit face; 'north', 'east', 'south', 'west' - photos in each of the cardinal directions; or 'up' - a photo directly up from the pit.
44 .zip files, each containing all hourly images
- Hourly remote camera images are stored in folders beginning with the study area location (jaegermesa_nabesna or pass_creek), followed by the camera number in the format of c##.
- Hourly remote camera images are in the JPEG format (.jpg). The study area location (jaegermesa_nabesna or pass_creek) leads the file name, followed by the camera number in the format of C##, followed by the data and time in the format of yyyymmddThhmmss.
- For example, the file named jaegermesa_C02_20170314T110000.jpg would contain the image taken by camera 2 in the Jaeger Mesa / Nabesna study area on the 14th of March 2017 at 11am. Note: reported image time is in Alaska Daylight Time (UTC -8).
Application and Derivation
These data were taken to constrain and validate a physically based, spatially-distributed snow evolution model used to simulate snow conditions in Dall sheep habitat.
The file, jaegermesa_nabesna_camera_snow_depths.csv, is provided as an example of the products that may be produced using the script, getCameraDepth.m, to derive snow depth. This data file provides snow depth at noon for each day during the 2016-2017 photography period for all 22 cameras in the Jaegermesa/Rambler Mine area.
Quality Assessment
Daily calibration tests of the Magnaprobe were conducted in the field via a no-snow measurement and a manually recorded snow depth. Corrupted files were found and removed from the remote camera images.
Data Acquisition, Materials, and Methods
Snow depth surveys:
Two methods were employed to measure the snow depth. The first method was with a 'Magnaprobe', which is a patented magnetostrictive device capable of simultaneously recording snow depth and position. The Magnaprobe uses Wide Area Augmentation System (WAAS)-enabled GPS giving a positional accuracy better than 3 meters 95 percent of the time (Sturm and Holmgren, 2018). Snow depth accuracy is less than +0.1 cm for hard substrates to more than +5 cm in areas with soft ground beneath the snow; both of these errors are due to over-probing. Further details on the Magnaprobe instrument can be found in Sturm and Holmgren (2018).
The second method employed was via manual probing with an avalanche probe to gauge snow depth and a Garmin 64s handheld GPS was used to record the position of the measurements. The interval on the avalanche probe was 1 cm, meaning an uncertainty of ±1 cm must be considered on top of similar uncertainties according to substrate type as per the Magnaprobe. Positional accuracy of the handheld GPS is within 3 meters 95 percent of the time (Garmin, 2017).
The survey strategy used to collect these data was a sequence of longer transects linking locations where remote cameras had been installed, smaller transects in 4 directions from each camera location, 50-m spirals, and a network of longer transects. Snow depth samples were taken at a resolution of ~5 meters. This strategy was employed to best characterize the different scales of snow depth variability across different landcover types, elevations, slopes and aspects.
Snowpits:
See the template data entry sheet used in the field for pit measurements for more details -- Companion file pit_template_snowex.pdf.
Snow density and temperature:
Snowpits were dug in the vicinity of each camera and at additional locations near animal tracks during March snow surveys of both study areas. Vertical temperature profiles were taken at 10 cm intervals after taking the skin temperature using a digital thermometer with 0.1 ºC resolution. Density profiles were taken with a 1000 cc stainless steel cutter (Snowmetrics, 2018) where A and B samples were collected via perpendicular insertion of the cutter at the pit face and weighed with a digital scale (ACCULAB VI-4kg) to provide a direct measure of snow density. Where a no data value is reported, the density sample was impossible to obtain due to obstruction by vegetation or uneven ground within the snowpack.
Snow stratigraphy:
In the same snowpits stratigraphy was recorded by visually identifying the most clearly defined layers in the vertical profile.
- Using a 2mm gridded crystal card and a 10x magnifying loupe (both Snowmetrics, 2018), the minimum, maximum and mean grain size (mm) was estimated visually for each layer. The dominant grain type for the layer was ascertained using the same method.
- Snow wetness for each layer was classified by defining the snow as:
- Dry (D) if it will not pack/bind when compressed together in gloved hands
- Moist (M) if it does pack/bind when compressed with gloved hands
- Wet (W) if it forms dense well consolidated snowballs
- Very Wet (VW) if water can be squeezed out
- Slush (S) if water drains out freely.
- Snow hardness by layer was classified using from one to five using the hand hardness test, a widely used field index for classifying snow hardness that corresponds to the amount of resistance experienced by an object pushed into the snow (Fierz et al., 2009; Höller and Fromm 2010). The hand hardness values from softest to hardest were:
- fist (1)
- four fingers (2)
- one finger (3)
- blunt end of pencil (4)
- knife blade (5).
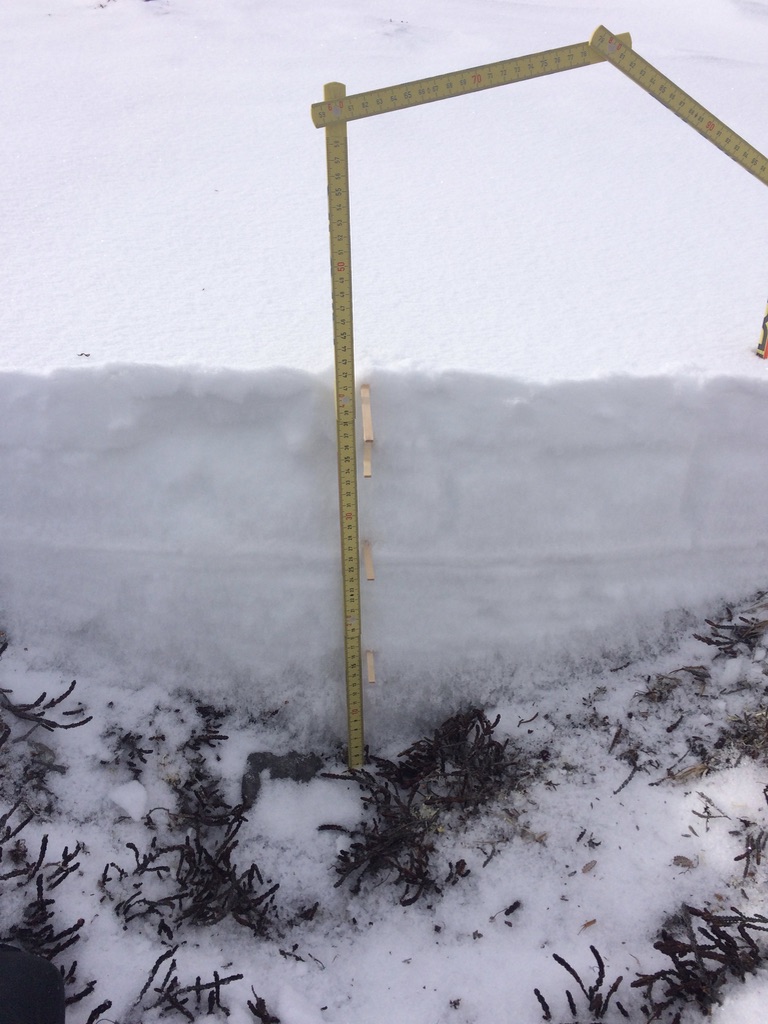
Figure 2. Face of Snowpit 8 at the Jaeger Mesa / Rambler Mine study area. Layers are marked with wooden wedges. Included in companion file, jaegermesa_nabesna_c15.zip
Remote cameras:
Remote camera images from both study areas were taken by Reconyx PC900 cameras programmed to take hourly photographs, from September 2016 to August 2017 on Jaeger Mesa/Rambler Mine, and from September 2017 to July 2018 at Pass Creek. In front of each camera was a 1.5 m snow stake, demarcated at 5 cm intervals in order to retrieve the snow depth evolution across gradients of elevation, aspect, slope and landcover within the study areas.
Time-lapse snow depth video
The ORNL DAAC created a time-lapse snow depth video as a companion file. This entailed isolating the image at noon, local time (AKDT, UTC-0800) for each day of photography at camera 15 of the Jaeger Mesa/Rambler Mine site, September 2016 to August 2017. These images were compiled in Windows Video Editor.
Data Access
These data are available through the Oak Ridge National Laboratory (ORNL) Distributed Active Archive Center (DAAC).
Snow Depth, Stratigraphy, and Temperature in Wrangell St Elias NP, Alaska, 2016-2018
Contact for Data Center Access Information:
- E-mail: uso@daac.ornl.gov
- Telephone: +1 (865) 241-3952
References
Fierz, C., Armstrong, R.L., Durand, Y., Etchevers, P., Greene, E., McClung, D.M., Nishimura, K., Satyawali, P.K. and Sokratov, S.A. 2009. The International Classification for Seasonal Snow on the Ground. IHP-VII Technical Documents in Hydrology N°83, IACS Contribution N°1, UNESCO-IHP, Paris. http://unesdoc.unesco.org/images/0018/001864/186462e.pdf
Garmin. 2017. What is WAAS? Available at http://www8.garmin.com/aboutGPS/waas.html - accessed October 5th 2018
Höller, P., and Fromm, R. 2010. Quantification of the hand hardness test. Ann. Glaciol. 51(54): 39-44. https://doi.org/10.3189/172756410791386454
Sturm, M. and Holmgren, J. 2018. An Automatic Snow Depth Probe for Field Validation Campaigns. Water Resources Research. Manuscript submitted for publication.
Snowmetrics. 2018. Tools for Avalanche Forecasting and Snow Research. Available at http://snowmetrics.com/about/ - accessed October 5th 2018