Documentation Revision Date: 2020-06-19
Dataset Version: 1
Summary
There is one data file in NetCDF (.nc4) format with this dataset.
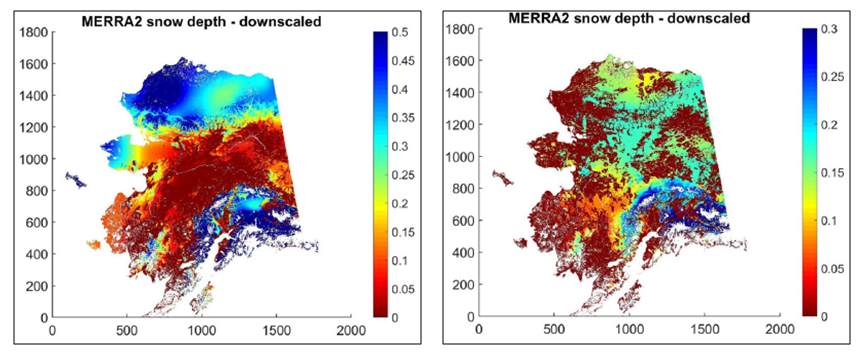
Figure 1. Part of the snow depth data processing data showing the downscaled MERRA-2 (in meters) snow depth data. Left image shows snow depth during spring snow melt for 23-30 April, 2007. Right image shows snow depth during early snow accumulation for 30 September-7 October, 2007. Source: Yi et al. 2019.
Citation
Yi, Y., J. Kimball, and C.E. Miller. 2020. ABoVE: High Resolution Cloud-Free Snow Cover Extent and Snow Depth, Alaska, 2001-2017. ORNL DAAC, Oak Ridge, Tennessee, USA. https://doi.org/10.3334/ORNLDAAC/1757
Table of Contents
- Dataset Overview
- Data Characteristics
- Application and Derivation
- Quality Assessment
- Data Acquisition, Materials, and Methods
- Data Access
- References
Dataset Overview
This dataset provides estimates of maximum snow cover extent (SCE) and snow depth for each 8-day composite period from 2001 to 2017 at 1 km resolution across Alaska. The study area covers the majority land area of Alaska except for areas covered by perennial ice/snow or open water. A downscaling scheme was used in which Modern-Era Retrospective Analysis for Research and Applications, Version 2 (MERRA-2) global reanalysis 0.5 degree snow depth data were interpolated to a finer 1 km spatial grid. In the methods used, the downscaling scheme incorporated MODIS SCE (MOD10A2) to better account for the influence of local topography on the 1km snow distribution patterns. For MODIS cloud-contaminated pixels, persistent and patchy cloud cover conditions were improved by applying an elevation-based spatial filtering algorithm to predict snow occurrence. Cloud-free MODIS SCE data were then used to downscale MERRA-2 snow depth data. For each snow-covered 1 km pixel indicated by the MODIS data, the snow depth was estimated based on the snow depth of the neighboring MERRA-2 0.5 grid cell, with weights predicted using a spatial filter.
Project: Arctic-Boreal Vulnerability Experiment
The Arctic-Boreal Vulnerability Experiment (ABoVE) is a NASA Terrestrial Ecology Program led field campaign based in Alaska and western Canada between 2016 and 2021. Research for the ABoVE links field-based, process-level studies with geospatial data products derived from airborne and satellite sensors, providing a foundation for improving the analysis and modeling capabilities needed to understand and predict ecosystem responses and societal implications.
Related Publication:
Yi, Y., J.S. Kimball, R.H. Chen, M. Moghaddam, and C.E. Miller. 2019. Sensitivity of active-layer freezing process to snow cover in Arctic Alaska. The Cryosphere, 13:197–218. https://doi.org/10.5194/tc-13-197-2019
Acknowledgments:
This research received funding from the NASA Arctic Boreal and Vulnerability Experiment (ABoVE) (grant numbers NNX15AT74A andNNH18ZDA001N-TE) and from NASA's interdisciplinary science program (grant number NNX14AO23G).
Data Characteristics
Spatial Coverage: the study area covers most of the land areas in Alaska, except for perennial ice/snow or open water areas
ABoVE Reference Locations
Domain: Core ABoVE
State/Territory: Alaska
Grid Cells: Ah000-001v000-001
Spatial Resolution: 1 km
Temporal Coverage: 2001-01-01 to 2017-12-30
Temporal Resolution: 8 day
Study Areas: All latitude and longitude given in decimal degrees.
| Region | Westernmost Longitude | Easternmost Longitude | Northernmost Latitude | Southernmost Latitude |
|---|---|---|---|---|
| Alaska | -179.18 | -132.576 | 71.42152 | 55.56665 |
Data File Information
There is one data file in NetCDF format (.nc4) with this dataset. Alaska_snow_extent_depth_2001-2017.nc4 provides estimates of the maximum snow cover extent and mean snow depth for each 8-day composite period throughout each year from 2001 to 2017. Each year has 46 composite periods, following the definition of MODIS 8-day temporal composite images (with a 5 or 6 day composite at year-end).
Data File Details
The coordinate reference system is EPSG: 3338 (NAD83 / Alaska Albers) with the projection Albers_Conic_Equal_Area.
Table 1. Variables in the file Alaska_snow_extent_depth_2001-2017.nc4.
| Variable | Units | Description |
|---|---|---|
| x_coordinate | m | X coordinate of projection |
| y_coordinate | m | Y coordinate of projection |
| maximum_snow_cover_extent | unitless |
0 = missing data/fill value Data are a short "s" integer data type. The flag_values attribute indicates the data type. |
| snow_depth | m | Mean snow depth per grid cell. Missing values are indicated by -999. |
| latitude | degrees | Latitude-degrees north |
| longitude | degrees | Longitude-degrees east |
Application and Derivation
The timing and depth of snow cover have a significant effect on the hydrological and biogeochemical processes in the northern high latitudes; however, few snow datasets are available for the Arctic region with suitable spatial (≤1-km resolution) and temporal (~weekly) fidelity for such applications. Most regional and global models rely on global reanalysis precipitation or snow datasets to characterize snow cover effects, while coarse-resolution reanalysis datasets generally have difficulty capturing landscape-scale (100-1000 m) variability in snow cover conditions, especially over complex terrain and during seasonal transitions. To overcome this problem, a new algorithm was developed to gap-fill the MODIS SCE record and mitigate data loss from pervasive cloud cover and other factors, and then downscale the coarse (~0.5 degree) global reanalysis snow depth data using this finer-scale cloud-free MODIS SCE dataset. See Yi et al. 2019 for more details.
Quality Assessment
Excerpted from Yi et al., 2019.
The accuracy of the gap-filled MODIS SCE product was cross-checked using the two MODIS sensors (Terra and Aqua); the downscaled snow depth data were evaluated using in-situ SNOTEL ( https://www.wcc.nrcs.usda.gov/snow/ ) observations across Alaska.
The cloud-free Aqua MODIS SCE data were used to evaluate the accuracy of filled pixels identified as the cloud covered in the Terra MODIS SCE data and vice versa, assuming relatively consistent snow conditions between morning (Terra) and afternoon (Aqua) SCE acquisitions during the 8-day composite period. Results indicate an accuracy of more than 80% in the cloud filtering algorithm with no obvious differences observed between the two sensor SCE records (Table 3). There are significantly more cloud-covered pixels in the Aqua MODIS record (1.1%-15.2%), and thus more cloud-free Terra MODIS pixels (0.9%-9.8%) overlapping with cloud-covered Aqua MODIS pixels. Cloud cover mostly occurs in the spring and fall shoulder seasons, resulting in larger SCE uncertainties during those periods.
Table 2. The accuracy of the spatial filter algorithm applied to the Aqua MODIS SCE data during spring (April to June) and fall (September to November) transitions averaged over Alaska from 2003 to 2015. Pixels identified as cloud contaminated in the Aqua MODIS record but indicated as clear conditions in the Terra MODIS were used for evaluation. The percentage of cloud contaminated and evaluated pixels were calculated for the entire Alaska domain, while the accuracy and misclassification were calculated as the percentage of the evaluated pixels. Both Terra and Aqua MODIS SCE data show similar accuracy, while only the Aqua MODIS results are shown here due to a higher percentage of cloud contaminated pixels (available for evaluation) in the Aqua imagery.
| Spring Transitional Season | Fall Transitional Season | |||||
|---|---|---|---|---|---|---|
| April | May | June | September | October | November | |
| Cloud contaminated pixels (%) | 5.0±2.7 | 11.2±2.6 | 4.4±2.3 | 8.8±4.0 | 13.2±3.7 | 11.3±3.5 |
| Evaluated pixels (%) | 3.5±1.7 | 5.8±1.1 | 2.4±1.1 | 5.0±2.0 | 9.1±2.3 | 7.2±2.1 |
| Accuracy (%) | 92.0±3.3 | 80.0±1.9 | 82.9±4.0 | 81.8±2.3 | 86.2±3.5 | 97.0±2.2 |
| Misclassification of land pixels (%) | 4.1±1.4 | 8.2±0.9 | 6.7±1.4 | 8.6±1.1 | 6.7±1.4 | 2.0±1.3 |
| Misclassification of snow pixels (%) | 4.0±2.0 | 11.8±1.3 | 10.3±2.9 | 9.6±1.9 | 7.1±2.2 | 1.1±1.0 |
Compared with in-situ snow depth measurements from the Alaskan SNOTEL sites (Fig. 2), the 1-km MERRA-2 snow depth data generated using the new downscaling algorithm showed an overall improvement (Table 3) over the original spatial interpolation scheme used in Yi et al. (2018). The prior study (Yi et al., 2018) used a simple inverse-distance weighting scheme to spatially interpolate the MERRA-2 data to 1 km resolution and then used MODIS SCE data to identify snow-free pixels and adjust the 1 km snow depth estimates accordingly. The new 1 km snow depth data showed an overall reduced root mean square error (RMSE) and lower bias except in Interior Alaska at elevations between 400 m and 800 m. At these elevations, the USGS DEM used for spatial downscaling at the 1 km grid shows large deviations from the reported SNOTEL site elevations (Yi et al., 2019), which may account for the relatively poorer performance of the new snow depth dataset in this elevation band.
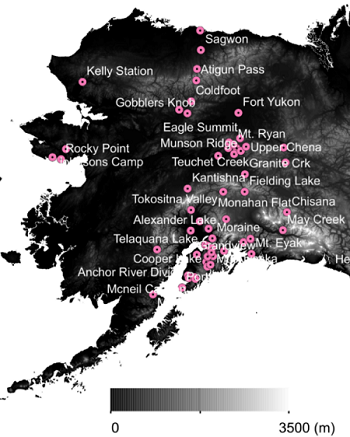
Figure 2. The location of SNOTEL sites in Alaska used to evaluate the accuracy of the snow depth product.
Table 3. Statistics of 1 km MERRA-2 snow depth data generated using different spatial interpolation schemes compared with in-situ snow depth measurements at the Alaskan SNOTEL sites.
| Sites | R | Bias (m) | RMSE (m) | ||||
|---|---|---|---|---|---|---|---|
| Yi et al. (2018) | This Dataset | Yi et al. (2018) | This Dataset | Yi et al. (2018) | This Dataset | ||
| Arctic Alaska | 8 | 0.84 | 0.85 | -0.03 | -0.01 | 0.18 | 0.16 |
| Other areas | |||||||
| <400 m | 19 | 0.78 | 0.81 | 0.01 | 0.01 | 0.39 | 0.28 |
| 400-800 m | 18 | 0.86 | 0.91 | -0.01 | -0.09 | 0.44 | 0.41 |
| >800 m | 10 | 0.84 | 0.88 | -0.08 | 0.02 | 0.32 | 0.27 |
Data Acquisition, Materials, and Methods
The following is a brief synopsis of methods from Yi et al., 2019.
When generating fine-resolution snow depth data using global reanalysis, a sophisticated downscaling scheme is needed to better account for the influence of local topography on the 1 km snow distribution pattern. This information can be derived from the MODIS SCE data; however, persistent cloud cover and patchy snow conditions constrain the ability of the MODIS SCE data to capture snow cover variability, especially during the transitional season. To overcome this constraint, an elevation-based spatial filtering algorithm was developed to predict snow occurrence for MODIS cloud contaminated pixels; the cloud-free MODIS SCE data was then used to downscale the MERRA-2 snow depth data (Fig. 3). For each snow-covered 1 km pixel indicated by the MODIS data, the snow depth was estimated based on the snow depth of neighboring MERRA-2 0.5 degree grid cells, with weights predicted using a similar spatial filter.
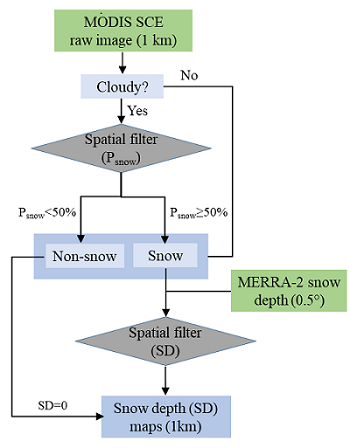
Figure 3. Flow diagram describing the snow data processing. A spatial filter was used to predict the snow occurrence probability for MODIS cloud-contaminated pixels. Based on the cloud-free MODIS SCE imagery, the snow depth of each snow-covered 1-km pixel was estimated from the snow depth of the neighboring MERRA-2 grid cells with weights predicted using another spatial filter. The snow data processing was carried out at an 8-day time step. Source: Yi et al. 2019.
Cloud Filtering of MODIS SCE Data
A methodology similar to the one used to generate Daymet surface precipitation was used, which uses a truncated Gaussian weighting filter and accounts for the dependence of precipitation on elevation (Thornton et al., 1997). For this application, the pixels without cloud cover were treated as “station observations”, then the spatial filter was used to predict the occurrence of snow in cloud-contaminated pixels and generate continuous cloud-free snow cover images at 1 km spatial resolution and 8-day time scale. Snow distribution is closely associated with local topography; therefore, the snow occurrence probability was estimated for the cloud-contaminated pixels based on the elevation-based snow distribution pattern of neighboring pixels. Temporal filtering of the MODIS SCE data was conducted prior to the application of the spatial filter. Pixels with cloud cover were reclassified as either snow or non-snow conditions if the two temporally adjacent 8-day periods were both identified as cloud-free and indicated consistent snow or non-snow covered conditions. Missing SCE pixels occurring during the polar night were assigned as “snow” when there were established snow cover conditions in the prior 8-day period or there was more than 0.2 m snow depth indicated by the co-located MERRA-2 grid cell.
Downscaling of MERRA-2 snow Depth Data
The resulting cloud-free 8-day MODIS SCE data was used with a 1 km digital elevation model (DEM) aggregated from the 2 arc-second (~60 m) DEM for Alaska (USGS, 2017) to downscale the MERRA-2 snow depth data to 1 km resolution. A spatial filter similar to the above procedure was used for the downscaling process, except that the MERRA-2 gridded snow data were treated as station “observations” and the “station” elevations were defined as the mean elevation within the associated MERRA-2 grid cell. Previous studies have demonstrated a clear dependence of snow depth on elevation, generally with snow depth increase with elevation up to a certain level followed by a decrease at the highest elevations. Therefore, the transformed snow depth variables were used instead of the original MERRA-2 snow depth as inputs to the spatial filter to account for the dependence of snow distribution on elevation.
Data Access
These data are available through the Oak Ridge National Laboratory (ORNL) Distributed Active Archive Center (DAAC).
ABoVE: High Resolution Cloud-Free Snow Cover Extent and Snow Depth, Alaska, 2001-2017
Contact for Data Center Access Information:
- E-mail: uso@daac.ornl.gov
- Telephone: +1 (865) 241-3952
References
Gelaro, R., W. McCarty, M.J. Suárez, R. Todling, A. Molod, L. Takacs, C.A. Randles, A. Darmenov, M.G. Bosilovich, R. Reichle, K. Wargan, L. Coy, R. Cullather, C. Draper, S. Akella, V. Buchard, A. Conaty, A.M. da Silva, W. Gu, G.-K Kim, R. Koster, R. Lucchesi, D. Merkova, J.E. Nielsen, G. Partyka, S. Pawson, W. Putman, M. Rienecker, S.D. Schubert, M. Sienkiewicz, and B. Zhao. 2017. The Modern-Era Retrospective Analysis for Research and Applications, Version 2 (MERRA-2). Journal of Climate, 30:5419–5454. https://doi.org/10.1175/JCLI-D-16-0758.1
Thornton, P.E., S.W. Running, and M.A.White. 1997. Generating surfaces of daily meteorological variables over large regions of complex terrain. Journal of Hydrology, 190(3-4):214–251. https://10.1016/S0022-1694(96)03128-9
Yi, Y., J.S. Kimball, R.H. Chen, M. Moghaddam, and C.E. Miller. 2019. Sensitivity of active-layer freezing process to snow cover in Arctic Alaska. The Cryosphere, 13:197–218. https://doi.org/10.5194/tc-13-197-2019
Yi, Y., J.S. Kimball, R.H. Chen, M. Moghaddam, R.H. Reichle, U. Mishra, D. Zona, and W.C. Oechel. 2018. Characterizing permafrost active layer dynamics and sensitivity to landscape spatial heterogeneity in Alaska. The Cryosphere, 12:145-161. https://doi.org/10.5194/tc-12-145-2018
USGS. 2017. Alaska 2 Arc-second Digital Elevation Models (DEMs) – USGS National Map 3DEP Downloadable Data Collection, U.S. Geological Survey.
Wan, Z., S. Hook, and G. Hulley. 2015. MOD11A2 MODIS/Terra Land Surface Temperature/Emissivity 8-Day L3 Global 1 km SIN Grid V006. NASA EOSDIS Land Processes DAAC. https://doi.org/10.5067/MODIS/MOD11A2.006