Documentation Revision Date: 2018-12-19
Data Set Version: 1
Summary
There are six data files in .csv format. Each file includes data as displayed in a corresponding figure in the related publication. Please refer to the variable descriptions below, and the respective figure’s caption and descriptions in the related publication.
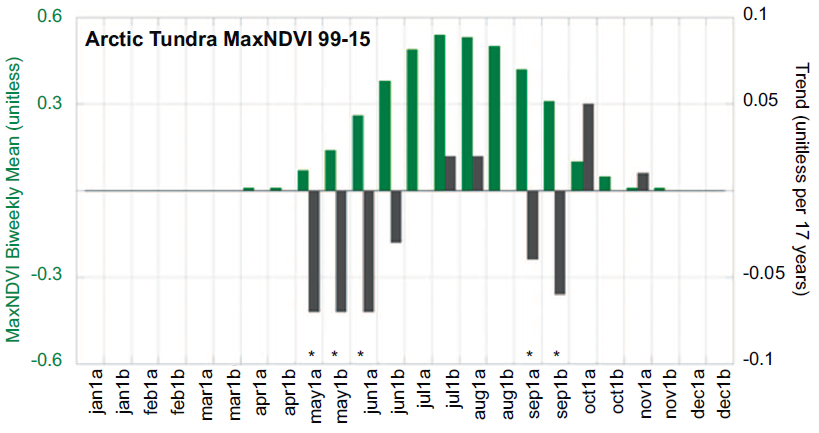
Figure 1. Arctic biweekly NDVI (green bars) and trend (grey bars) for full tundra for 1999-2015. Biweekly trends statistically significant at the 95% level or greater are marked with an asterisk on the x-axis. MaxNDVI is unitless and trend is change over time period. From Figure 9 (c) Bhatt et al. (2017).
Citation
Bhatt, U.S. 2018. ABoVE: Climate Drivers of Pan-Arctic Tundra Vegetation Productivity, 1982-2015. ORNL DAAC, Oak Ridge, Tennessee, USA. https://doi.org/10.3334/ORNLDAAC/1606
Table of Contents
- Data Set Overview
- Data Characteristics
- Application and Derivation
- Quality Assessment
- Data Acquisition, Materials, and Methods
- Data Access
- References
Data Set Overview
This dataset provides a summary of potential climate drivers of Arctic tundra vegetation productivity that have been compiled for growing seasons from 1982 to 2015. The scale of interest is the entire pan-arctic non-alpine tundra and the continental subdivisions of the North American and the Eurasian Arctic North of 70 degrees. These climate drivers include (1) maximum normalized difference vegetation index (MaxNDVI) and time-integrated NDVI (TI-NDVI), (2) summer sea ice concentrations, (3) oceanic heat content, (4) land surface temperature, and (5) summer warmth index (SWI). Data are provided variously as timeseries and weekly and bi-weekly averages over selected time ranges and study regions with calculated trends and trend significance. Data collected over 33 years were compiled to observe seasonal trends of vegetation productivity and to detect dynamics between arctic vegetation and climate drivers.
Each file includes data as displayed in a corresponding figure in the related publication. Please refer to the variable descriptions below, and the respective figure’s caption and descriptions in the related publication.
Project: Arctic-Boreal Vulnerability Experiment
The Arctic-Boreal Vulnerability Experiment (ABoVE) is a NASA Terrestrial Ecology Program field campaign based in Alaska and western Canada between 2016 and 2021. Research for ABoVE links field-based, process-level studies with geospatial data products derived from airborne and satellite sensors, providing a foundation for improving the analysis and modeling capabilities needed to understand and predict ecosystem responses and societal implications.
Related Publication:
Uma S. Bhatt, Donald A. Walker, Martha K. Raynolds, Peter A. Bieniek, Howard E. Epstein, Josefino C. Comiso, Jorge E. Pinzon, Compton J. Tucker, Michael Steele, Wendy Ermold, and Jinlun Zhang. 2017. Changing seasonality of panarctic tundra vegetation in relationship to climatic variables. Environmental Research Letters, 12 (5) 055003. https://doi.org/10.1088/1748-9326/aa6b0b
Acknowledgements:
This study was supported by NASA/NEESPI Land Cover Land Use Change Initiative, Grant No. NNG6GE00A, NNX09AK56G and NNX14AD90G; National Science Foundation grants ARC-0902175 and ARC-1203506; and NASA NNH16CP09C–Arctic Boreal Vulnerability Experiment.
Data Characteristics
Spatial Coverage: Circumpolar, North of 70 degrees latitude
Spatial resolution: 12 km
Temporal coverage: 1982-01-01 to 2015-08-31
Temporal resolution: Weekly to monthly
Study Areas (All latitude and longitude given in decimal degrees)
|
Site |
Westernmost Longitude |
Easternmost Longitude |
Northernmost Latitude |
Southernmost Latitude |
|---|---|---|---|---|
|
Circumpolar |
-180 |
180 |
90 |
70 |
Data file information
There are six data files in .csv format. Each file includes data as displayed in a corresponding figure in Bhatt et al. (2017).
Table 1. File names and descriptions.
The file names contain “_figX” to indicate the corresponding published figure in Bhatt et al. (2017). Please refer to the variable descriptions below, the respective figure's caption, and description in Bhatt et al. (2017) for more complete information.
| File name | Description |
|---|---|
| Time_series_SWI_NDVI_1982_2015_Fig2.csv | Time series of SWI, MaxNDVI, and TI-NDVI for growing seasons from 1982–2015 for the Arctic, Eurasia, and North America. |
| SWI_1982_2015_Fig4.csv | Time series SWI based on 2 m air temperature from the ERA-Interim reanalysis and AVHRR land surface temperature for North America and Eurasia. |
| Sea_ice_concentration_1982_2015_Fig6.csv | Arctic weekly sea ice climatology, trend, and trend statistical significance for 100 km zone for 1982–2015, 1982–1998, 1999–2015. |
| Ocean_heat_content_1998_2013_Fig7.csv | Arctic biweekly ocean heat content, trend, and trend statistical significance for 100 km zone from 1988–2013 for the Arctic, North America, and Eurasia. |
| Land_surface_temperature_1982_2015_Fig8.csv | Arctic weekly land surface temperature climatology trend, and trend statistical significance for the full tundra for 1982–2015, 1982–1998, 1999–2015. |
| MaxNDVI_1982_2015_Fig9.csv | Arctic biweekly NDVI, trend, and trend statistical significance for the full tundra for 1982–2015, 1982–1998, and 1999–2015. |
Table 2. Frequently used abbreviations
|
Abbreviation |
Description |
|---|---|
|
MaxNDVI |
The maximum NDVI (MaxNDVI) is the highest summer NDVI value, representing peak vegetation photosynthetic capacity, and serves as an indicator of tundra biomass. MaxNDVI is unitless. |
| SWI | Summer warmth index (SWI), the sum of the monthly mean temperatures above 0 °C from April to September. |
| TI-NDVI | The time-integrated NDVI (TI-NDVI) is the sum from May to September of biweekly values above a threshold value of 0.05, low enough to capture the often abrupt snowmelt. TI-NDVI incorporates the length of the growing season and phenological variations, better represents gross primary production than MaxNDVI |
Data Dictionary
Variables in the respective data files
Time_series_SWI_NDVI_1982_2015_Fig2.csv
| Column name | Units/format | Description |
|---|---|---|
| Analysis_domain | Results in this data file/figure (a,b,c) are for listed regions. | |
| Reference | Please reference this figure (a,b,c) in Bhatt et al. (2017) for more details and clarifications. | |
| Analysis_interval | Range of year(s) over which results were calcuated for this observation. | |
| Avg_interval_year | Interval (year) over which results were averaged for this observation. | |
| SWI_TS_Arctic | Degrees Celsius | Time series of SWI (°C) based on landsurface temperature from AVHRR source. Summer warmth index (SWI, the sum of the monthly mean temperatures above 0 °C from April to September). |
| SWI_TS_N_America | Degrees Celsius | Time series of SWI (°C) based on landsurface temperature from AVHRR source. Summer warmth index (SWI, the sum of the monthly mean temperatures above 0 °C from April to September). |
| SWI_TS_Eurasia | Degrees Celsius | Time series of SWI (°C) based on land surface temperature from AVHRR source. Summer warmth index (SWI, the sum of the monthly mean temperatures above 0 °C from April to September). |
| MaxNDVI_Arctic | The maximum NDVI (MaxNDVI) is the highest summer NDVI value, representing peak vegetation photosynthetic capacity, and serves as an indicator of tundra biomass. MaxNDVI is unitless. | |
| MaxNDVI_N_America | The maximum NDVI (MaxNDVI) is the highest summer NDVI value, representing peak vegetation photosynthetic capacity, and serves as an indicator of tundra biomass. MaxNDVI is unitless. | |
| MaxNDVI_Eurasia | The maximum NDVI (MaxNDVI) is the highest summer NDVI value, representing peak vegetation photosynthetic capacity, and serves as an indicator of tundra biomass. MaxNDVI is unitless. | |
| TI_NDVI_Arctic | The time-integrated NDVI (TI-NDVI) is the sum from May to September of biweekly values above a threshold value of 0.05, low enough to capture the often abrupt snowmelt. TI-NDVI incorporates the length of the growing season and phenological variations, better represents gross primary production than MaxNDVI. TI-NDVI is unitless. | |
| TI_NDVI_N_America | The time-integrated NDVI (TI-NDVI) is the sum from May to September of biweekly values above a threshold value of 0.05, low enough to capture the often abrupt snowmelt. TI-NDVI incorporates the length of the growing season and phenological variations, better represents gross primary production than MaxNDVI. TI-NDVI is unitless. | |
| TI_NDVI_Eurasia | The time-integrated NDVI (TI-NDVI) is the sum from May to September of biweekly values above a threshold value of 0.05, low enough to capture the often abrupt snowmelt. TI-NDVI incorporates the length of the growing season and phenological variations, better represents gross primary production than MaxNDVI. TI-NDVI is unitless. | |
| Reference_file | Data file provided by Investigator. |
SWI_1982_2015_Fig4.csv
| Column name | Units/format | Description |
|---|---|---|
| Analysis_domain | Results in this data file/figure (a,b,c) are for listed regions. | |
| Reference | Please reference this figure (a,b,c) in Bhatt et al. (2017) for more details and clarifications. | |
| Analysis_interval | Range of year(s) over which results were calculated for this observation. | |
| Avg_interval_year | Interval (year) over which results were averaged for this observation. | |
| SWI_TA-2m_N_America | Degrees Celsius | Time series of SWI (°C) based on 2-m air temperature from the ERA-Interim reanalysis source. Summer warmth index (SWI, the sum of the monthly mean temperatures above 0 °C from April to September). |
| SWI_TS_N_America | Degrees Celsius | Time series of SWI (°C) based on landsurface temperature from AVHRR source. Summer warmth index (SWI, the sum of the monthly mean temperatures above 0 °C from April to September). |
| SWI_TA-2m_Eurasia | Degrees Celsius | Time series of SWI (°C) based on 2-m air temperature from the ERA-Interim reanalysis source. Summer warmth index (SWI, the sum of the monthly mean temperatures above 0 °C from April to September). |
| SWI_TS_Eurasia | Degrees Celsius | Time series of SWI (°C) based on landsurface temperature from AVHRR source. Summer warmth index (SWI, the sum of the monthly mean temperatures above 0 °C from April to September). |
| SWI_TA-2m_Arctic | Degrees Celsius | Time series of SWI (°C) based on 2-m air temperature from the ERA-Interim reanalysis source. Summer warmth index (SWI, the sum of the monthly mean temperatures above 0 °C from April to September). |
| SWI_TS_Arctic | Degrees Celsius | Time series of SWI (°C) based on landsurface temperature from AVHRR source. Summer warmth index (SWI, the sum of the monthly mean temperatures above 0 °C from April to September). |
| Reference_file | Data file provided by Investigator. |
Sea_ice_concentration_1982_2015_Fig6.csv
| Column name | Units/format | Description |
|---|---|---|
| Analysis_domain | Results in this data file/figure (a,b,c) are for listed regions. | |
| Reference | Please reference this figure (a,b,c) in Bhatt et al. (2017) for more details and clarifications. | |
| Analysis_interval | Range of year(s) over which results were calculated for this observation. | |
| Avg_interval_week | Interval (weekly) over which results were averaged for this observation. | |
| Sea_ice_percent_conc_avg | % | Sea ice is in units of percent concentration for time period. |
| Sea_ice_percent_conc_std | % | One standard deviation. |
| Sea_ice_percent_conc_trnd | % | Trend is percent concentration over time period. |
| Sea_ice_percent_conc_trnd_sig | Trends statistical significance. | |
| Reference_file | Data file provided by Investigator. |
Ocean_heat_content_1998_2013_Fig7.csv
| Column name | Units/format | Description |
|---|---|---|
| Analysis_domain | Results in this data file/figure (a,b,c) are for listed regions. | |
| Reference | Please reference this figure (a,b,c) in Bhatt et al. (2017) for more details and clarifications. | |
| Analysis_interval | Range of year(s) over which results were calculated for this observation. | |
| Avg_interval_biweekly | Interval (biweekly) over which results were averaged for this observation. | |
| Heat_1988–2013_avg | MJ m-2 | Arctic ocean heat content is in units of MJ m-2 |
| Heat_1988–2013_std | MJ m-2 | One standard deviation. |
| Heat_1988–2013_trnd | MJ m-2/time period | Trend is MJ m-2 over 26 years (1988–2013). |
| Heat_1988–2013_trnd_sig | Trends statistical significance. | |
| Heat_1982-1990_avg | MJ m-2 | Arctic ocean heat content is in units of MJ m-2 |
| Heat_1991-2000_avg | MJ m-2 | Arctic ocean heat content is in units of MJ m-2 |
| Heat_2001-2013_avg | MJ m-2 | Arctic ocean heat content is in units of MJ m-2 |
| Reference_file | Data file provided by Investigator. |
Land_surface_temperature_1982_2015_Fig8.csv
| Column name | Units/format | Description |
|---|---|---|
| Analysis_domain | Results in this data file/figure (a,b,c) are for listed regions. | |
| Reference | Please reference this figure (a,b,c) in Bhatt et al. (2017) for more details and clarifications. | |
| Analysis_interval | Range of year(s) over which results were calculated for this observation. | |
| Avg_interval_week | Interval (weekly) over which results were averaged for this observation. | |
| Land_surface_temp_avg | Degrees Celsius | Arctic weekly land surface temperature climatology. Temperature is in units of °C. |
| Land_surface_temp_std | Degrees Celsius | One standard deviation. |
| Land_surface_temp_trnd | Degrees Celsius | Trend is °C over time period. |
| Land_surface_temp_trnd_sig | Trends statistical significance. | |
| Reference_file | Data file provided by Investigator. |
MaxNDVI_1982_2015_Fig9.csv
| Column name | Units/format | Description |
|---|---|---|
| Analysis_domain | Results in this data file/figure (a,b,c) are for listed regions. | |
| Reference | Please reference this figure (a,b,c) in Bhatt et al. (2017) for more details and clarifications. | |
| Analysis_interval | Range of year(s) over which results were calculated for this observation. | |
| Avg_interval_biweekly | Interval (biweekly) over which results were averaged for this observation. | |
| MaxNDVI_avg | The maximum NDVI (MaxNDVI) is the highest summer NDVI value, representing peak vegetation photosynthetic capacity, and serves as an indicator of tundra biomass. MaxNDVI is unitless. | |
| MaxNDVI_std | One standard deviation. | |
| MaxNDVI_trnd | Trend is change over time period. | |
| MaxNDVI_trnd_sig | Biweekly trend statistical significance. | |
| Reference_file | Data file provided by Investigator. |
Application and Derivation
These compiled data were used to document panarctic trends within a season over the period 1982–2015 for the Bhatt et al. (2017) paper. It focused particularly on seasonality of trends to investigate the times of year that are changing the most, and relating these to interactions between the vegetation and associated climate drivers.
Quality Assessment
Details of data compilation and processing methods, and statistical treatment of the data are described in Bhatt et al. (2017)
Data Acquisition, Materials, and Methods
Climate Driver Data
The sources of the climate driver data and their individual processing steps are described in Bhatt et al. (2017).
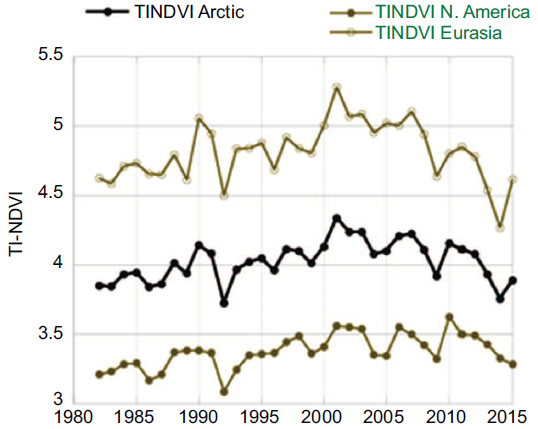
Figure 2. Time series of TI-NDVI (unitless) for each growing season from 1982–2015 for the Arctic, Eurasia, and North America. From Figure 2 (c) of Bhatt et al. (2017).
Analysis Methods
The scale of interest in the study is the Arctic non- alpine tundra and its continental divisions of North America and Eurasia. The analysis employs time series averaged over oceanic regions within 100 km of the Arctic coastline and over the full tundra domains at elevations < 300 m.
The least-squares-fit method was used to determine the trends of open water, SWI, MaxNDVI, and TI-NDVI in the spatial presentation. Spatial trends are shown as a magnitude change for Open Water, SWI, TI-NDVI, and MaxNDVI over the 34 years period and are based on the pixel size of the given data set.
The statistical significance of correlations and trends was assessed using the two-tailed Student’s t-test at the 95% or greater level. Climate data variability in the Arctic displays large-amplitude multi-decadal variability along with trends (Polyakov et al 2013) which reduces the degrees of freedom due to large autocorrelations from year-to-year. For significance testing the reduced degrees of freedom were calculated using a lag-1 autocorrelation method outlined by Santer et al (2000).
Data Access
These data are available through the Oak Ridge National Laboratory (ORNL) Distributed Active Archive Center (DAAC).
ABoVE: Climate Drivers of Pan-Arctic Tundra Vegetation Productivity, 1982-2015
Contact for Data Center Access Information:
- E-mail: uso@daac.ornl.gov
- Telephone: +1 (865) 241-3952
References
Uma S. Bhatt, Donald A. Walker, Martha K. Raynolds, Peter A. Bieniek, Howard E. Epstein, Josefino C. Comiso, Jorge E. Pinzon, Compton J. Tucker, Michael Steele, Wendy Ermold, and Jinlun Zhang. 2017. Changing seasonality of panarctic tundra vegetation in relationship to climatic variables. Environmental Research Letters, 12 (5) 055003. https://doi.org/10.1088/1748-9326/aa6b0b
Polyakov IV, Bhatt US, and Walsh JE. 2013. Recent oceanic changes in the Arctic in the contextof longer term observations. Ecol. Appl. 23, 1745–64.https://doi.org/10.1890/11-0902.1
Santer BD, Wigley TML, Boyle JS, Gaffen DJ, Hnilo JJ, Nychka D, Parker DE, and Taylor KE. 2000. Statistical significance of trends and trend differences in layer-average atmospheric temperature time series. J. Geophys. Res. 105 7337–56. https://doi.org/10.1029/1999jd901105