Documentation Revision Date: 2020-05-06
Dataset Version: 1
Summary
The soil process model was run at 8-day time step constrained by the temporal resolution of MODIS LST and SCE records. The soil freezing/thawing depth for each 8-day time step was determined as the soil depth crossing the 0°C threshold based on the model simulated soil temperature profile. These data characterize regional patterns and recent (2001-2015) changes in active layer thickness across Alaska and underlying environmental controls.
There is one data file in NetCDF (*.nc4) format with this dataset.
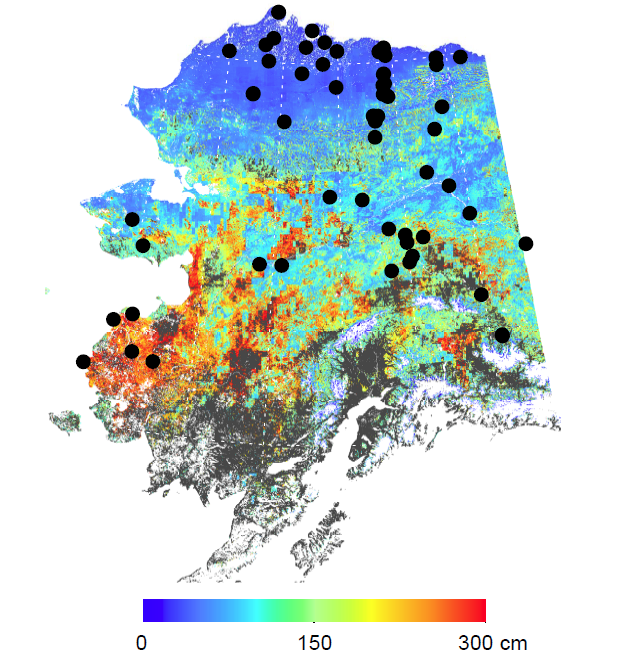
Figure 1. Model-simulated 1 km mean active layer thickness (ALT) map from 2001 to 2015. Black dots are locations of circumpolar active layer monitoring (CALM) sites used for comparison of observed ALT to modeled ALT. CALM data are not provided. The areas with ALT greater than 300 cm depth are shown in dark gray. (Source: Yi et al. 2018)
Citation
Yi, Y., and J.S. Kimball. 2020. ABoVE: Active Layer Thickness from Remote Sensing Permafrost Model, Alaska, 2001-2015. ORNL DAAC, Oak Ridge, Tennessee, USA. https://doi.org/10.3334/ORNLDAAC/1760
Table of Contents
- Dataset Overview
- Data Characteristics
- Application and Derivation
- Quality Assessment
- Data Acquisition, Materials, and Methods
- Data Access
- References
Dataset Overview
This dataset provides annual estimates of active layer thickness (ALT) at 1 km resolution across Alaska from 2001-2015. The ALT was estimated using a remote sensing-based soil process model incorporating global satellite data from Moderate Resolution Imaging Spectroradiometer (MODIS) land surface temperature (LST) and snow cover extent (SCE), and Soil Moisture Active and Passive (SMAP) satellite soil moisture records. The study area covers the majority land area of Alaska except for areas of perennial ice/snow cover or open water. The ALT was defined as the maximum soil thawing depth throughout the year. The mean ALT and mean uncertainty from 2001 to 2015 are also provided.
The soil process model was run at 8-day time step constrained by the temporal resolution of MODIS LST and SCE records. The soil freezing/thawing depth for each 8-day time step was determined as the soil depth crossing the 0°C threshold based on the model simulated soil temperature profile. These data characterize regional patterns and recent (2001-2015) changes in active layer thickness across Alaska and underlying environmental controls.
Project: Arctic-Boreal Vulnerability Experiment
The Arctic-Boreal Vulnerability Experiment (ABoVE) is a NASA Terrestrial Ecology Program led field campaign based in Alaska and western Canada between 2016 and 2021. Research for the ABoVE links field-based, process-level studies with geospatial data products derived from airborne and satellite sensors, providing a foundation for improving the analysis and modeling capabilities needed to understand and predict ecosystem responses and societal implications.
Related Publication:
Yi, Y., J. S. Kimball, R. H. Chen, M. Moghaddam, R.H. Reichle, U. Mishra, et al. 2018. Characterizing permafrost active layer dynamics and sensitivity to landscape spatial heterogeneity in Alaska. The Cryosphere, 12(1):145-161. https://doi.org/10.5194/tc-12-145-2018
Acknowledgments
This research received funding from NASA ABoVE (NNX15AT74A) and from NASA's interdisciplinary science program (NNX14AO23G).
Data Characteristics
Spatial Coverage: the study area covers most of the land areas in Alaska, except for perennial ice/snow or open water areas.
ABoVE Reference Locations
Domain: Core ABoVE
State/territory: Alaska
Note that the data are not provided in the ABoVE Grid.
Spatial resolution: 1 km
Temporal coverage: 01-01-2001 to 12-31-2015 (annual and mean maps)
Study Areas: All latitude and longitude given in decimal degrees.
| Region | Westernmost Longitude | Easternmost Longitude | Northernmost Latitude | Southernmost Latitude |
|---|---|---|---|---|
| Alaska | -179.17961 | -132.57585 | 70.21395 | 55.56666 |
Data File Information
There is only one file with this dataset in NetCDF (.nc) format.
Data File Details
Coordinate Reference System: EPSG: 3338 (NAD83 / Alaska Albers)
Projection: Albers Conical Equal Area
Fill value: -999
Table 1. Variables names and descriptions in Alaska_active_layer_thickness_1km_2001-2015.nc4.
| Variable | Units | Description |
|---|---|---|
| ALT | m | annual active layer thickness |
| ALT_mean | m | mean active layer thickness averaged from 2001 to 2015 |
| ALT_uncertainty | m | mean active layer thickness uncertainty averaged from 2001 to 2015 |
| crs | coordinate reference system | |
| lat | degrees N | latitude coordinate |
| lon | degrees E | longitude coordinate |
| time | days since 2001-01-01 00:00:00 | the middle date of each year |
| time_bnds | days since 2001-01-01 00:00:00 | start and end time of each timestamp |
| x | m | projection x coordinate |
| y | m | projection y coordinate |
Application and Derivation
Understanding the linkages between changes in the permafrost active layer and hydrologic and ecological processes is hampered by inconsistent information on active layer properties and dynamics over large regional extents at a landscape scale (≤ 1km). Traditional estimates of permafrost active layer conditions have relied on detailed ground surveys and measurements from sparse monitoring sites. Other studies used empirical models driven by in-situ ground observations and other geospatial datasets to provide fine-scale (< 100 m resolution) estimates of active layer and near-surface permafrost conditions. However, the accuracy of these methods is limited by the ability of sparse ground measurements representing landscape heterogeneity, a lack of mechanistic understanding of underlying processes affecting active layer conditions. Yi et al. (2018) developed a remote sensing-based soil process model to characterize regional patterns and recent (2001-2015) changes in ALT across Alaska and underlying environmental controls.
Quality Assessment
The accuracy of the ALT was evaluated by comparing it with in situ ALT measurements from the CALM (Brown et al., 2000) network (Fig. 1). An integrated analysis was conducted of the CALM measurements, soil process model simulations, and airborne radar retrievals of soil moisture and ALT over a regional flight transect along the Dalton Highway in northern Alaska. The airborne radar retrievals were derived from combined (LCP band) radar backscatter measurements acquired from coordinated UAVSAR and AirMOSS flights acquired in October 2015 in preparation for the NASA ABoVE campaign. See Yi et al. (2018) for details.
Data Acquisition, Materials, and Methods
Following is a brief synopsis of the data assimilation and modeling efforts described in Yi et al. (2018).
A remote sensing permafrost model was developed based on a detailed permafrost hydrology process model to ingest satellite and airborne remote sensing measurements in order to reduce uncertainties in the surface meteorology inputs and also account for landscape spatial heterogeneity. The model uses the same numerical approach to solve the 1-D heat transfer model with phase change included to simulate snow/ground and subsurface thermal dynamics and temperature profiles. Satellite-based LST time series were used with snow depth and density data from global reanalysis as major model drivers, with soil thermal properties parameterized using soil moisture profiles from a global data assimilation system. The MODIS LST and SMAP L4SM products were used to define model boundary conditions and soil thermal properties. The model was spun-up using data in 2000, followed by a transit run from 2001 to 2015.
SOC fraction, soil moisture and snow cover conditions are among the most important factors controlling permafrost active layer conditions at the landscape scale. Model sensitivity analyses were conducted to investigate the ALT sensitivity to uncertainties in regional SOC fraction, soil moisture and snow density. The modeled ALT uncertainties were calculated as the standard deviation between the model baseline simulations and a set of model sensitivity runs conducted over the study period by adding uncertainties into the regional SOC map (including total SOC content and vertical distribution), SM, and snow density data used as model inputs. ALT uncertainty maps show similar spatial pattern from 2001 to 2015; therefore, only the mean uncertainty map averaged from 2001 to 2015 was included in the final dataset.
Data Access
These data are available through the Oak Ridge National Laboratory (ORNL) Distributed Active Archive Center (DAAC).
ABoVE: Active Layer Thickness from Remote Sensing Permafrost Model, Alaska, 2001-2015
Contact for Data Center Access Information:
- E-mail: uso@daac.ornl.gov
- Telephone: +1 (865) 241-3952
References
Brown, J., K.M. Hinkel, and F.E. Nelson. 2000. The circumpolar active layer monitoring (CALM) program: Research designs and initial results. Polar Geography, 24:166-258. https://doi.org/10.1080/10889370009377698
Yi, Y., J. S. Kimball, R. H. Chen, M. Moghaddam, R.H. Reichle, U. Mishra, et al. 2018. Characterizing permafrost active layer dynamics and sensitivity to landscape spatial heterogeneity in Alaska. The Cryosphere, 12(1):145-161. https://doi.org/10.5194/tc-12-145-2018