Documentation Revision Date: 2020-07-15
Dataset Version: 1
Summary
These data are significant because they are the first landscape-scale estimates of methane ebullition from lakes on a lake-by-lake basis. These data also serve as a baseline for future methane estimates.
There are five shapefiles provided in ZIP format. For each data file, an identical companion file is provided in KML format.
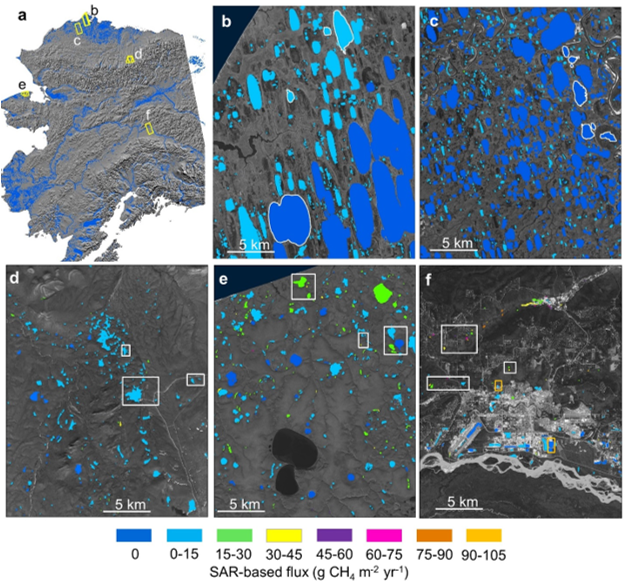
Figure 1. SAR-based lake ebullition maps. Panel A shows Alaska study regions with SAR footprints outlined in yellow. Subsequent panels show SAR-based CH4 ebullition maps for B) Barrow Peninsula, C) Atqasuk, D) Toolik, E) northern Seward Peninsula, and F) Fairbanks. Study lakes with field-based measurements are outlined (B,C) or boxed (D,E,F) in white. Orange boxes in panel F indicate anthropogenic study lakes. Source: Engram et al. (2020).
Citation
Engram, M.J., K.W. Anthony, and F.J. Meyer. 2020. ABoVE: SAR-based Methane Ebullition Flux from Lakes, Five Regions, Alaska, 2007-2010. ORNL DAAC, Oak Ridge, Tennessee, USA. https://doi.org/10.3334/ORNLDAAC/1790
Table of Contents
- Dataset Overview
- Data Characteristics
- Application and Derivation
- Quality Assessment
- Data Acquisition, Materials, and Methods
- Data Access
- References
Dataset Overview
This dataset provides Synthetic Aperture Radar (SAR) estimates of lake-source methane ebullition flux in mg CH4/m2/d for thousands of lakes in five regions across Alaska. The study regions include the Atqasuk, Barrow Peninsula, Fairbanks, northern Seward Peninsula, and Toolik. L-band SAR backscatter values for early winter lake ice scenes were collected from 2007 to 2010 over 5,143 lakes using the Phased Array type L-band Synthetic Aperture Radar (PALSAR) instrument on the Advanced Land Observing Satellite (ALOS-1) satellite. The backscatter data were combined with field measurements of methane ebullition from 48 study lakes across the five regions to obtain a volumetric flux estimate for each lake. Mean methane gas-fractions from each region were applied to the SAR-based volumetric fluxes to obtain an estimate of methane ebullition mass flux per lake. The data files contain lake perimeters and the lake-specific attributes of lake area, SAR backscatter values and standard errors, volumetric flux with standard errors, mean percent of methane from gas samples, and methane ebullition mass flux.
These data are significant because they are the first landscape-scale estimates of methane ebullition from lakes on a lake-by-lake basis. These data also serve as a baseline for future methane estimates to detect change.
Project: Arctic-Boreal Vulnerability Experiment
The Arctic-Boreal Vulnerability Experiment (ABoVE) is a NASA Terrestrial Ecology Program field campaign being conducted in Alaska and western Canada, for 8 to 10 years, starting in 2015. Research for ABoVE links field-based, process-level studies with geospatial data products derived from airborne and satellite sensors, providing a foundation for improving the analysis, and modeling capabilities needed to understand and predict ecosystem responses to, and societal implications of, climate change in the Arctic and Boreal regions.
Related Publications
Engram, M., K.M.W. Anthony, T. Sachs, K. Kohnert, A. Serafimovich, G. Grosse, and F.J. Meyer. 2020. Remote sensing northern lake methane ebullition. Nature Climate Change. 10, 511–517 (2020). https://doi.org/10.1038/s41558-020-0762-8
Acknowledgments
This study was funded by the NASA Arctic-Boreal Vulnerability Experiment (ABoVE), grant number NNX15AU49A.
Data Characteristics
Spatial Coverage: Atqasuk, Barrow Peninsula, Fairbanks, Northern Seward Peninsula, and Toolik areas of Alaska
ABoVE Reference Locations
Domain: Core ABoVE
Grid cells: Ch049v006, Ch046v007, Ch047v007, Ch048v007, Ch049v007, Ch050v007, Ch028v008, Ch029v008, Ch045v008, Ch046v008, Ch047v008, Ch048v008, Ch049v008, Ch050v008, Ch028v009, Ch029v009, Ch045v009, Ch046v009, Ch047v009, Ch048v009, Ch049v009, Ch028v010, Ch029v010, Ch048v019, Ch047v020, Ch048v020, Ch049v020, Ch047v021, Ch048v021, Ch049v021, Ch039v032, Ch040v032, Ch041v032, Ch038v033, Ch039v033, Ch040v033, Ch039v034, Ch040v034
Spatial Resolution: 12.5 m
Temporal Coverage: 2007-11-13 to 2010-11-11
Temporal Resolution: Varied
Study Area: Latitudes and longitudes are provided in decimal degrees.
| Site | Westernmost Longitude | Easternmost Longitude | Northernmost Latitude | Southernmost Latitude |
|---|---|---|---|---|
| Alaska | -166.4147186 | -147.0787811 | 71.8751632 | 64.64993565 |
| Atqasuk | -158.33694 | -156.99355 | 70.74732 | 70.12046 |
| Barrow Peninsula | -157.19584 | -155.89205 | 71.35431 | 70.58491 |
| Fairbanks | -148.10392 | -147.36459 | 64.96433 | 64.44396 |
| Northern Seward Peninsula | -165.16856 | -164.09616 | 66.58414 | 66.29941 |
| Toolik | -150.10970 | -149.01699 | 68.85047 | 68.46685 |
Data File Information
There are five shapefiles provided in ZIP format. For each data file, an identical companion file is provided in KML format.
Data and companion file names:
- atqasuk.zip, atqasuk.kml
- barrow_peninsula.zip, barrow_peninsula.kml
- fairbanks.zip, fairbanks.kml
- northern_seward_peninsula.zip, northern_seward_peninsula.kml
- toolik.zip, toolik.kml
Data File Details
Table 1. Attributes for each file, which provide the perimeters of the lakes in the respective study region. All files share the same attributes.
| Variable | Units | Description |
|---|---|---|
| ID | A lake ID number that is unique within regions. | |
| AreaSqkm | square kilometers | Lake area in square km. Lake area is calculated prior to buffering the shoreline. |
| BUFF_DIST | meters | Buffered distance inward from shoreline in meters. |
| N_scenes | Number of SAR scenes that cover the lake. | |
| SAR_allYrs | powerscale | Mean SAR backscatter intensity (T11 component) for the lake for all n scenes covering the lake. |
| SE_SARall | powerscale | The standard error of SAR_allYrs, calculated as the standard deviation divided by the square root of one-fourth the pixel count. The pixel count was divided by four to account for smoothing that occurred during the speckle-filtering process. |
| SAR_eFlux | ml gas m-2d-1 | The SAR-based volumetric gas flux, calculated by inverting the empirical regression model, expressed in ml gas m-2d-1. |
| SE_SAReFlx | ml gas m-2d-1 | The standard error of SAR_eFlux, calculated as the standard deviation divided by the square root of one-fourth the pixel count. The pixel count was divided by four to account for smoothing that occurred during the speckle-filtering process. |
| Prcnt_CH4 | percentage | The average methane gas-fraction from gas samples in the region used to convert volumetric flux to mass flux. |
| MassFlxCH4 | mg CH4 m-2d-1 | The mass flux, calculated with the Prcnt_CH4 value and standard gas laws. |
| Count_YYYY* | Pixel count (12.5-m pixels) of processed SAR data for the lake for the year specified YYYY. Years are shown in Table 2. | |
| Mean_YYYY* | powerscale | Mean SAR backscatter intensity (T11 component) for the lake for year YYYY. |
| SE_YYYY* | powerscale | Standard Error of Mean_YYYY, calculated as the standard deviation divided by the square root of one-fourth the pixel count. The pixel count was divided by four to account for smoothing that occurred during the speckle-filtering process. |
* These variables are used in multiple columns (differing by the year) for the number of independent SAR acquisition dates provided in Table 2.
Table 2. SAR acquisition dates (YYYY-MM-DD) and the associated date (YYYY) provided in the files.
| Region | SAR Acquisition Date | File Date |
|---|---|---|
| Atqasuk | 2009-11-15 | 2009 |
| Barrow Peninsula | 2008-11-05 | 2008 |
| Barrow Peninsula | 2009-11-08 | 2009 |
| Barrow Peninsula | 2010-11-11 | 2010 |
| Fairbanks | 2009-11-27 | 2009 |
| Northern Seward Peninsula | 2007-11-24 | 2007 |
| Toolik | 2009-11-14 | 2009 |
| Toolik | 2007-11-13 | 2007a |
| Toolik | 2007-12-04 | 2007b |
| Toolik | 2009-12-09 | 2009 |
Table 3. CRS for each file.
| Region | UTM Zone | EPSG |
|---|---|---|
| Atqasuk | 4 | 26904 |
| Barrow Peninsula | 5 | 26905 |
| Fairbanks | 6 | 26906 |
| Northern Seward Peninsula | 3 | 26903 |
| Toolik | 5 | 26905 |
Application and Derivation
These data are significant because they are the first landscape-scale estimates of methane ebullition from lakes on a lake-by-lake basis. Regional summations can be calculated from these data along with comparisons to other regions. Users are encouraged to use the area-weighted means formula to compile the data from individual lakes provided into regional means (Engram et al., 2020). Inter-region analyses can be performed, answering such questions as, “Do SAR-based methane estimates vary across regions?” Other applications include comparison with independent methane observations/measurements on either individual-lake or landscape scales. These data also serve as a baseline for future methane estimates to detect change.
Calculating regional lake-source CH4 fluxes using weighted means
In Engram et al. (2020), both SAR- and field-based regional CH4 fluxes were calculated by weighting the average flux of a lake by its surface area in order to accurately represent each lake’s CH4 contribution to the regional flux, according to the standard weighted mean formula
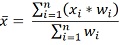
where x is the mean SAR-based flux, n is the number of study lakes in the region, and w is the area of the study lake. To calculate an unweighted field-based regional flux estimate, the mean flux from individual lakes in each region was used without considering lake area.
Quality Assessment
Uncertainties in scaling-up field measurements compared to SAR-based methane fluxes were assessed according to Engram et al. (2020) by randomly selecting n lakes from a region, where n is the number of lakes with field measurements, then calculating the SAR-based flux for the region with the limited number of lakes and comparing it to the SAR-based flux from all of the lakes in the region. Other uncertainties in SAR-based flux estimates are detailed in Engram et al. (2020), as well as the dominant mechanism of scattering from methane bubbles trapped in and under lake ice and probable physical cause of increased backscatter with more gas flux. Lake perimeters were manually checked against optical imagery for each region.
Data Acquisition, Materials, and Methods
The study areas included five lake-rich geographic regions in Alaska: Atqasuk, Barrow Peninsula, Fairbanks, northern Seward Peninsula, and Toolik region.
| Region | Barrow Peninsula | Atqasuk | Toolik | Seward Peninsula | Fairbanks |
|---|---|---|---|---|---|
| SAR-studied lakes | 1,448 | 2,397 | 491 | 629 | 178 |
Following is a brief synopsis of the data collection and analysis methods described in Engram et al. (2020).
Lake Perimeters
- Perimeters for Barrow Peninsula and the Atqasuk region were obtained from the dataset wacp_IfSAR_lakes_with_drainage_gradients.zip (https://www.sciencebase.gov/catalog/item/5a0ae5e5e4b09af898cb609c).
- Perimeters for the Toolik, northern Seward Peninsula, and Fairbanks regions were derived from IfSAR data:
- Toolik lake perimeters were derived from the 2003-2006 IfSAR DEM, where slope equals zero;
- Northern Seward Peninsula perimeters were derived from the 2012 IfSAR digital surface model, where slope equals zero;
- Fairbanks perimeters were derived from the 2010 IfSAR ORRI, then manually checked against 2009 photogrammetry hosted by the Fairbanks North Star Borough (https://gisportal.fnsb.us/enterprise/apps/webappviewer/index.html?id=fac2c97817994436a5fcb324ea839d65) and edited for changes in gravel pits/gold mining ponds.
Selection and Processing of SAR Scenes
Lake perimeters were buffered inwardly by the number of meters in field “BUFF_DIST” and the buffered polygons were used to select lake ice pixels from early winter synthetic aperture radar (SAR) scenes. Data were processed with PolSAR-Pro software to polarimetric parameters (T11, T22, T33), then terrain corrected and projected to UTM NAD83 projected GEOTIFF files in MapReady software.
Seep Surveys
Ebullition was estimated from lake sediments associated with discrete seeps following the lake-ice ebullition survey method of Walter Anthony et al. (2010). The data are not included in this dataset.
On foot, 12,068 individual seeps were surveyed within 196 plots on 48 training/calibration lakes. Ice-bubble survey plots were typically 1 m wide transects originating from margins, oriented perpendicular to the shores and extending toward the lake center. Lake-center transects were also surveyed.
Ice was opened above a subset of seeps to place submerged bubble traps to convert seep densities to estimates of year-round volumetric ebullition. Semi-automated bubble traps coupled to Onset event data loggers recorded the timing of tipping events caused by bubbles filling tipping cups of known, calibrated volumes. Bubble traps remained in a fixed place over individual seeps year-round, providing daily and seasonal bubbling rates for individual seeps. Fluxes from other seeps were measured over the short term (<6 days) using manual bubble traps. Altogether, the seep flux data set consists of ~210,000 individual flux measurements made using submerged bubble traps placed over ebullition seeps year-round. These seep class-specific flux rates measured on a subset of seeps were applied to all mapped seeps in ice-bubble surveys as a basis for our field-based estimate of regional ebullition.
Bubble Methane Concentration
Mass-based estimates of CH4 ebullition were determined by applying region-specific measurements of bubble CH4 concentrations determined for 519 distinct ebullition events on 39 lakes where seep-bubble gases were collected and measured following methods detailed by Anthony et al. (2018) and Greene et al. (2014). In Atqasuk, where no seep-bubble gas concentrations were determined, mean CH4 concentration values for the North Slope were applied.
SAR Data
L-band SAR data acquired in the quad-pol mode via earth-orbiting satellite by the Japan Aerospace Exploration Agency’s (JAXA’s) Phased Array type L-band Synthetic Aperture Radar (PALSAR) were decomposed into coherency matrix [T3] polarimetric parameters, terrain corrected using high-resolution elevation data from an airborne IfSAR dataset, and processed to map-projected calibrated intensity images with 12.5 m pixel size. Geolocation of each SAR image was checked and manually refined with lateral translation in a geographic information system.
Model Development and Validation
The mean SAR value for each lake (along with pixel count and standard deviation) were calculated in ArcMap. When SAR backscatter from individual study lakes was plotted against fluxes measured by bubble surveys, the resulting graph showed that space-borne L-band SAR backscatter, when acquired within a specific window in early winter using specific imaging parameters, significantly correlated with CH4 ebullition field measurements from 48 lakes in five geographic regions in Alaska. New data collected from 16 validation lakes from two of the study regions fit well within the 95% confidence limits of the region model.
The regression model was then inverted to estimate volumetric ebullition (ml gas m-2 of lake d-1) from SAR backscatter for 5,143 ice-covered lakes in the five geographic regions in Alaska. In cases with multiple years of SAR data, the values were averaged from lakes in overlapping scenes from different years before calculating gas flux by inverting the regression model. Any lake with a mean backscatter of less than the y-intercept of the regression model (0.02) was set to zero to preclude the generation of negative flux values. Errors were propagated using formal error propagation methods based on standard error.
Methane Flux
Since SAR backscatter is affected only by the physical properties of gas bubbles trapped in and under lake ice and presumably is insensitive to bubble CH4 content, the volumetric fluxes were inverted to CH4 mass fluxes (mg CH4 m-2 of lake d-1) using the ideal gas law and partial pressure of CH4 measured with bubble traps for each region.
Data Access
These data are available through the Oak Ridge National Laboratory (ORNL) Distributed Active Archive Center (DAAC).
ABoVE: SAR-based Methane Ebullition Flux from Lakes, Five Regions, Alaska, 2007-2010
Contact for Data Center Access Information:
- E-mail: uso@daac.ornl.gov
- Telephone: +1 (865) 241-3952
References
Engram, M., K M. Walter Anthony, T. Sachs, K. Kohnert, A. Serafimovich, G. Grosse, and F.J. Meyer. 2020. Remote sensing northern lake methane ebullition. Nature Climate Change. 10, 511–517 (2020). https://doi.org/10.1038/s41558-020-0762-8
Greene, S.B., K.M. Walter Anthony, D. Archer, D., A. Sepulveda-Jauregui, and K. Martinez-Cruz. 2014. Modeling the impediment of methane ebullition bubbles by seasonal lake ice. Biogeosciences, 11: 6791–6811. https://doi.org/10.5194/bg-11-6791-2014
Walter Anthony, K.M., T. Schneider von Deimling, I. Nitze, S. Frolking, A. Emond, R. Daanen, P. Anthony, P. Lindgren, B. Jones, and G Grosse. 2010. Estimating methane emissions from northern lakes using ice-bubble surveys. Limnology and Oceanography: Methods, 8: 592–609. https://doi.org/10.4319/lom.2010.8.0592