Documentation Revision Date: 2019-07-20
Dataset Version: 1
Summary
This dataset includes 645 observations of river ice breakup or freeze-up stages on the Yukon and Tanana Rivers near the communities of Beaver, Grayling, and Tok, Alaska. Not all stages were observed each year, and in some years, multiple dates of the same stage were observed. Independent datasets of local observations were used to validate the remote sensing classifications. The purpose of this study was to determine how river ice seasonality has changed over time and how the changes impact people who depend on rivers for travel and access to subsistence resources (Brown et al. 2018).
There is one data file in comma-separated format (.csv) with this dataset.
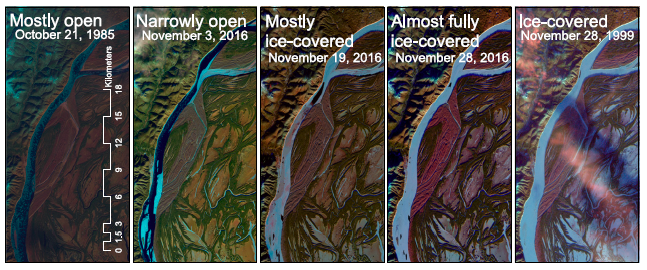
Figure 1. Examples of freeze-up stages in the Grayling study area. Landsat images are displayed as color composites (R: SWIR, G: NIR, B: green), where water appears dark blue and snow/ice appears light blue. From Brown et al. (2018).
Citation
Brown, D.R.N., T.J. Brinkman, and D. Verbyla. 2019. ABoVE: River Ice Breakup and Freeze-up Stages, Yukon River Basin, Alaska, 1972-2016. ORNL DAAC, Oak Ridge, Tennessee, USA. https://doi.org/10.3334/ORNLDAAC/1697
Table of Contents
- Dataset Overview
- Data Characteristics
- Application and Derivation
- Quality Assessment
- Data Acquisition, Materials, and Methods
- Data Access
- References
Dataset Overview
This dataset provides estimates of river ice breakup and freeze-up stages along selected reaches of the Yukon and Tanana Rivers in the Yukon River Basin in interior Alaska from 1972-2016. Time series of Landsat satellite images were visually interpreted to identify the day of year and characteristics of the different stages of river ice seasonality. The stages of breakup or freeze-up were distinguished from one another based on the spatial extent and patterns of open water and ice cover. Images were displayed as false color composites, with the shortwave infrared (SWIR), near infrared (NIR), and green bands represented by red, green, and blue. The purpose of this study was to determine how river ice seasonality has changed over time and how the changes impact people who depend on rivers for travel and access to subsistence resources.
This dataset includes 645 observations of river ice breakup or freeze-up stages on the Yukon and Tanana Rivers near the communities of Beaver, Grayling, and Tok, Alaska. Not all stages were observed each year, and in some years, multiple dates of the same stage were observed. Independent datasets of local observations were used to validate the remote sensing classifications.
Project: Arctic-Boreal Vulnerability Experiment
The Arctic-Boreal Vulnerability Experiment (ABoVE) is a NASA Terrestrial Ecology Program field campaign based in Alaska and western Canada between 2016 and 2021. Research for ABoVE links field-based, process-level studies with geospatial data products derived from airborne and satellite sensors, providing a foundation for improving the analysis and modeling capabilities needed to understand and predict ecosystem responses and societal implications.
Related Publication:
Brown, D.R.N., T.J. Brinkman, D.L. Verbyla, C.L. Brown, H.S. Cold, and T.N. Hollingsworth. 2018. Changing River Ice Seasonality and Impacts on Interior Alaskan Communities. Journal of the American Meteorological Society, https://doi.org/10.1175/WCAS-D-17-0101.1
Acknowledgements:
This research was funded by the NASA ABoVE program, grant number NNX15AT72A.
Data Characteristics
Spatial Coverage: Alaska
ABoVE Reference Locations:
Domain: Core ABoVE
State/territory: Alaska
Grid cell(s): Ah0Av0Bh3Bv3Ch21Cv22, Ah1Av0Bh7Bv4Ch44Cv29, Ah1Av1Bh7Bv7Ch42Cv42
Spatial Resolution: Observations were derived from 30 m Landsat imagery along river reaches within a 65 km diameter buffer area around each community.
Temporal Coverage: 1972-11-04 to 2016-11-30
Temporal Resolution: Spring breakup and Fall freeze-up seasons
Study Areas (All latitude and longitude given in decimal degrees based on NAD83 datum.)
| Region | Westernmost Longitude | Easternmost Longitude | Northernmost Latitude | Southernmost Latitude |
|---|---|---|---|---|
| Yukon River Basin | -160.0647 | -142.9856 | 66.3594 | 62.9036 |
| Focal Communities* | ||||
| Beaver | -147.3964 | -147.3964 | 66.3594 | 66.3594 |
| Grayling | -160.0647 | -160.0647 | 62.9036 | 62.9036 |
| Tok | -142.9856 | -142.9856 | 63.3367 | 63.3367 |
* Community locations: The study area for each community was a 65 km diameter circle centered on the community.
Data File Information
There is one data file in comma-separated format (.csv) with this dataset.
Table 1. Data file description
|
river_ice_stages_landsat.csv |
This file provides the latitude, longitude, year and day for river ice breakup or freeze-up for three study areas in Alaska (Beaver, Grayling, and Tok) and descriptions regarding the breakup or freeze-up stages. The Landsat IDs used in the study are also provided. |
Table 2. Variables in the data file.
| Column Header | Units/format | Description |
|---|---|---|
| id | Unique record identifier (1-645 rows of observations) | |
| study_area | Study area (Beaver, Grayling, Tok) | |
| latitude | Decimal degrees | Latitude of center of study area (NAD83) |
| longitude | Decimal degrees | Longitude of center of study area (NAD83) |
| season | Season (break-up, freeze-up) | |
| year | YYYY | Year |
| day_of_year | DDD | Day of year of imagery acquisition |
| river_ice_stage | Visually interpreted stage of river ice breakup or freeze-up. Refer to Table 3 for descriptions of the observations | |
| landsat_id_1 | ID of Landsat scene used for analysis | |
| landsat_id_2 | ID of additional Landsat scene used for analysis |
Table 3. Description of Stages of Break-up/Freeze-up
| River Ice Stages | Description |
|---|---|
| Break-up stages | |
| ice-covered | River is ice-covered except for isolated open water features |
| somewhat deteriorated | River is predominantly ice-covered but large open water leads are widespread |
| severely deteriorated | River has nearly contiguous expanse of ice but is severely deteriorated with large expanses of open water |
| partially open | Active breakup; river has open stretches but large expanses remain clogged with ice |
| mostly open | River is mostly open, but main channel still has floating ice; some sloughs may still have contiguous ice |
| open | River is clear of ice |
| Freeze-up stages | |
| open | River is clear of ice |
| mostly open | River is mostly open, but initial freezing has begun; some sloughs and tributaries may be ice-covered |
| narrowly open | Sides of main channel are ice-covered, leaving a narrow open channel; most sloughs and tributaries are ice-covered |
| mostly ice-covered | Some stretches of river are fully ice-covered and some stretches have open water |
| almost fully ice-covered | River is almost fully ice-covered but has widespread open water leads. |
| ice-covered | River is fully ice-covered except for isolated open water leads |
Application and Derivation
This study could be useful to climate change policies considering the economics and human safety impacts from climate warming on communities in Alaska. Subsistence harvesters in high latitudes rely on frozen rivers for winter access to local resources. During recent decades, interior Alaskan residents have observed changes in river ice regimes that are significant hindrances to travel and subsistence practices. The duration of river ice cover for safe travel has declined over the last century and is expected to decline further as the climate continues to warm, thereby presenting new challenges to accessing subsistence resources and necessitating community adaptation (Brown et al., 2018).
Quality Assessment
The qualitative classifications of breakup stage were tested and validated by close associations with local observations and by normalized difference water index-based classifications showing consistent spatial cover of open water or deteriorated ice within each stage (Brown et al., 2018).
Data Acquisition, Materials, and Methods
The following sections are excerpts from Brown et al. (2018).
Study Area
The Yukon River, approximately 3,200 km in length, flows from northwestern Canada through interior Alaska and into the Bering Sea. The Tanana River is one of two major tributaries to the Yukon River that is glacier fed. Most streamflow occurs in summer from snowmelt, precipitation, and glacial melt. The Yukon River Basin encompasses diverse climatic and physiographic areas with varying permafrost extent, from sporadic to continuous. The basin covers a region that is predominantly composed of boreal forest vegetation and is generally characterized by a cold continental climate with low precipitation. Of the nine rural interior Alaskan communities in the Yukon River Basin associated with a larger study, three communities representing different regions were selected as the primary study sites: Beaver, Grayling, and Tok (Figure 2).
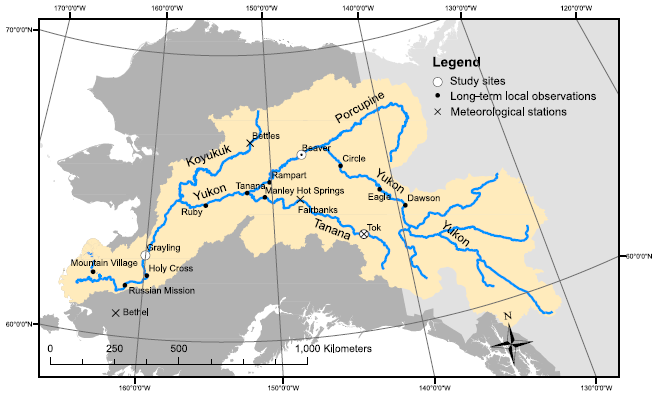
Figure 2. Map of Yukon River Basin (tan) in Alaska and western Canada showing the locations of major rivers, study sites, long-term local observations, meteorological stations (image is from Brown et al., 2018).
A 65-km diameter buffer was used to determine the study area around each community. The size of the study area was chosen to both represent core subsistence areas and maximize the sample size of remote sensing observations. Beaver (pop. 84) is located in the Yukon Flats region in the upper Yukon River. Contemporary Beaver is self-reported as 100% Alaska Native. Grayling (pop. 193) is a Holikachuk Athabascan community located along the lower–middle Yukon River. Tok (pop. 1258) is in eastern Alaska near the upper Tanana River. Of the three study communities, Tok has a much different ethnic profile, with only 16% of residents self-reporting as Alaska Native. Unlike Beaver and Grayling, Tok is located along the road network.
Satellite imagery
Satellite imagery from Landsat Multispectral Scanner (MSS), Thematic Mapper (TM), Enhanced Thematic Mapper Plus (ETM1), and Operational Land Imager (OLI) sensors were acquired from the United States Geological Survey (USGS; USGS 2017). Scenes during the shoulder seasons from each of the three study areas were used from 1972 to 2016. The full breakup season was captured using imagery from mid-March through May. Imagery from mid-October through November was used for the freeze-up season. Because of low sun elevation, imagery was generally not available beyond mid-November, limiting the ability to capture the end of the freeze-up season in many years. The repeat orbit cycle for each Landsat satellite is 16 days. However, at the high latitudes of our study areas, there was substantial overlap between passes, allowing for repeat coverage at less than a 16-day cycle. Historic imagery was used from 313 dates during the spring breakup period and 120 dates during the fall freeze-up period. The satellite imagery was visually interpreted to determine different stages of the breakup and freeze-up seasons and to determine their timing. Stages of breakup or freeze-up were distinguished from one another based on spatial extent and patterns of open water or ice cover. Images were displayed as false color composites, with the shortwave infrared (SWIR), near infrared (NIR), and green bands represented by red, green, and blue. High values in the thermal bands were also sometimes used to differentiate water from other dark surfaces during the freeze-up season.
Not all stages were observed each year, and in some years, multiple dates of the same stage were observed. To test whether the visual interpretations were conducted consistently and reliably, quantitative estimates were compared of the spatial extent of ice deterioration among the different breakup stages in the Beaver study area. This validation was limited to the breakup season because low sun angles and resulting shadows during the freeze-up season inhibited the use of band indices.
Local observations
Independent datasets of local observations were used to validate the remote sensing classifications. The Alaska–Pacific River Forecast Center (APRFC) of the National Weather Service maintains databases of local observations of breakup (APRFC 2017a) and freeze-up (APRFC 2017b) for locations throughout the state. These observations were made by ice observers for the National Weather Service who were either local residents or hydrologists.
Data Access
These data are available through the Oak Ridge National Laboratory (ORNL) Distributed Active Archive Center (DAAC).
ABoVE: River Ice Breakup and Freeze-up Stages, Yukon River Basin, Alaska, 1972-2016
Contact for Data Center Access Information:
- E-mail: uso@daac.ornl.gov
- Telephone: +1 (865) 241-3952
References
APRFC, 2017a: Break up database. Alaska–Pacific River Forecast Center, National Weather Service, accessed 22 February 2017, https://www.weather.gov/aprfc/breakupDB
APRFC, 2017b: Freeze up data. Alaska–Pacific River Forecast Center, National Weather Service, accessed 4 April 2017, https://www.weather.gov/aprfc/freezeUp
Brown, D.R.N., T.J. Brinkman, D.L. Verbyla, C.L. Brown, H.S. Cold, and T.N. Hollingsworth. 2018. Changing River Ice Seasonality and Impacts on Interior Alaskan Communities. Journal of the American Meteorological Society, https://doi.org/10.1175/WCAS-D-17-0101.1