Documentation Revision Date: 2019-07-19
Dataset Version: 1
Summary
This dataset contain raw reflectance spectra for various tundra vegetation plots and species leaves and has not been analyzed or processed to quantify uncertainty. Measurements are being collected during the 2019 growing season and will be added to this dataset.
There are four data files provided with this dataset, two for each year, including a spectral library file with full-spectrum (350-2500 nm) reflectance observations and a metadata file with corresponding sample characteristics. Companion files include readme *.txt files for most measurement sites with general site descriptions and measurement plot details and photo collections (*.jpg) of most measured plots, plants, and leaf samples.
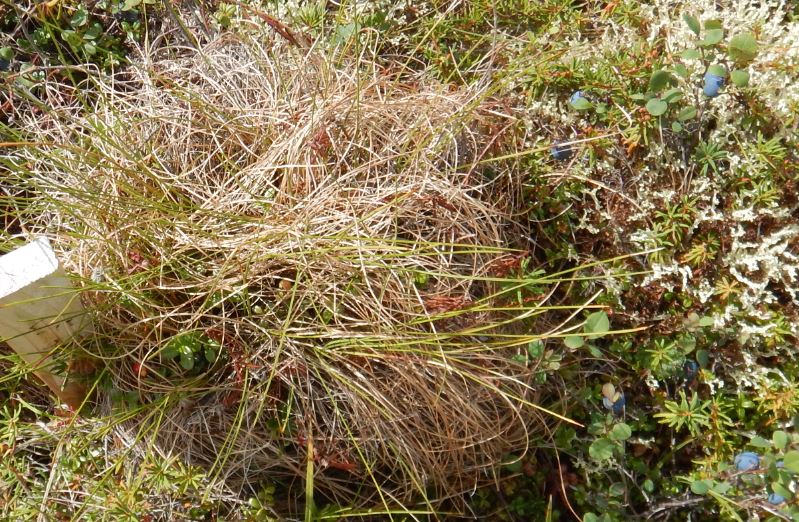
Figure 1. In situ measurement plot at a Common Garden Ecotype site near Eagle Creek, Alaska. Common garden sites (6 total) were established with different populations of the tussock-forming sedge, E. vaginatum, taken from different latitudes in Alaska. Source: EagleCreek_Ecot_170728_Images/DSCN5451.JPG
Citation
Zesati, S.V., C.E. Tweedie, K.F. Huemmrich, P.K. Campbell, and M. Velez-Reyes. 2019. ABoVE: Reflectance Spectra of Tundra Plant Communities across Northern Alaska. ORNL DAAC, Oak Ridge, Tennessee, USA. https://doi.org/10.3334/ORNLDAAC/1685
Table of Contents
- Dataset Overview
- Data Characteristics
- Application and Derivation
- Quality Assessment
- Data Acquisition, Materials, and Methods
- Data Access
- References
Dataset Overview
This dataset reports full-spectrum (350-2500 nm) reflectance measurements of diverse plant communities at the plot-level and individual plant species at the leaf-level, at multiple sites across northern Alaska during the 2017 and 2018 summer field seasons. Plot-level reflectance data (1 m2) include an assemblage of vascular and non-vascular species comprising tundra plant communities, while leaf-level scans are specific to one particular tundra species. Reflectance measurements were collected using a HR-1024i spectrometer and data were calibrated using a Spectralon white reference panel during sampling to correct for changing light conditions. Sampling methods and data and metadata structure follow that of the Ecological Spectral Information System (EcoSIS) Spectral Library. This dataset contain raw reflectance spectra for various tundra vegetation plots and species leaves and has not been analyzed or processed to quantify uncertainty.
Project: Arctic-Boreal Vulnerability Experiment
The Arctic-Boreal Vulnerability Experiment (ABoVE) is a NASA Terrestrial Ecology Program field campaign based in Alaska and western Canada between 2016 and 2021. Research for ABoVE links field-based, process-level studies with geospatial data products derived from airborne and satellite sensors, providing a foundation for improving the analysis and modeling capabilities needed to understand and predict ecosystem responses and societal implications.
Acknowledgements:
NASA ABoVE Grant NNX17AC58A and Research Opportunities in Space and Earth Sciences Program, Grant NNX13AK85A.
Data Characteristics
There are four data files provided with this dataset, two for each year, including a spectral library file with full-spectrum (350-2500 nm) reflectance observations and a metadata file with corresponding sample characteristics. Companion files include readme *.txt files for most measurement sites with general site descriptions and measurement plot details and photo collections (*.jpg) of most measured plots, plants, and leaf samples.
Spatial Coverage: Northern Alaska
ABoVE Reference Locations:
Domain: Core ABoVE
ABoVE Grid cells: Ch051v019, Ch049v007, Ch050v007, Ch046v008, Ch048v020, Ch048v021, Ch044v023, Ch044v033
Spatial resolution: Multiple points
Temporal coverage: 2017-07-18 to 2018-08-14
Temporal resolution: one or more measurements during a growing season at each plot
Study Areas (All latitude and longitude given in decimal degrees)
| Site | Westernmost Longitude | Easternmost Longitude | Northernmost Latitude | Southernmost Latitude |
|---|---|---|---|---|
| Northern Alaska | -157.412046 | -145.51512 | 71.34615 | 65.43485 |
Data File Information
There are four data files provided with this dataset, two for each year, including a spectral library file with full-spectrum (350-2500 nm) reflectance observations and a metadata file with corresponding sample characteristics. Companion files include readme *.txt files for most measurement sites with general site descriptions and measurement plot details and photo collections (*.jpg) of most measured plots, plants, and leaf samples.
Table 1. Data and companion file names and descriptions..
| File names | Description | Notes |
|---|---|---|
| sel_2017_spectral_library_svc_data.csv | Full-spectrum (350-2500 nm) reflectance measurements of plant communities, plants, and leaves collected in 2017. | Data file structure and content follow that of Ecological Spectral Information System (EcoSIS) Spectral Library. (https://ecosis.org/) |
| sel_2018_spectral_library_svc_data.csv | Same as above, but data collected in 2018. | |
| sel_2017_spectral_library_svc_metadata.csv | Metadata file with corresponding sample characteristics for 2017 measurements. Unique row identifier aligns “row for row” with measurement file. | Metadata file structure and content follow that of Ecological Spectral Information System (EcoSIS) Spectral Library. (https://ecosis.org/) |
| sel_2018_spectral_library_svc_metadata.csv | Same as above, but data collected in 2018. | |
| Companion Files | ||
| Site and Measurement Readme Files (readme_*.txt) 28 Readme files | General site descriptions and measurement plot details. | See Table 2 for location and site crosswalk to Readme files. |
| Image Files (*.zip) 24 compressed files | Collections of images of plots, plants, and leaf samples. Note that individual image files (*.jpg) are not always named by plot. Nevertheless, the order of the plot images in a collection, matches the order of the plot measurements in the data/metadata files. | See Table 2 for location and site crosswalk to image files. |
Table 2. 2017 and 2018 locations and measurement sites paired with respective Readme files and Collections of site, plant, and leaf images.
| location | 2017 site_name | Site and Measurement (readme_*.txt) | Image Files (*.zip) | Count 2017 | 2018 site_name | Count 2018 |
|---|---|---|---|---|---|---|
| Atqasuk | CALM- Circumpolar Active Layer Monitoring | Atqasuk_CALM_Spectral_Data_Metadata | Atqasuk_CALM_All_Dates_Images | 30 | same | 64 |
| Atqasuk | LEAF - Plant Leaf Spectra | Atqasuk_LEAF_Spectral_Data | Atqasuk_Leaf_170805_Images | 95 | ||
| Atqasuk | MISP- Mobile Instrumented Sensor Platform | Atqasuk_MISP_Spectral_Data | Atqasuk_MISP_All_Dates_Images | 100 | same | 50 |
| Atqasuk | PLANT - Plant Spectra: Opportunistic Samples | 20 | ||||
| Barrow (Utqiagvik) | BEO- Barrow Environmental Observatory Biocomplexity | Utqiagvik_BEO_Spectral_Data_Metadata | Utqiagvik_BEO_170809_Images | 59 | ||
| Barrow | BMBV - Barrow Mounds Bowerville | Utqiagvik_Mounds_Site_Spectral_Data_ Metadata | Utqiagvik_BMBV_170816_Images | 49 | ||
| Barrow | BMDC - Barrow Mounds Duck Camp | Utqiagvik_Mounds_Site_Spectral_Data_ Metadata | Utqiagvik_BMDC_170816_Images | 53 | ||
| Barrow | CALM- Circumpolar Active Layer Monitoring | Utqiagvik_CALM_Spectral_Data_Metadata | Utqiagvik_CALM_All_Dates_Images | 30 | same | 115 |
| Barrow | COAST - Chukchi Coast Spectroscopy | Utqiagvik_Chukchi_Coast_Spectral_Data_ Metadata | Utqiagvik_Chukchi_Coast_170818_ Images | 33 | same | 38 |
| Barrow | COAST - Elson Coast Spectroscopy | Utqiagvik_Elson_Coast_170819_Images | 76 | |||
| Barrow | DEM- Digital Elevation Model Site | Utqiagvik_DEM_Site_Spectral_Data_Metadata | Utqiagvik_DEM_170814_Images | 28 | ||
| Barrow | ITEX - International Tundra Experiment (Dry) | Utqiagvik_ITEX_Spectral_Data_Metadata | 31 | |||
| Barrow | ITEX - (Dry): Site 1 subdivision | 24 | ||||
| Barrow | ITEX - (Dry): Site 3 subdivision | 180 | ||||
| Barrow | ITEX - International Tundra Experiment (Wet) | Utqiagvik_ITEX_Spectral_Data_Metadata | 48 | same | 156 | |
| Barrow | LEAF - Plant Leaf Spectra | Utqiagvik_LEAF_Spectral_Data_Metadata | Utqiagvik_Leaf_170807_Images | 85 | ||
| Barrow | MetTower - D | Utqiagvik_MetStationD_Spectral_Data_ Metadata | Utqiagvik_Met_Tower_170813_Images | 25 | ||
| Barrow | MICRO - Microtopo Grid (Row A) | Utqiagvik_Microtopo_Historical_Site_Spectral_ Data_Metadata | 68 | |||
| Barrow | MICRO - Microtopo Grid (Row B) | Utqiagvik_Microtopo_Historical_Site_Spectral_ Data_Metadata | 68 | |||
| Barrow | MISP- Mobile Instrumented Sensor Platform | Utqiagvik_MISP_Spectral_Data_Metadata | Utqiagvik_MISP_All_Dates_Images | 90 | same | 250 |
| Barrow | MISP- Mobile Instrumented Sensor Platform (Diurnal Run) | Utqiagvik_MISP_Spectral_Data_Metadata | 546 | |||
| Barrow | OSLEAF - Oil Spill Plant Leaf Spectra | Utqiagvik_OSLEAF_Spectral_Data_Metadata | Utqiagvik_OSLEAF_170815_Images | 118 | ||
| Barrow | OSR - Oil Spill Runway | Utqiagvik_OSRW_Spectral_Data_Metadata | Utqiagvik_OSRW_170814_Images | 7 | ||
| Barrow | PLANT - Plant Spectra | Utqiagvik_Pfrigidus_Spectral_Data_Metadata | Utqiagvik_PetFri_170810_Images | 17 | ||
| Barrow | Drain Ponds Site: Opportunistic Samples | 61 | ||||
| Barrow | Pond Margins Site: Opportunistic Samples | 44 | ||||
| Coldfoot | Ecotype | Coldfoot_Ecotype_Spectral_Data_Metadata | Coldfoot_Ecot_170727_Images | 85 | ||
| Eagle Creek | Ecotype | EagleCreek_Ecotype_Spectral_Data_Metadata | EagleCreek_Ecot_170728_Images | 18 | ||
| Eagle Creek | LEAF - Plant Leaf Spectra | EagleCreek_LEAF_Spectral_Data_Metadata (*) | EagleCreek_Leaf_170729_Images | 90 | ||
| Imnavit | MISP- Mobile Instrumented Sensor Platform | Imnavait_MISP_Spectral_Data_Metadata | 46 | |||
| Imnavait | CALM- Circumpolar Active Layer Monitoring | 64 | ||||
| No Name Creek | LEAF - Plant Leaf Spectra | NoNameCreek_LEAF_Spectral_Data_Metadata (*) | NoName_Creek_Leaf_170731_Images | 26 | ||
| Sagwon | Ecotype | Sagwon_Ecotype_Spectral_Data_Metadata | Sagwon_Ecotype_170725_Images | 133 | ||
| Sagwon | LEAF - Plant Leaf Spectra | Sagwon_LEAF_Spectral_Data_Metadata | Sagwon_Leaf_170725_Images | 30 | ||
| Toolik | Ecotype | Toolik_Ecotype_Spectral_Data_Metadata | Toolik_Ecotype_170726_Images | 17 | ||
| Toolik | LEAF - Plant Leaf Spectra | readme_Toolik_LEAF_Spectral_Data_Metadata | Toolik_Leaf_170724_Images | 82 | ||
| Toolik | MISP- Mobile Instrumented Sensor Platform | Toolik_MISP_Spectral_Data_Metadata | 45 | |||
| Toolik | CALM- Circumpolar Active Layer Monitoring | 64 |
(*) Includes general site coordinates.
Data Dictionary for files sel_2017_spectral_library_svc_data.csv (2,258 observations) and sel_2018_spectral_library_svc_data.csv (1,130 observations).
| Column number | Column name | Units/format | Description |
|---|---|---|---|
| 1 | unique_id | Unique row identifier that is the concatenation of location_site_plot_type_date_time_measurement for this observation. There is a matching row of metadata in the corresponding *.metadata.csv file. | |
| 2 - 995 | wavelengths, 338.1 - 2516.3 | nm | Each column contains the reflectance values for the respective wavelength that is the column name. There are 994 columns with intervals between columns ranging from 1.5 - 3.9 nm. |
Data Dictionary for files sel_2017_spectral_library_svc_metadata.csv (2,258 observations) and sel_2018_spectral_library_svc_metadata.csv (1,130 observations).
| Column name | Units/format | Description |
|---|---|---|
| location_site_plot_type_date_time_measurement | Unique row identifier that is the concatenation of location_site_plot_type_date_time_measurement for this observation. There is a matching row of reflectance data in the corresponding *_spectral_library_svc_data.csv file. | |
| location | Location Name | |
| site_name | Site Name | |
| target_name | Target Name | |
| target_scale_level | Target Scale Level. PL=plot, LF=leaf, MD=??? | |
| measurement_date | yyyy-mm-dd | Measurement Date |
| measurement_time_of_day_(utc) | Hh:mm:ss | Measurement Time |
| measurement_type | Measurement Quantity. Scale for spectral instensity (e.g. DN, radiance, irradiance, reflectance) | |
| proj_title | Project Title | |
| proj_funding_agency | Funding Source | |
| proj_award | Funding Source Grant Number | |
| proj_funding_country | Country | |
| proj_start_year | yyyy | Start Year |
| proj_end_year | yyyy | End Year |
| proj_initiative | Initiative | |
| proj_discipline | Theme. Research context for the spectral measurements. Agriculture, Biochemistry, Ecology, Forest, Global Change, Land Cover, Other, Phenology, Physiology, Water Quality | |
| proj_contact_name | Contact Name | |
| proj_contact_role | Contact role | |
| proj_contact_email | Contact Email | |
| proj_institution | Institution | |
| proj_page_link | Website | |
| proj_keywords | Keywords | |
| site_country | Site Country | |
| site_start_year | yyyy | Year |
| site_ecosystem_type | Ecosystem Type. Alpine, Antarctic, Aquatic, Arctic, Arctic Tundra, Coastal, Crops, Desert, Estuary, Forest, Freshwater, Grassland, Lake, Marine, Montane, Ocean, Pond, Rainforest, River, Savanna, Scrubland, Shrubland, Steppe, Tundra, Urban, Woodland | |
| latitude | Decimal degrees | Latitude |
| longitude | Decimal degrees | Longitude |
| measurement_method | Acquisition Method. Minimum measurement unit for your spectra (i.e. contact probe, proximal with X-degree foreoptic, pixel, other). | |
| sample_platform | Sample Platform. Platform from which the spectral measurements were made (e.g. handheld, boom, tram, UAV). | |
| measurement_venue | Measurement Venue. Setting in which the spectral measurements were made. Greenhouse, Laboratory, Other, Outdoor | |
| target_status | Target Status. State of the measurement target. Dried, Fresh, Green, Ground, Liquid, Live, Other, Panel, Standard | |
| wavelength_units | Wavelength Units. Wavelength units (e.g. nm, um, Hz) | |
| light_source | Light Source. Description of the light source used for your spectral measurements. Lamp, Laser, Other, Sun | |
| instrument_manufacturer | Instrument Manufacturer. Spectrometer manufacturer. | |
| instrument_model | Instrument Model. Spectrometer model. | |
| calibration | Calibration (Spectralon Ratio) | |
| data_type | Data Type (processed) | |
| processing_averaged | Y,N | Processing Averaged. Is the measurement an average of multiple measurements? |
| processing_interpolated | Y,N | Processing Interpolated. Is the measurement interpolated? |
| processing_resampled | Y,N | Processing Resampled. Is the measurement resampled? (e.g. are multiple wavelengths averaged?) |
| processing_software | Processing software |
Application and Derivation
The use of consistent sampling methods and data and metadata structures that follow Ecological Spectral Information System (EcoSIS) Spectral Library (https://ecosis.org/) standards ensures comparability of results across sites within this study and across all EcoSIS library data. Full-spectrum (350-2500 nm) reflectance measurements of plant communities at the leaf and plot scales enables integration with other remotely sensed spectral data for scaling up to watershed, regional, and global scale earth system models.
Quality Assessment
This dataset contain raw reflectance spectra for various tundra vegetation plots and species leaves and has not been analyzed or processed to quantify uncertainty.
Data Acquisition, Materials, and Methods
Sites
Full-spectrum (350-2500 nm) reflectance measurements of diverse plant communities at the plot-level and individual plant species at the leaf-level, were collected at multiple sites across northern Alaska during the 2017 and 2018 summer field seasons. General locations and specific sites are listed in Table 2. The latitude and longitude of each in situ measurement or collected leaf sample is include in the metadata files. The coordinates were acquired using either a DGPS or handheld GPS.
Measurements
In situ reflectance measurements were collected using a HR-1024i spectrometer and data were calibrated using a Spectralon white reference panel during sampling to correct for changing light conditions. Sampling methods and data and metadata structure follow that of Ecological Spectral Information System (EcoSIS) Spectral Library (https://ecosis.org/).
Leaf spectral reflectance scans were collected in a controlled lab setting using a HR-1024i spectrometer, leaf-clip and fibers. Data were calibrated using a Spectralon white reference panel included in the leaf clip. Samples were collected and scanned the same day during the 2017 summer growing season.
Readme Files
Readme files with general site descriptions and coordinates and measurement plot details or leaf scanning details were prepared for those data and samples collected at established sites. See Table 2.
Those sites and measurements that do not have readme files indicate that the measurements were either at new plots or were simply of interest to the project to collect and don’t necessarily pertain to any specific site. In many cases data were collected to expand the spectral library in an effort to capture as much vegetation diversity as possible.
Images
Photographs of plots, plants, and leaf samples were generally taken. See Table 2.
Please be aware that individual image files (*.jpg) are not always named by site – plot within the site collection. But also note, that the order of the in-situ measurement plot photos in a site collection, matches the order of the site - plot measurements in the metadata and data files.
Examples of Readme files:
Below are excerpts of content from selected Readme files and Related Photographs for typical measurement and sample types.
Leaf Clips: readme_Atqasuk_LEAF_Spectral_Data.txt
DATA OVERVIEW
This dataset represents full spectrum (i.e. 350 - 2500nm) leaf spectral reflectance data for species located in Atqasuk, Alaska. Scans were collected in a controlled lab setting using a HR-1024i spectrometer, leaf-clip and fibers. Samples were collected and scanned the same day during the 2017 summer growing season and acquired data were calibrated using a Spectralon white reference panel included in the leaf clip.
Site description:
Leaf samples were collected within a 50 meter squared area radius surrounding the Mobile Instrumented Sensor Platform (MISP) transect (2 x 50 meters). These transects were established at various locations throughout the Arctic
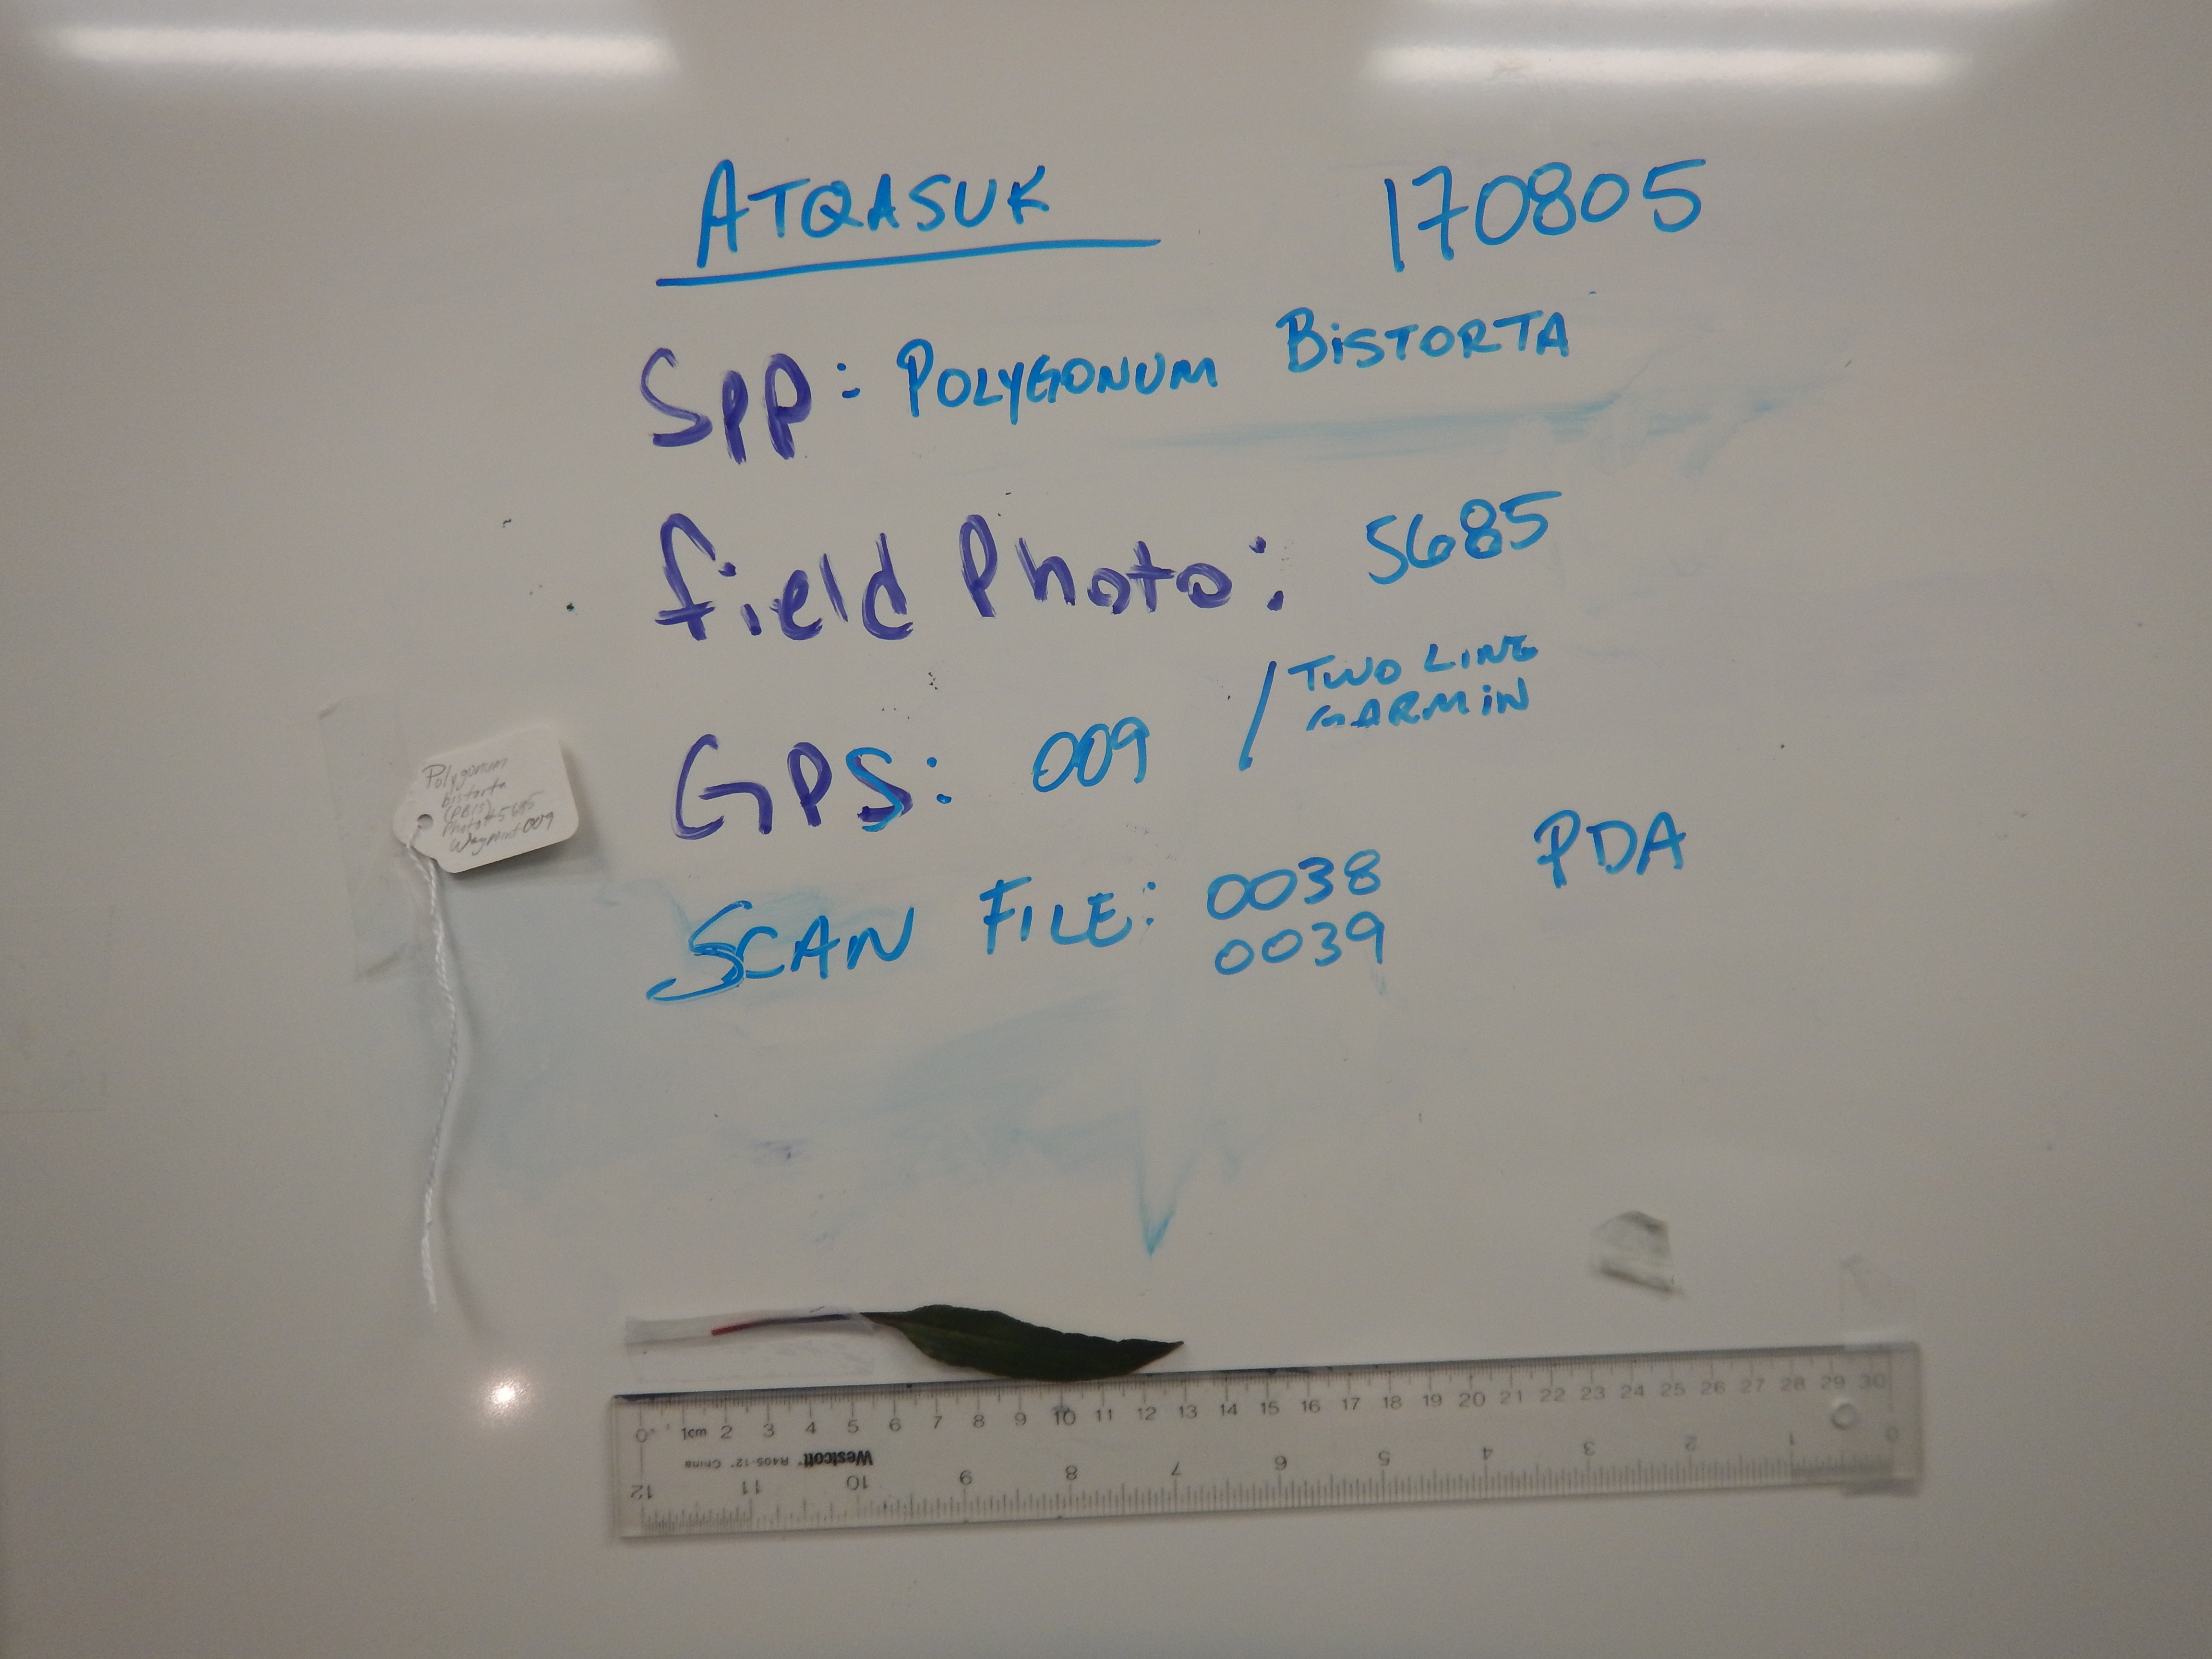
Figure 2. Display of leaf and sample measurement metadata..Source: Atqasuk_Leaf_170805_Images/DSCN5738.JPG
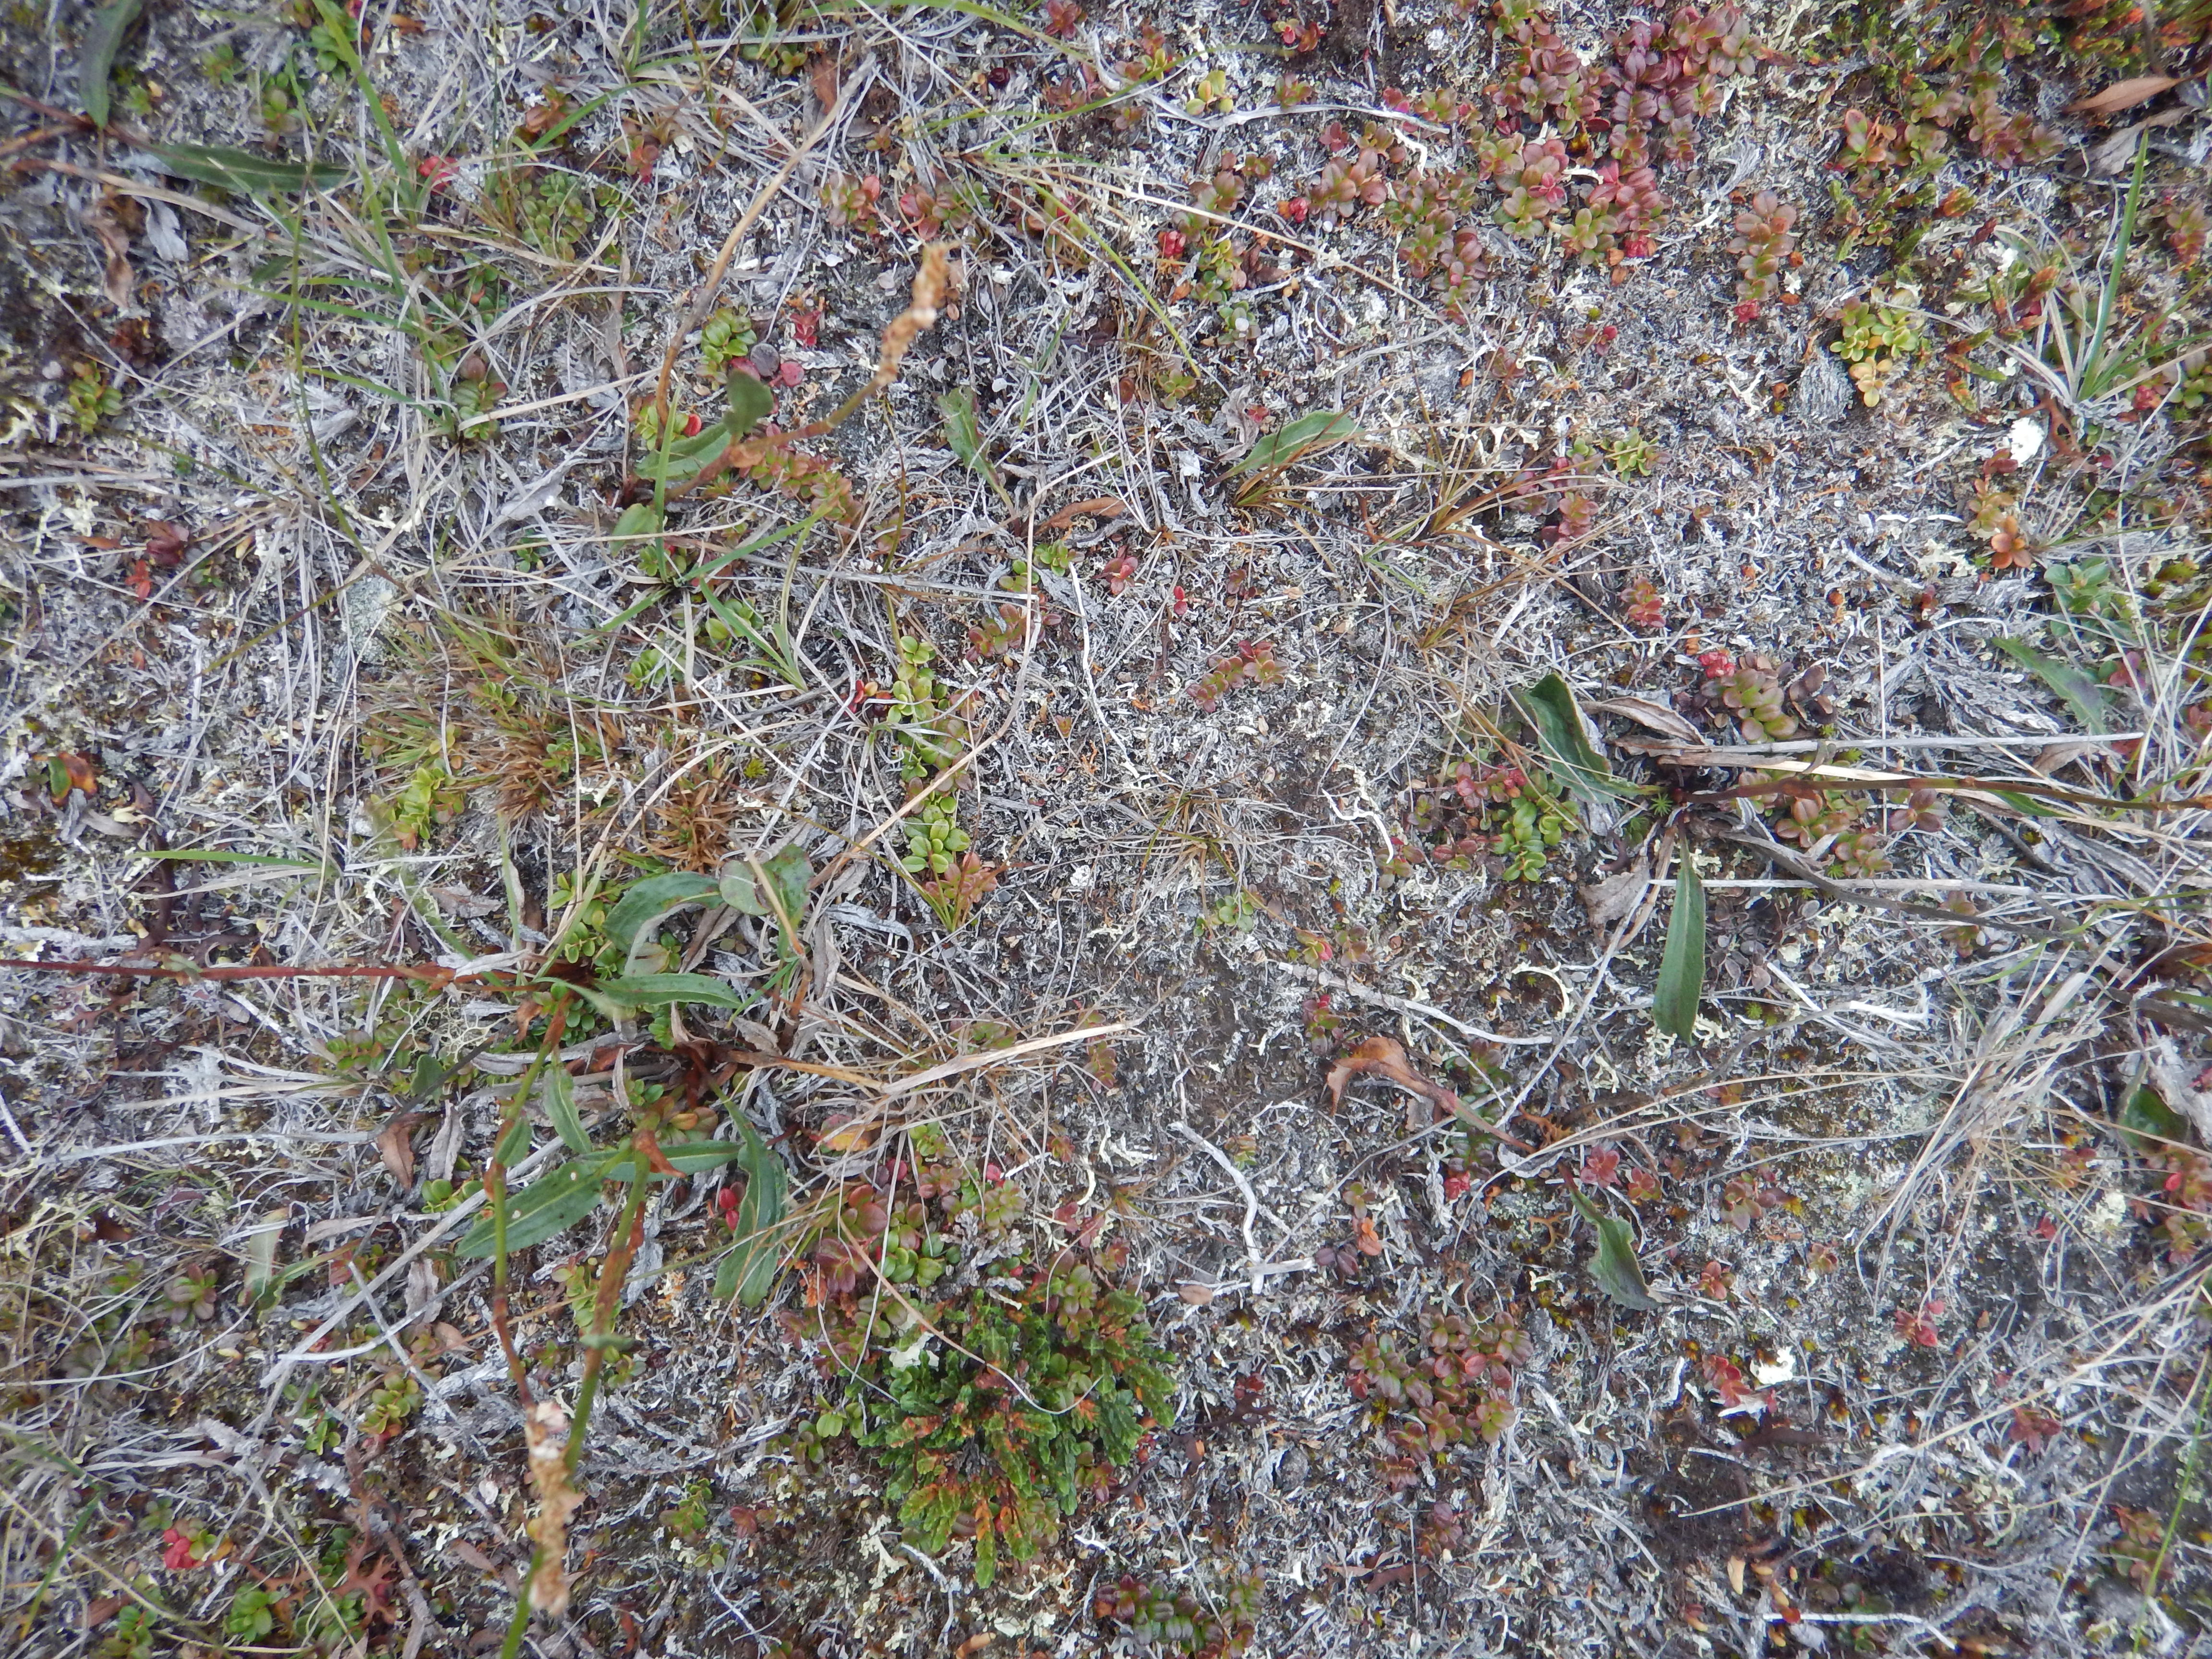
Figure 3. Field plot photo for source of leaf sample. Source: Atqasuk_Leaf_170805_Images /DSCN5685.JPG
In situ Plot Measurements: readme_Atqasuk_MISP_Spectral_Data.txt
DATA OVERVIEW
This dataset represents full-spectrum (i.e. 350-2500nm) plot-level spectral reflectance data along the Mobile Instrumented Sensor Platform (MISP) transect in Atqasuk, Alaska.
Site description:
Mobile Instrumented Sensor Platform (MISP) transects (2 x 50 meters) were established at various locations throughout the Arctic as a contribution to the US Arctic Observing Network (AON),(Healey, N.C., et al. 2014). Each 50 meter transect was divided into smaller 1 x 2 meter plots and marked with white wooden boards secured to the tundra with 12” metal stakes. The robotic sensor systems collect high spatial and temporal resolution environmental data across a multitude of vegetation functional types and spanning a moisture and latitudinal gradient across the Arctic.
Spatial resolution: spectral reflectance point samples for an approximate 1 meter squared area.
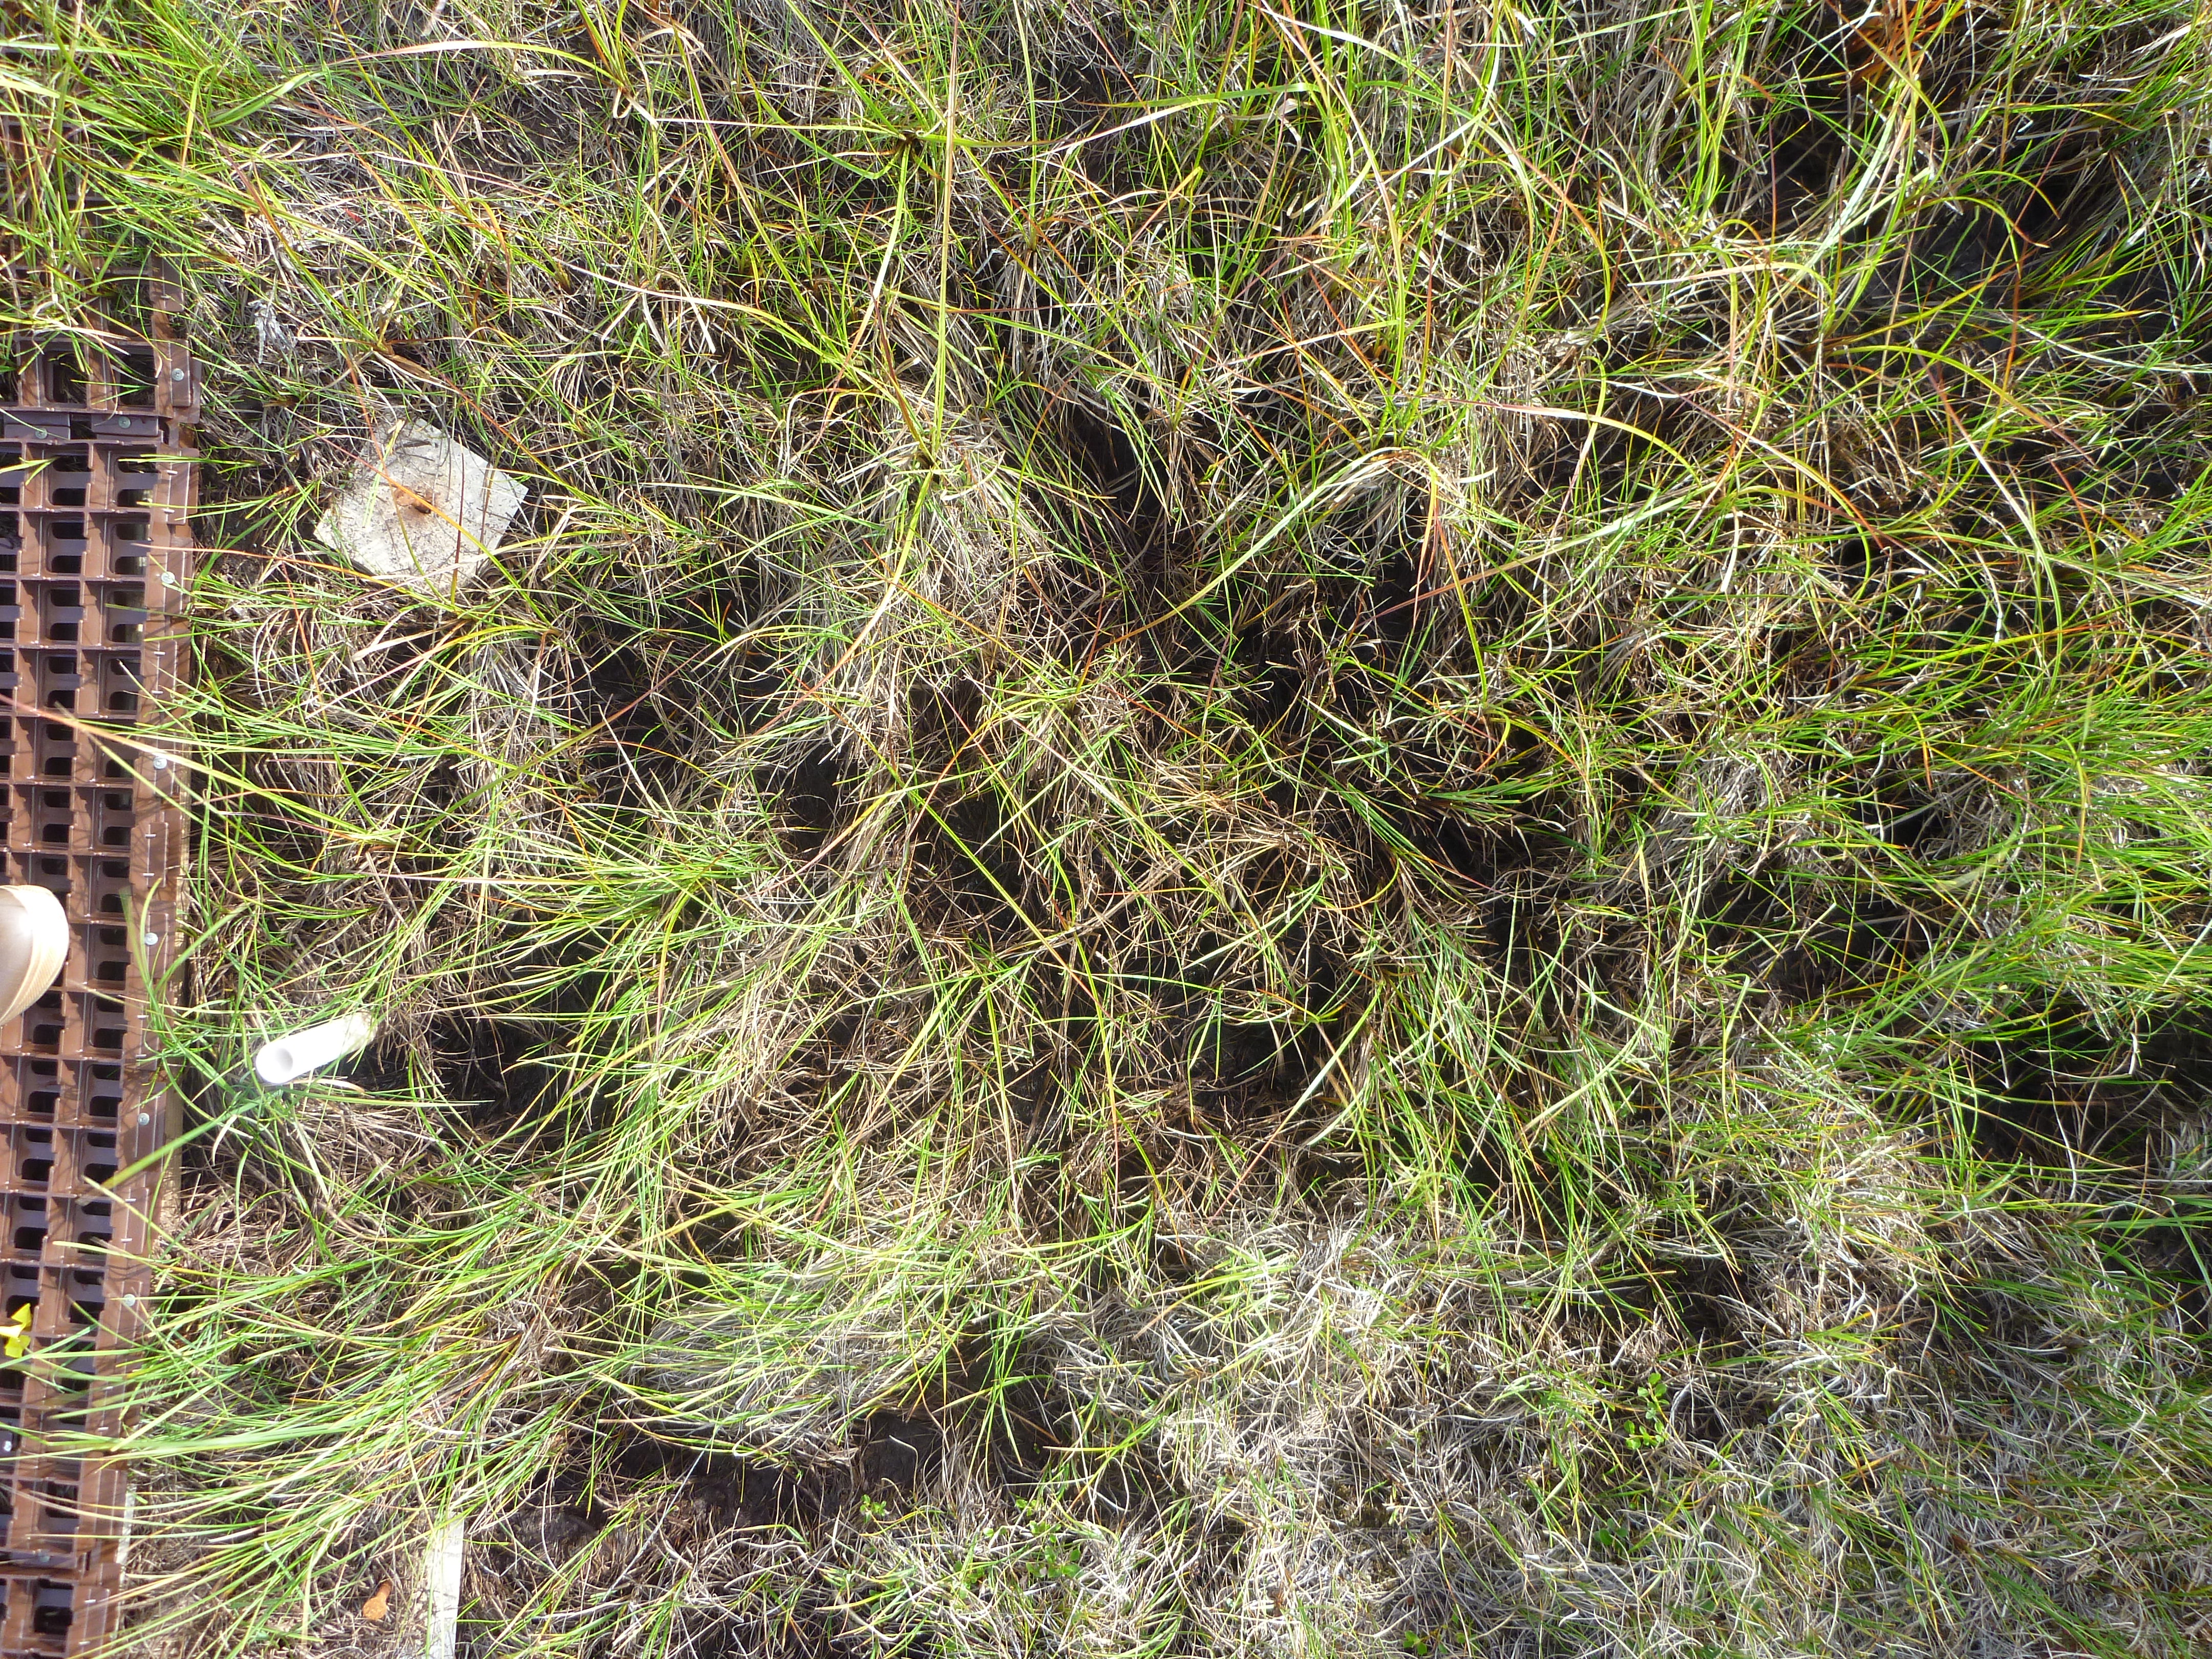
Figure 4. Typical in situ measurement plot photo. Area is approximately 1 m2. Source: Atqasuk_MISP_All_Dates_Images/O_3-4.JPG
In situ Plant Measurements: readme_Utqiagvik_Pfrigidus_Spectral_Data_Metadata.txt
DATA OVERVIEW
This dataset represents full-spectrum (i.e. 350-2500nm) plot-level spectral reflectance data of Petasites frigidus growing near the Mobile Instrumented Sensor Platform (MISP) transect in Utqiagvik, Alaska.
Site description:
Mobile Instrumented Sensor Platform (MISP) transects (2 x 50 meters) were established at various locations
Spatial resolution: average spectral reflectance for an approximate 1 meter squared area.
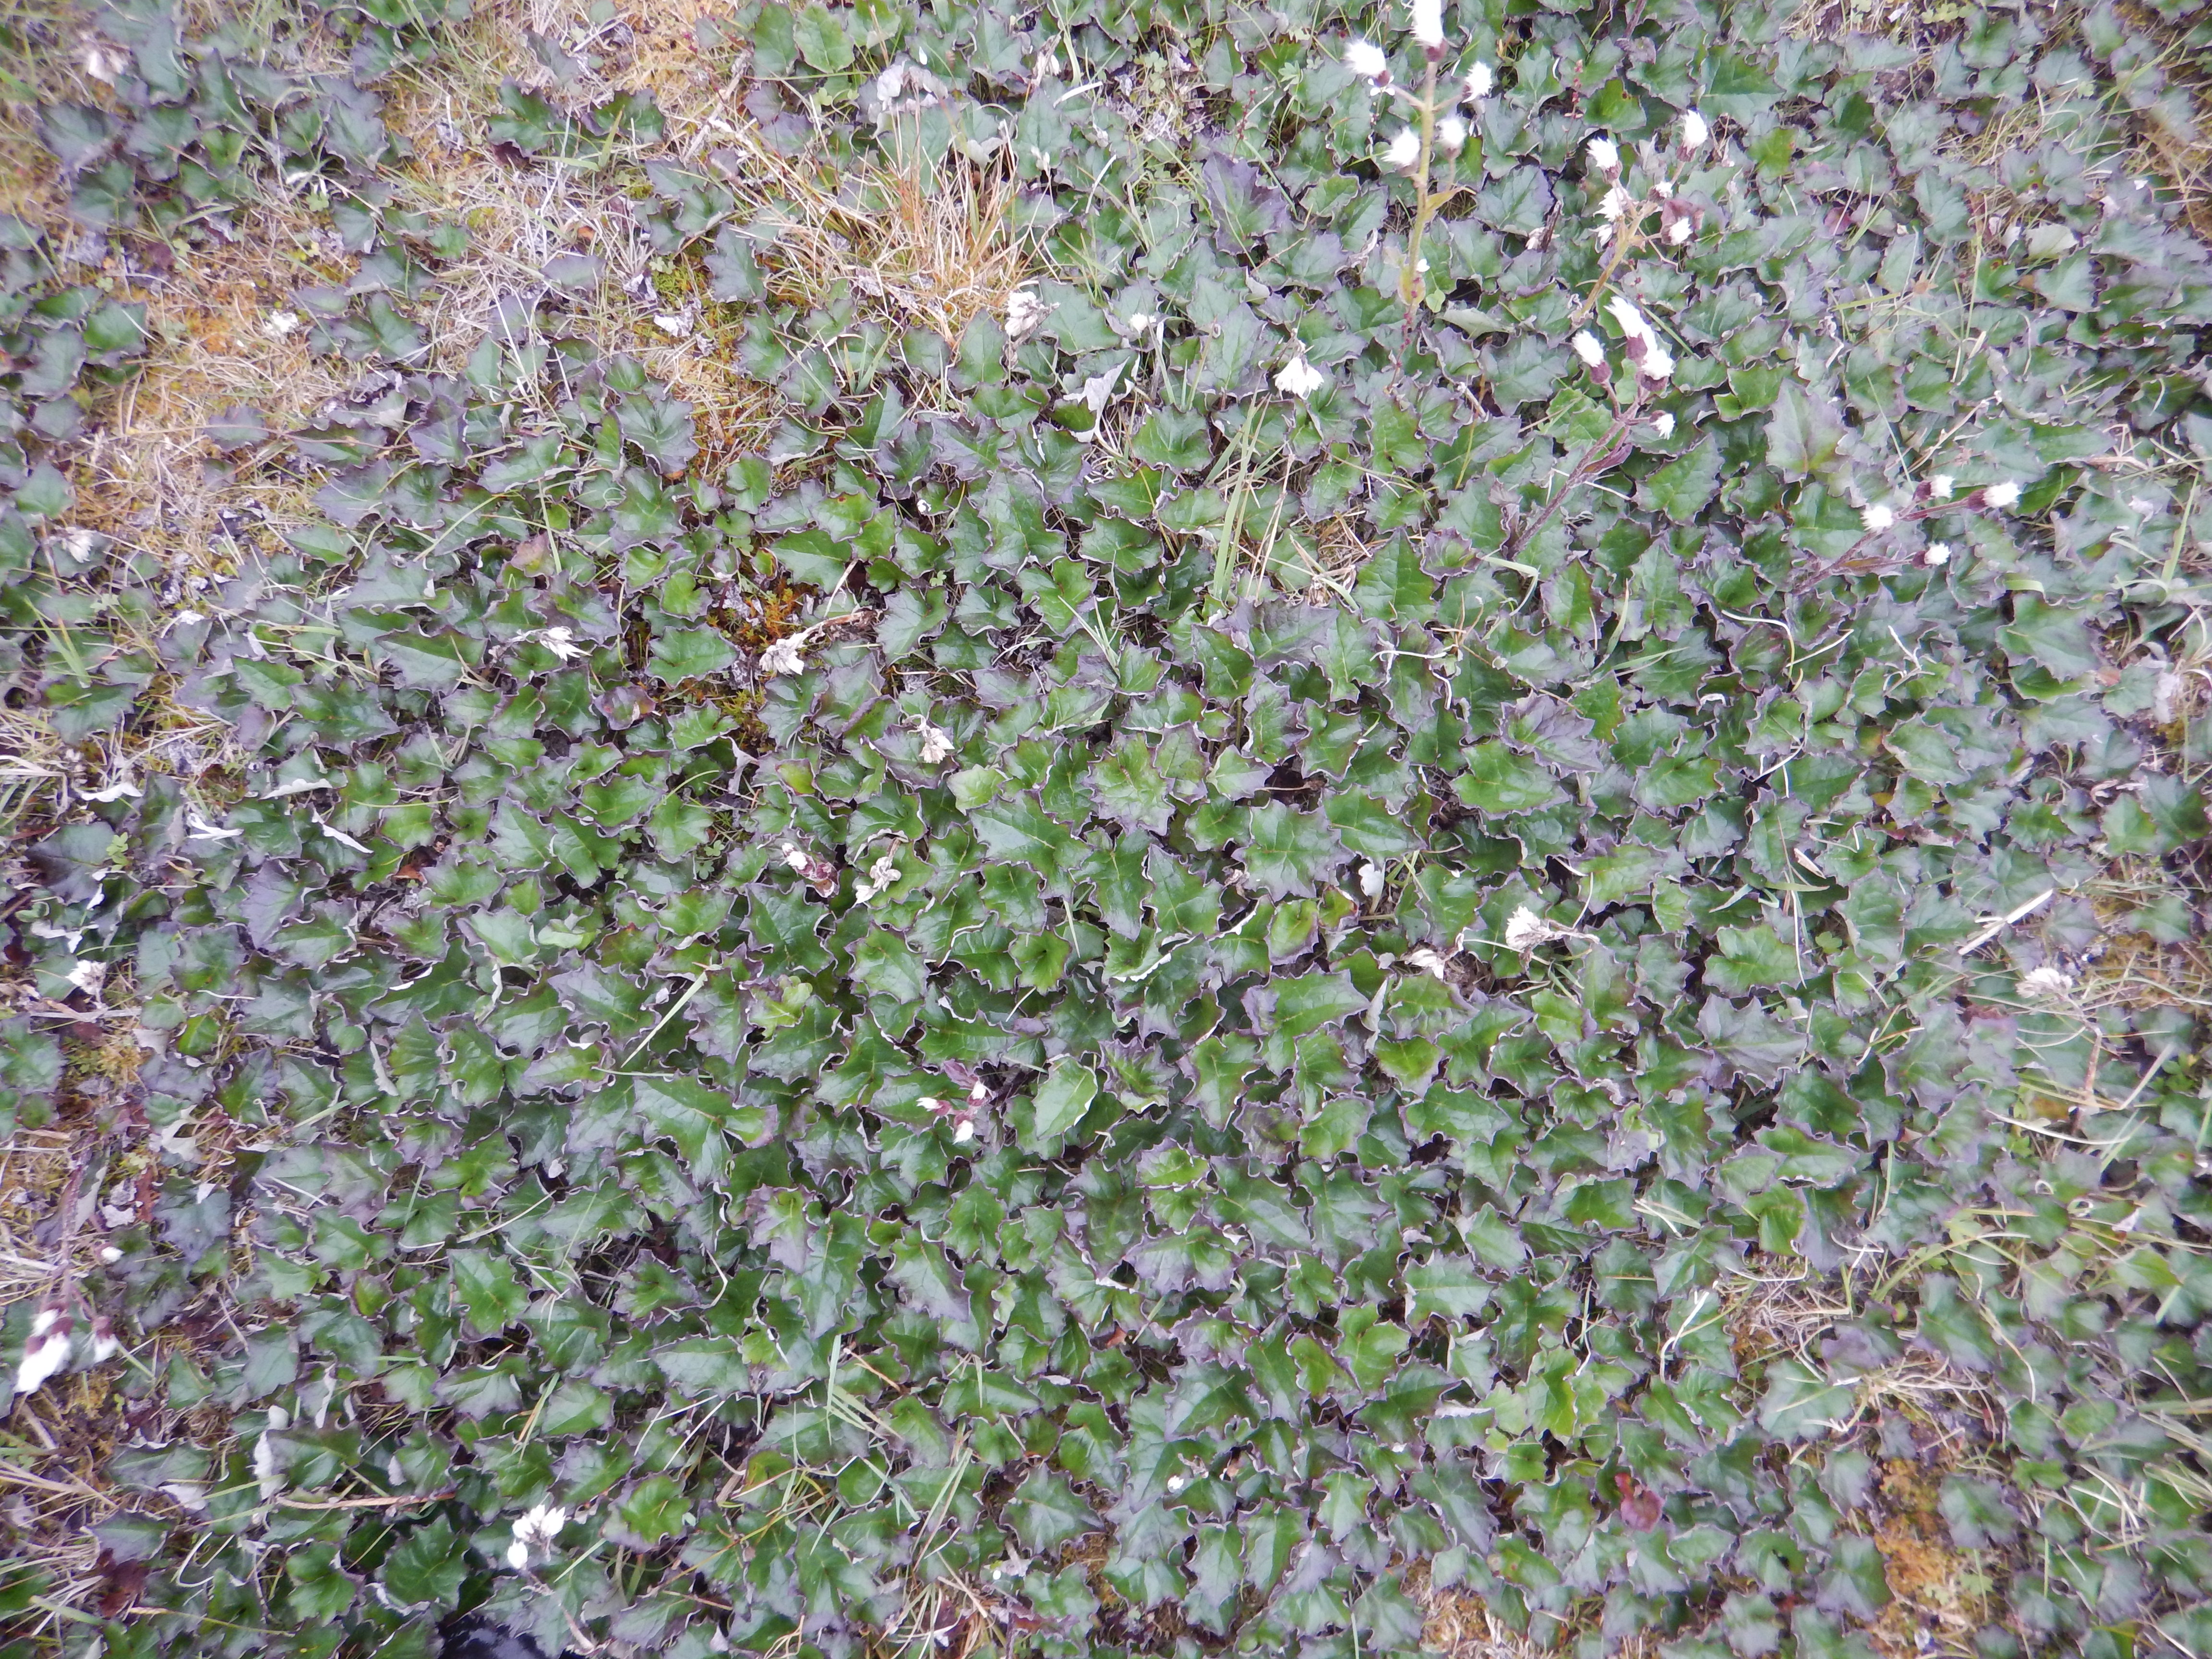
Figure 5. Photo of in situ measurement plot with predominately Petasites frigidus. Area is approximately 1 m2. Source: Utqiagvik_PetFri_170810_Images/DSCN6002.JPG
Data Access
These data are available through the Oak Ridge National Laboratory (ORNL) Distributed Active Archive Center (DAAC).
ABoVE: Reflectance Spectra of Tundra Plant Communities across Northern Alaska
Contact for Data Center Access Information:
- E-mail: uso@daac.ornl.gov
- Telephone: +1 (865) 241-3952
References
Ecological Spectral Information System (EcoSIS) Spectral Library. (https://ecosis.org/)