Documentation Revision Date: 2015-09-25
Data Set Version: V1
Summary
The GPR-derived ALT data and probe data are presented in three *.csv files. The raw GPR instrument readings are also provided as a companion file (*.zip).

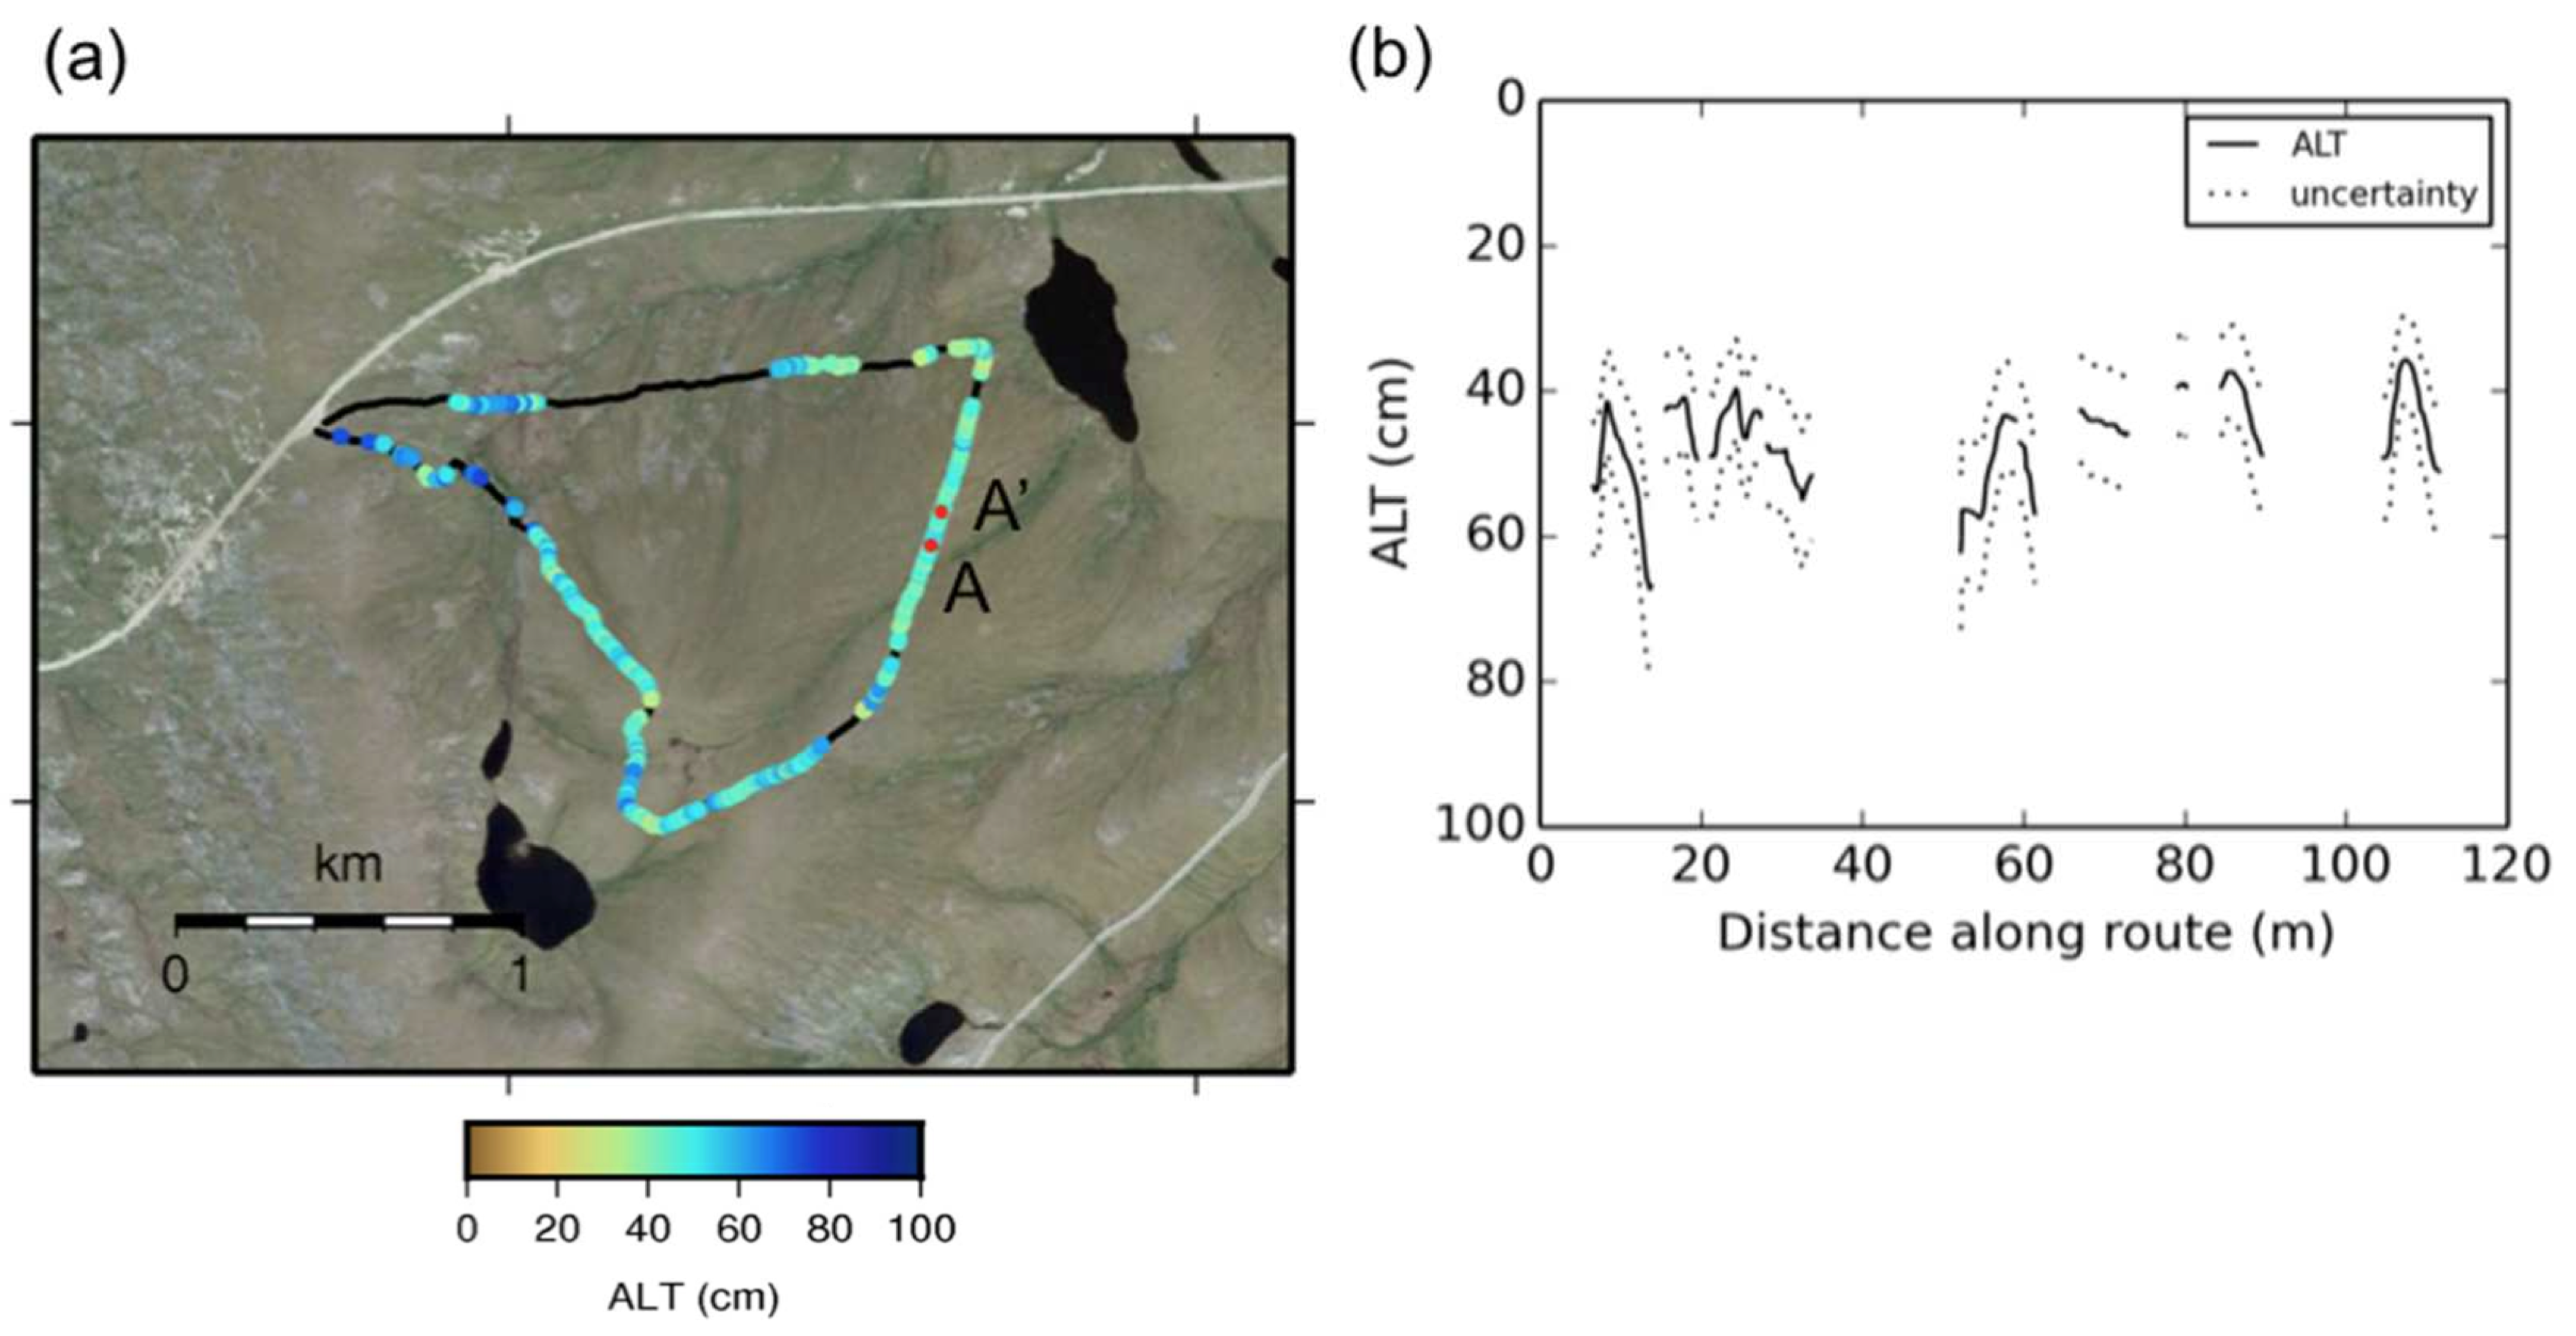
Figure 1. ALT derived from GPR data for the Basin Turnout route (a) and (b) detail of ALT from point A to A' (from Fig. 5 in Chen et al., 2015).
Citation
Chen, A., A. Parsekian, K. Schaefer, E. Jafarov, S.K. Panda, L. Liu, T. Zhang, and H.A. Zebker. 2015. Pre-ABoVE: Ground-penetrating Radar Measurements of ALT on the Alaska North Slope. ORNL DAAC, Oak Ridge, Tennessee, USA. http://dx.doi.org/10.3334/ORNLDAAC/1265.
Table of Contents
- Data Set Overview
- Data Characteristics
- Application and Derivation
- Quality Assessment
- Acquisition Materials and Methods
- Data Access
- References
Data Set Overview
Project: Arctic-Boreal Vulnerability Experiment (ABoVE)
Investigators: Chen, A., A. Parsekian, K. Schaefer, E. Jafarov, S.K. Panda, L. Liu, T. Zhang, and H.A. Zebker.
Permafrost active layer thickness (ALT) is an important parameter for studying surface energy balance, ecosystems, and hydrological processes in cold regions. This data set includes estimates of ALT (cm), and calculated uncertainties, derived using a ground-penetrating radar (GPR) system in the field in August 2014 near Toolik Lake and Happy Valley on the North Slope of Alaska. GPR measurements were taken along 10 transects of varying length (approx. 1 to 7 km). Traditional ALT estimates from mechanical probing every 100 to 500 m along each transect are also included. The average GPR-derived ALT was 48.1 cm, with a standard deviation of 16.1 cm, and the results show statistics similar to nearby long-term in-situ ALT measurements from the Circumpolar Active Layer Monitoring (CALM) network. These data are suitable for future studies of how ALT varies over relatively large geological features, such as hills and valleys, wetland areas, and drained lake basins.
The Arctic-Boreal Vulnerability Experiment (ABoVE) is a NASA Terrestrial Ecology Program field campaign that will take place in Alaska and western Canada between 2016 and 2021. Climate change in the Arctic and Boreal region is unfolding faster than anywhere else on Earth. ABoVE seeks a better understanding of the vulnerability and resilience of ecosystems and society to this changing environment.
Related Data Sets:
Pre-ABoVE: Remotely Sensed Active Layer Thickness, Barrow, Alaska, 2006-2011
Pre-ABoVE: Remotely Sensed Active Layer Thickness, Prudhoe Bay, Alaska, 1992-2000
Data Characteristics
Spatial Coverage
Data were collected at Toolik Lake and Happy Valley sites in the North Slope of Alaska, USA.
Spatial Resolution
Continuous GPR measurements and probe values every 100 to 500 m along transects of approx. 1 to 7 km length.
Temporal Coverage
2014-08-10 to 2014-08-15
Temporal Resolution
One measurement of each transect.
Study Area: (all latitudes and longitudes given in decimal degrees)
|
Site |
Westernmost Longitude |
Easternmost Longitude |
Northernmost Latitude |
Southernmost Latitude |
|
North Slope, Alaska, USA |
-149.50 |
-148.70 |
69.15 |
68.40 |
Data File Information:
Data are presented in three comma-delimited text files (*.csv). Cells with no data (fill value or missing values) are represented by “-9999”.
Two companion files are provided: a compressed (*.zip) directory containing raw GPR instrument readings from the study, and a document (.pdf) describing this raw GPR data.
File Information
|
FILE NAME |
FILE TYPE |
DESCRIPTION |
|
lvl1_gpr_alt.csv |
comma-delimited text |
Provides the coordinates along the 10 GPR transects, calculated GPR ALT at each point, and the corresponding uncertainty. Missing data represented by ‘-9999’. |
|
probe_data.csv |
comma-delimited text |
Provides ALT measured with a mechanical probe at points along the 10 GPR transect tracks. Also includes notes on vegetation at each point. Missing data represented by ‘-9999’. |
|
prb_gpr_alt.csv |
comma-delimited text |
Data from two high-resolution, collocated GPR and probing surveys. Data include: measured ALT probe data, two-way travel time from GPR, estimated velocities, covariance coefficient for velocity, calculated ALT from GPR and calculated volumetric water content based on velocities derived from GPR and corresponding uncertainties. |
Data fields in ‘lvl1_gpr_alt.csv’
|
Column |
Units |
Description |
|
Site |
|
Name of the transect site. |
|
lat_gpr |
decimal degrees
|
North latitude recorded by the GPS mounted on the GPR unit in a geographic projection with a WGS-84 datum. |
|
long_gpr |
decimal degrees |
West longitude recorded by the GPS mounted on the GPR unit in a geographic projection with a WGS-84 datum. |
|
alt_gpr |
cm |
Active layer thickness (ALT), calculated from GPR 2 wave travel time. |
|
unc_alt_gpr |
cm |
The corresponding uncertainty in calculated ALT |
Data fields in ‘probe_data.csv’
|
Column |
Units |
Description |
|
Site |
|
Name of the transect site. Note that probe data was collected at five additional sites that do not appear in ‘lvl1_gpr_alt.csv’. |
|
Date |
YYYY-MM-DD |
Date of measurement |
|
Num |
|
Sample number along GPR Run |
|
ALT1 |
cm |
Active layer thickness, sample 1. Value of ‘-1111’ indicates a point where the active layer was more than 100 cm thick but no accurate thickness measurement was possible. |
|
ALT2 |
cm |
Active layer thickness, sample 2 |
|
ALT3 |
cm |
Active layer thickness, sample 3 |
|
ALT Ave |
cm |
Average ALT based on an average of ALT1, ALT2, and ALT3 |
|
lat |
decimal degrees |
North latitude recorded by the GPS mounted on the GPR unit in a geographic projections with a WGS-84 datum. |
|
long |
decimal degrees |
West longitude recorded by the GPS mounted on the GPR unit in a geographic projections with a WGS-84 datum. |
|
Time |
seconds |
Trace time from GPR |
|
File |
|
File name of the corresponding “RAW_GPR_Data” data file. |
|
Comments |
|
General notes (field may be blank if no notes). |
|
Vegetation |
|
Vegetation types and other notes. This is auxiliary data and is not always recorded for each site (field may be left blank). |
Data fields in ‘prb_gpr_alt.csv’
|
Column |
Units |
Description |
|
Site |
|
Sites: BT_HD_1 - Basin Turnout high density survey 1 and MS_HD_1 - Mega Spot high density survey 1 |
|
alt_prb |
m |
Active Layer Thickness (ALT) from probe measurements |
|
unc_alt_prb |
m |
Corresponding uncertainties in measured probe ALTs |
|
owtt |
ns [nano seconds] |
One way travel time recorded from GPR. The wave reflected from the permafrost table. |
|
vel |
m/ns |
Velocity of the corresponding wave. |
|
unc_vel |
m/ns |
Corresponding uncertainties in calculated velocities |
|
cv |
|
Coefficient of variance |
|
alt_gpr |
m |
Active layer thickness (ALT) calculated from GPR 2 wave travel time |
|
unc_alt_gpr |
m |
Corresponding uncertainties in calculated ALTs |
|
vwc |
fraction of 1 |
Volumetric water content. ‘-8888’ indicates that the fraction of the vwc is > 0.9. |
|
unc_wvc |
fraction of 1 |
Corresponding uncertainties in calculated VWC |
Application and Derivation
This data is useful for comparing the accuracy of ground-penetrating radar (GPR) as a method of estimating permafrost active-layer thickness (ALT). In addition, the investigators used the data to examine patterns of ALT spatial variability at different sites and different spatial scales.
Quality Assessment
Uncertainty of the GPR-derived ALT was estimated by examining the statistics of the velocities estimated from the mechanical probing data. For 95% of results, the relative uncertainty was below 25%. Probe and GPR estimates of ALT were well correlated at the Galbraith site (r = 0.68). See Chen et al. (2015) for additional details.
Acquisition Materials and Methods
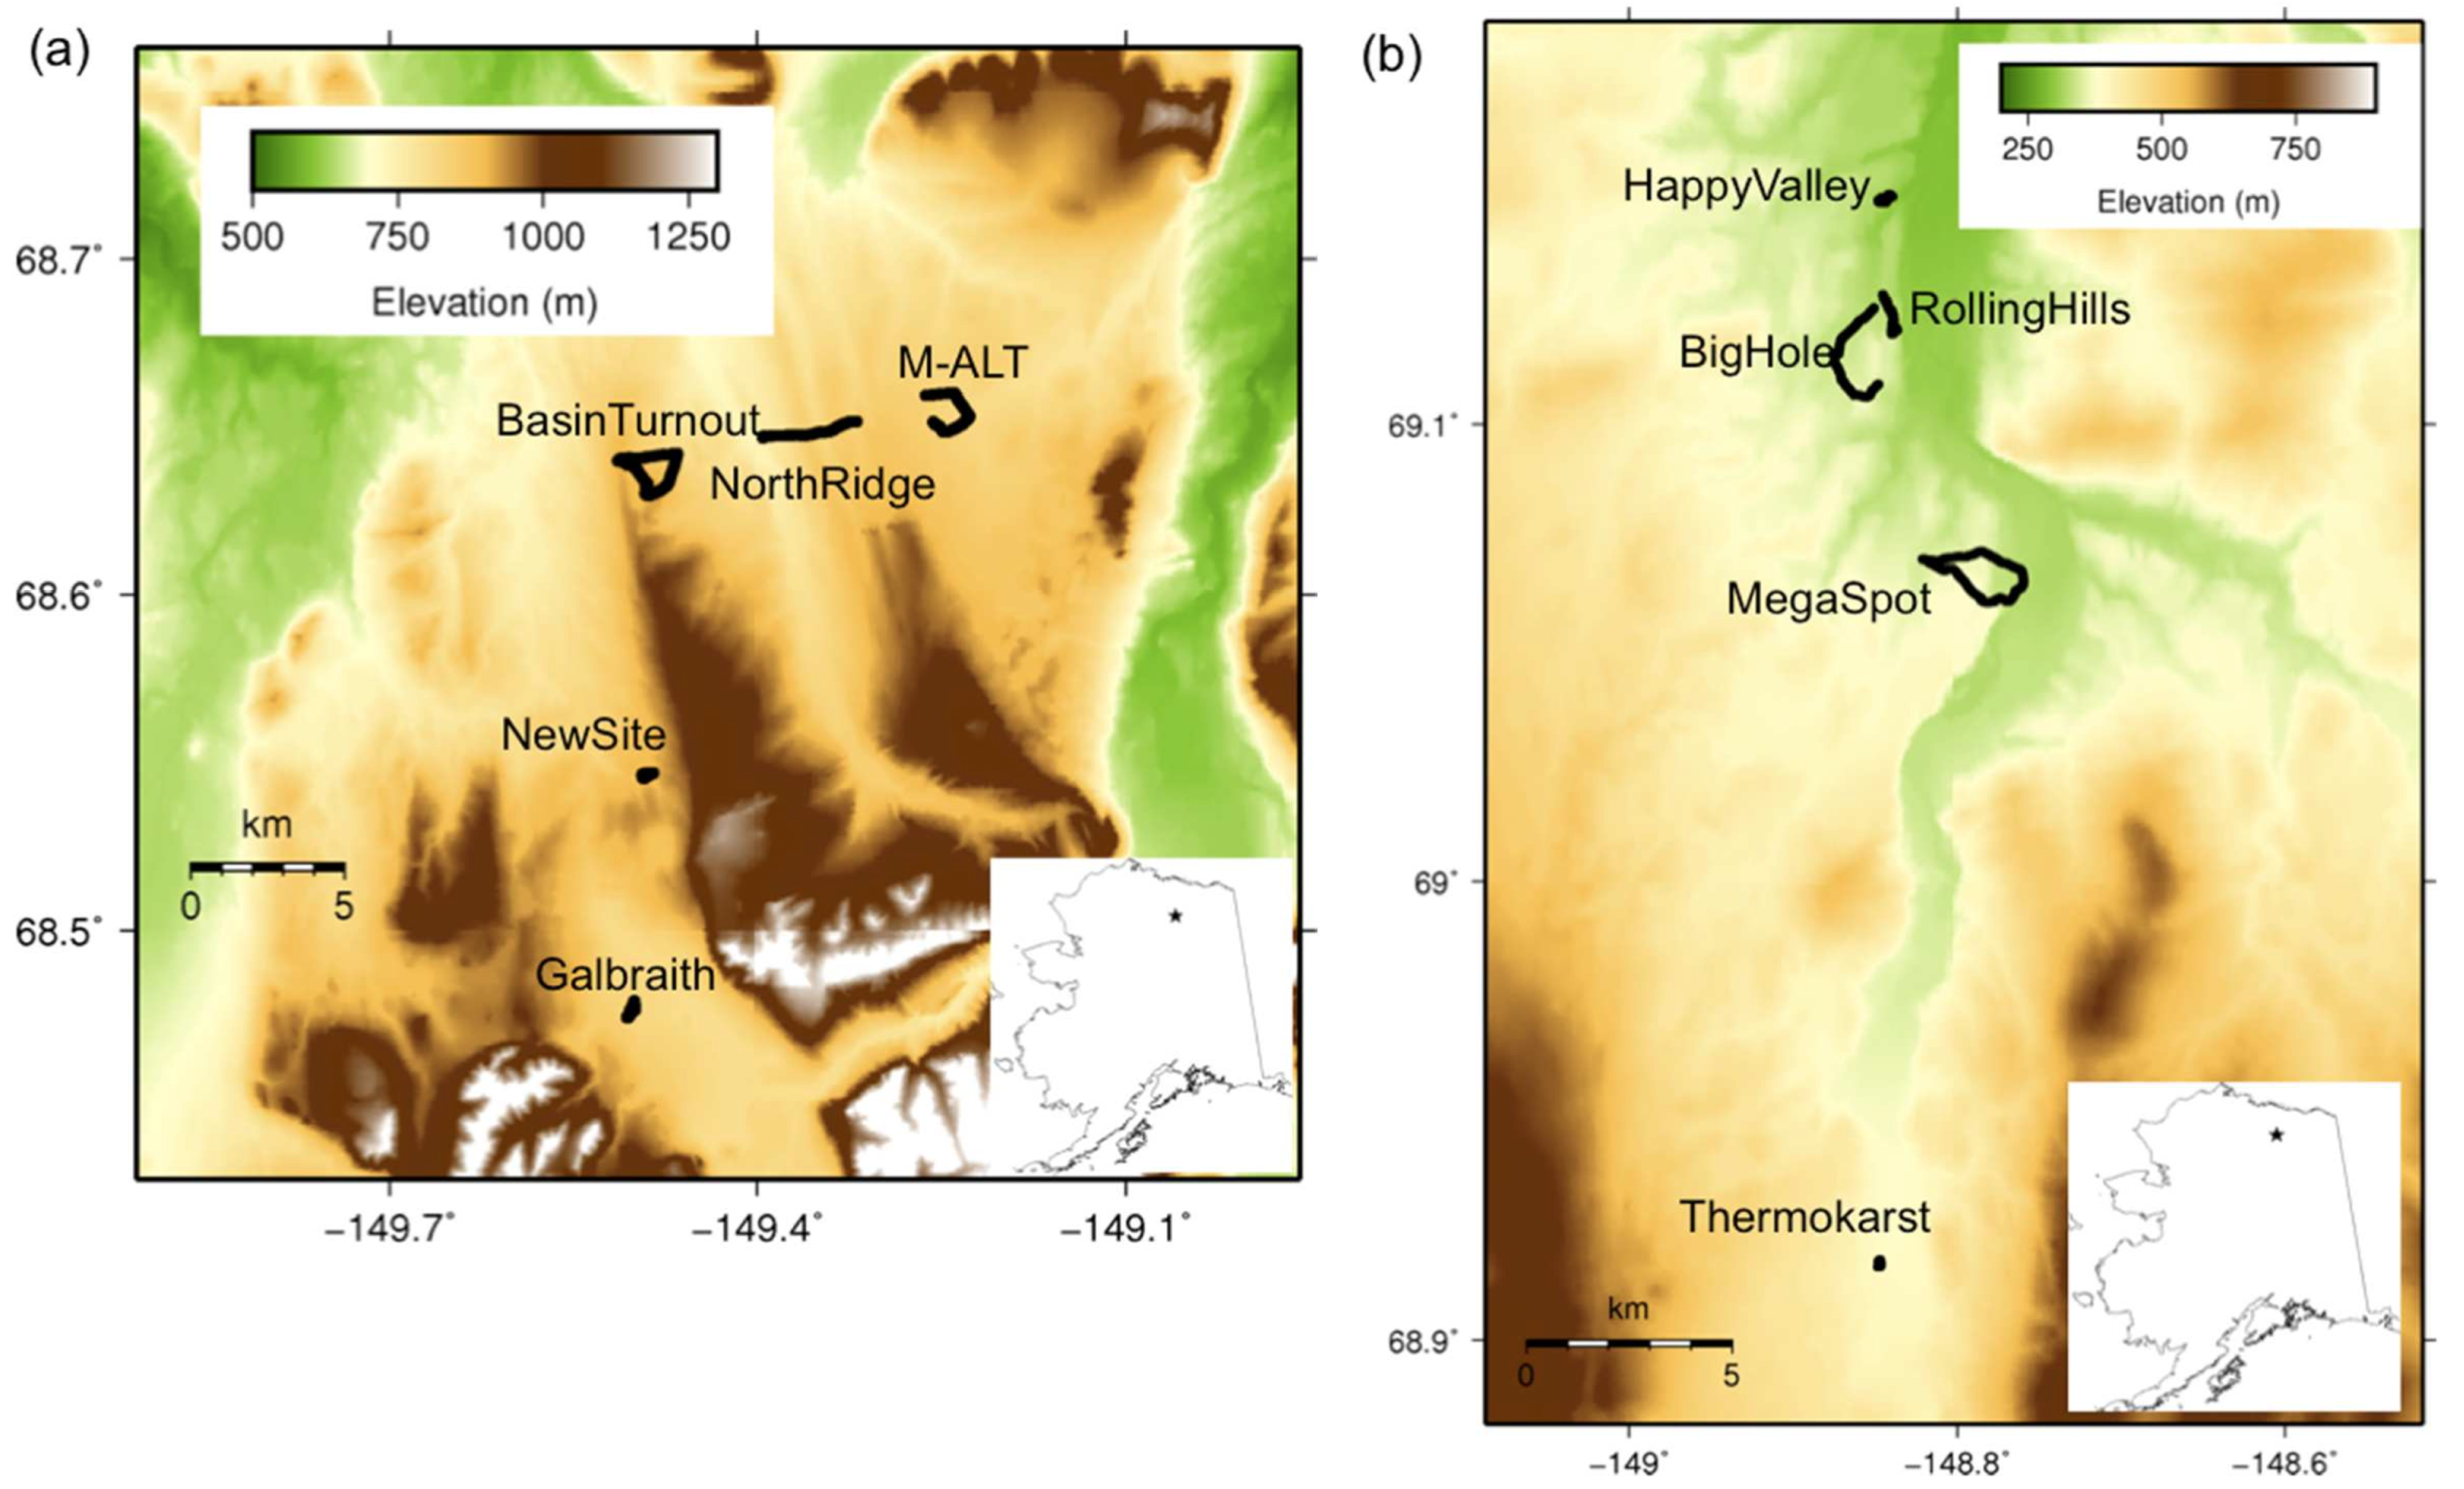
The investigators collected ground-penetrating radar (GPR) traces in August 2014 near Toolik Lake and Happy Valley on the North Slope of Alaska (Figure 2). Each site was visited once near the end of the summer thaw season, between August 11 to 14, 2014, and dates for each transect site are provided in the "probe_data.csv" file. GPR traces were taken along 10 transects of varying length (approx. 1 to 7 km). All transects were within the continuous permafrost zone and the routes were deliberately chosen to represent a variety of geological conditions in the region.
For information on data acquisition and processing methods, see Chen et al. (2015).

Figure 2. Map of GPR transect routes near (a) Toolik Lake and (b) Happy Valley (from Fig 2 in Chen et al. 2015).
Traditional probe ALT estimates were taken at 10 minute intervals along the transects, resulting in probe data with 100 to 500 m spacing. To measure ALT by mechanical probing, the investigators paused collection of GPR data and inserted a steel rod into the active layer to the permafrost table directly adjacent to the antenna. Since the measurements were taken at the end of the summer thaw season, we assume that the depth to which the rod was inserted is equal to the ALT for that season. At each probe location, probe ALT was recorded 3 times within a 1 m radius, along with the position data from the GPS unit.
While the bulk of data was collected in the form of kilometer-scale GPR routes, two high-resolution collocated GPR/mechanical probing surveys were undertaken to further characterize wave velocity variability near Toolik Lake and Happy Valley. These data are found in file ‘prb_gpr_alt.csv’. For each high-resolution survey, typically 50 to 100 meters long, the investigator team acquired GPR traces at 0.5 meter increments, with collocated mechanical probing ALT measurements at each GPR trace location, immediately beside the antenna.
Data Access
This data is available through the Oak Ridge National Laboratory (ORNL) Distributed Active Archive Center (DAAC).
Pre-ABoVE: Ground-penetrating Radar Measurements of ALT on the Alaska North Slope
Contact for Data Center Access Information:
- E-mail: uso@daac.ornl.gov
- Telephone: +1 (865) 241-3952
References
Chen, A., A.D. Parsekian, K. Schaefer, E. Jafarov, S.K. Panda, L. Liu, T. Zhang, and H. Zebker. 2015. GPR-derived measurements of active layer thickness on the landscape scale with sparse calibration at Toolik and Happy Valley, Alaska. Geophysics. In press.