Documentation Revision Date: 2025-06-01
Dataset Version: 2
Summary
This dataset holds 312 GeoTIFF files.
For the AMSR-E/2 record, there are 120 data files in GeoTIFF (.tif) format with this dataset. This includes data for the 100 months of November - March 2002-2011 and November - March 2012-2023, and 20 water year summary maps for 2003-2011 and 2013-2023. Thus, it is not possible to generate these data for the water year 2012 (no data for November 2011 - March 2012). For the SSMI/S record, there are 192 data files in GeoTIFF (.tif) format with this dataset. This includes data for the 160 months of November - March 1988-2020, and 32 water year summary maps for 1988-2020. These files provide the number of days per pixel associated with ROS events occurring within ABoVE (Arctic Boreal Vulnerability Experiment) grid tiles in Alaska.
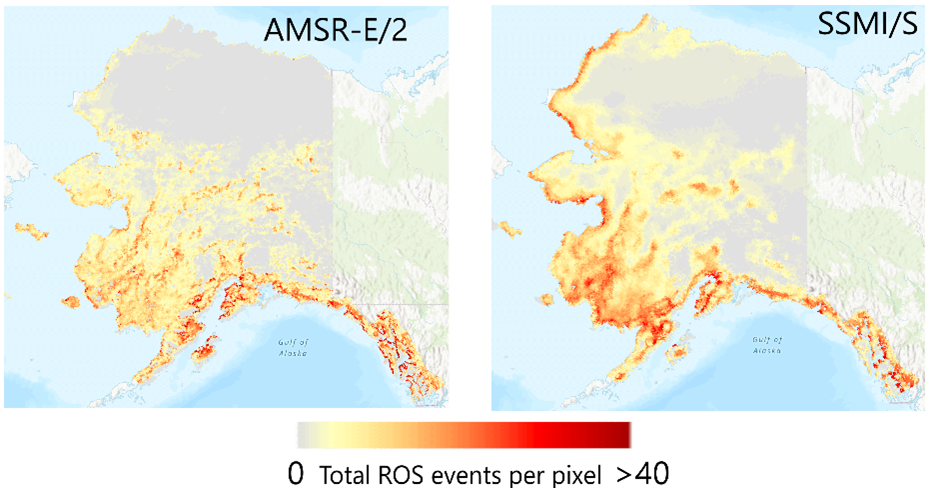
Figure 1. Total numbers of rain-on-snow (ROS) events per 6-km pixel over Alaska for water year 2014, which were derived using the respective AMSR-E/2 (left) and SSMI/S (right) observations.
Citation
Pan, C.G., J. Du, P.B. Kirchner, and J.S. Kimball. 2025. ABoVE: Rain-on-Snow Frequency and Distribution during Cold Seasons, Alaska, 1988-2023. ORNL DAAC, Oak Ridge, Tennessee, USA. https://doi.org/10.3334/ORNLDAAC/2415
Table of Contents
- Dataset Overview
- Data Characteristics
- Application and Derivation
- Quality Assessment
- Data Acquisition, Materials, and Methods
- Data Access
- References
- Dataset Revisions
Dataset Overview
This dataset provides maps of rain-on-snow (ROS) events across Alaska for the individual cold season months from November to March using observations from two space-borne passive microwave radiometers: (a) the Advanced Microwave Scanning Radiometer for EOS and Advanced Microwave Scanning Radiometer 2 (AMSR-E/2) from 2002 to 2023; and (b) the Special Sensor Microwave Imager and the Special Sensor Microwave Imager Sounder (SSMI/S) from 1988 to 2020. Considering the differences in sensor overpass time, observation geometry, and ancillary snow cover data, the AMSR-E/2 and SSMI/S-based ROS records were generated separately. ROS events were defined as changes in surface snow wetness and isothermal states induced by atmospheric processes associated with winter rainfall or latent heat exchange. The data are summations of the number of days with ROS events per pixel at 6-km spatial resolution per month or per 5-month water year. Winter months are when snowmelt from solar illumination is minimal and snow cover is widespread and relatively consistent throughout the region.
For the AMSR-E/2-based record, daily ROS geospatial classification across Alaska was derived by combining snow cover and daily microwave brightness temperature (Tb) retrievals from overlapping (a) Moderate Resolution Imaging Spectroradiometer (MODIS) MOD10A2 eight-day maximum snow cover extent (SCE) product and (b) AMSR-E (2002-2011) and AMSR2 (2012-2023) observations. For the SSMI/S-based record, ROS classification was made using (a) enhanced-resolution Tb observations (Brodzik and Long, 2018) from SSM/I F08 (1988-1991), F11 (1992-1995), F13 (1996-2007), SSMIS F17 (2007-2016) and F18 (2016-2020), and (b) snow cover simulations from a snow-evolution modeling system SnowModel (Liston et al., 2023).
ROS events were detected using a spectral gradient ratio approach to exploit the 19 and 37 GHz dielectric properties in response to enhanced liquid water content (LWC) within the surface snowpack. The spectral gradient ratio was applied to vertical and horizontal polarizations for constructing the gradient ratio polarization (GRP). ROS events were identified if the associated GRP values were smaller than predefined thresholds. The threshold was set as 1 for pixels with elevations below 900 m and -5 for higher elevations.To minimize potential misclassifications between ROS and persistent wet-snow conditions not caused by rainfall, an additional algorithm constraint was applied by requiring no ROS detected on the day prior to an identified ROS event (Pan et al., 2019) (refer to Figure 2 for a diagram of the workflow).
Project: Arctic-Boreal Vulnerability Experiment
The Arctic-Boreal Vulnerability Experiment (ABoVE) is a NASA Terrestrial Ecology Program field campaign being conducted in Alaska and western Canada, for 8 to 10 years, starting in 2015. Research for ABoVE links field-based, process-level studies with geospatial data products derived from airborne and satellite sensors, providing a foundation for improving the analysis, and modeling capabilities needed to understand and predict ecosystem responses to, and societal implications of, climate change in the Arctic and Boreal regions.
Related Publication:
Du, J., Kirchner, P.B., Pan, C.G., Watts, J.D. and Kimball, J.S., 2025. Assessing rain-on-snow event dynamics over Alaska using 30 year satellite microwave observations. Environmental Research Letters, 20(3), p.034048. http://doi.org/10.1088/1748-9326/adb9ff
Pan, C.G., P.B. Kirchner, J.S. Kimball, Y. Kim, and J. Du. 2018. Rain-on-snow events in Alaska, their frequency and distribution from satellite observations. Environmental Research Letters 13:075004. https://doi.org/10.1088/1748-9326/aac9d3
Pan, C.G., J.S. Kimball, M. Munkhjargal, N.P. Robinson, E. Tijdeman, L. Menzel and P.B. Kirchner. 2019. Role of surface melt and icing events in livestock mortality across Mongolia’s semi-arid landscape. Remote Sensing 11:2392. https://doi.org/10.3390/rs11202392
Related Dataset
Pan, C.G., P.B. Kirchner, J.S. Kimball, Y. Kim, and J. Du. 2018. ABoVE: Rain-on-Snow Frequency and Distribution during Cold Seasons, Alaska, 2003-2016. ORNL DAAC, Oak Ridge, Tennessee, USA. https://doi.org/10.3334/ORNLDAAC/1611
- Version 1 of this dataset.
Acknowledgment
This research was funded by National Park Service, Southwest Alaska Inventory and Monitoring Network (grant P23AC01622-00) and the NASA Arctic Boreal Vulnerability Experiment (ABoVE) (grant 80NSSC22K1238).
Data Characteristics
Spatial Coverage: Alaska
ABoVE Reference Locations:
Domain: Alaska
Grid cells: Ah000-001v000-001
Spatial resolution: 6 km
Temporal coverage: 1988-11-01 to 2023-03-31.
Temporal resolution: Monthly and by Water Year
Study Areas (All latitude and longitude given in decimal degrees)
|
Site |
Westernmost Longitude |
Easternmost Longitude |
Northernmost Latitude |
Southernmost Latitude |
|
Alaska, USA |
-175.39655 |
-124.32632 |
73.83395 |
46.62318 |
File information
This dataset holds 312 files in cloud optimized GeoTIFF (.tif) format. For the AMSR-E/2 record, there are 120 data files, which includes data for the 100 months of November - March 2002-2011 and November - March 2012-2023, and 20 water year summary maps for 2003-2011 and 2013-2023. There are no data for the water year 2012 (November 2011 - March 2012). For SSMI/S record, there are 192 data files, which includes data for the 160 months of November - March 1988-2020, and 32 water year summary maps for 1988-2020. These files provide the number of days per pixel associated with ROS events in ABoVE grid tiles.
Data file naming conventions:
The monthly files are named ABoVE_{sensor}_{year}_M{month}A_All.tif, where
- sensor is either “SSMI” (referring to SSMI/S sensors) or “AMSRU” (referring to AMSR-E/2 sensors),
- year is calendar year (YYYY)
- month (format mm) is the month over which the summation occurred.
The water-year files are named ABoVE_{sensor}_{year}_WY_A_All.tif, where
- year is water year (YYYY) over which the summation occurred.
For example, water year 2003 begins in November 2002 and ends in March of 2003.
Example file names:
- Monthly: ABoVE_AMSRU_2003_M11A_All.tif
- Water year: ABoVE_SSMI_1989_WY_A_All.tif
Properties of the GeoTIFF files
- Coordinate system: standard ABoVE projection, EPSG 102001, Canada Albers Equal Area Conic, meters
- Pixel values: the total number of days with snow-on-rain (ROS) events per 6-km pixel for a 1-month or 5-month period within a given water year, depending on file type. The pixel values range from 0 to 133. A value of = 0 indicates no ROS events were observed for that period.
- Native data type: Int16
- Nodata value: -9999; includes masked values outside of the ABoVE domain
Application and Derivation
Much of Alaska is in the ABoVE domain, where a better understanding of the distribution and underlying drivers of ROS will contribute to the ABoVE science objectives. The resulting data record for ROS events is suitable for documenting the spatial-temporal impacts of ROS events to changes in ecosystem services, wildlife populations, and hydrologic processes across Alaska (Pan et al., 2018). Considering the differences in sensor overpass time, observation geometry, and ancillary snow cover data, the AMSR-E/2 and SSMI/S-based ROS records were generated separately. The long-term SSMI/S record is suitable for ROS trend analysis for monitoring the regional climate change while the AMSR-E/2 record allows for an additional and independent assessment of the ROS events over the region.
Quality Assessment
A two-tiered validation approach was used to determine the accuracy of ROS detection. Tier-one combined human observer and meteorological measurements from Fairbanks, Alaska and resulted in estimated annual ROS detection accuracies from 75-100%. The tier-two validation filtered satellite detected snow wetness using three temperature derived proxies from 53 meteorological stations across Alaska. These proxies included the ratio between dew point and average temperature, wet bulb temperature, and the maximum and minimum temperature ratio, and produced a relative accuracy of 86% (Pan et al., 2018).The AMSR-E/2 and SSMI/S records are highly correlated (R=0.94), however, decreased performance and agreement between the two records are expected along coastal margins due to ocean water contamination of the microwave radiometer observations (Du et al., 2025).
Data Acquisition, Materials, and Methods
Wet snow and the icing events that frequently follow wintertime rain-on-snow (ROS) affect high latitude ecosystems at multiple spatial and temporal scales, including hydrology, carbon cycle, wildlife, and human development. In this study, ROS spatio-temporal variability was quantified across Alaska during the cold season, for the individual months from November to March (i.e, a water-year), and the associated water year summaries.
ROS days were defined as the satellite passive microwave detection of abrupt changes in surface snow wetness and isothermal states induced by physical processes, such as sensible, latent and turbulent heat exchange that are often associated with winter rainfall. ROS events and associated snow wetness were detected using a spectral Gradient Ratio to exploit the 19 and 37 GHz dielectric properties in response to ROS events and enhanced liquid water content (LWC) within the surface snowpack (Grenfell and Putkonen, 2008).
Data sources used in the study included:
- The AMSR-E sensor, launched in 2002 on board the NASA Aqua satellite, and operated until 2011,
- The AMSR2, successfully launched in 2012 on board the JAXA GCOM-W satellite,
- Observations (1988-2020) from the SSMI/S sensors on board the Defense Meteorological Satellite Program (DMSP) satellites,
- The MOD10A2 eight-day maximum snow cover extent (SCE) product (2002-2023) (Hall and Riggs, 2016), and
- Snow cover simulations (1988-2020) from a snow-evolution modeling system SnowModel.
ROS workflow
The Alaska regional classification was derived using daily ascending, vertical (V) and horizontal (H) polarization (pol) Tb retrievals at 19 and 37 GHz from the 6-km resolution polar EASE-grid v2 AMSR-E/2 and SSMI/S records. Two different gradient ratio polarization (GRP) thresholds were applied to classify ROS events for different elevation zones: GRP<1 was used to identify ROS events below 900 m, while GRP<(−5) was used for elevations above 900 m (Figure 2). The ROS algorithm was performed over the snow-covered pixels, which were determined by 37 GHz V pol Tb (Tb < 265 K), ancillary MODIS snow cover extent (SCE) product data in the AMSR-E/2-based retrievals, and SnowModel snow cover simulations in the SSMI/S-based retrievals.
The GeoTIFF files hold the total number of days with snow-on-rain (ROS) events per 6-km pixel for a 1-month or 5-month period within a given water year, depending on file type. The pixel values range from 0 to 133. A value of = 0 indicates no ROS events were observed for that period.
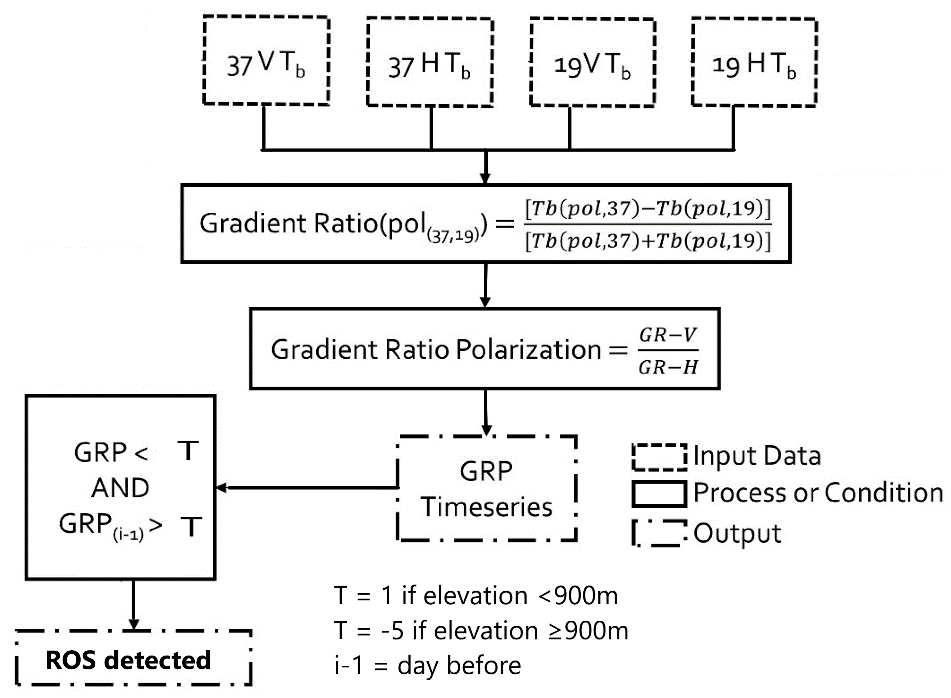
Figure 2. Schematic of workflow used to derive ROS products (Pan et al., 2018; Pan et al., 2019).
Data Access
These data are available through the Oak Ridge National Laboratory (ORNL) Distributed Active Archive Center (DAAC).
ABoVE: Rain-on-Snow Frequency and Distribution during Cold Seasons, Alaska, 1988-2023
Contact for Data Center Access Information:
- E-mail: uso@daac.ornl.gov
- Telephone: +1 (865) 241-3952
References
Brodzik, M.J. and D. G. Long. 2018. Calibrated Passive Microwave Daily EASE-Grid 2.0 Brightness Temperature ESDR (CETB) Algorithm Theoretical Basis Document, v1.0. NSIDC MEaSUREs Project White Paper. NSIDC; Boulder, Colorado, USA. https://doi.org/10.5281/zenodo.7958456.
Du, J., Kirchner, P.B., Pan, C.G., Watts, J.D. and Kimball, J.S., 2025. Assessing rain-on-snow event dynamics over Alaska using 30 year satellite microwave observations. Environmental Research Letters, 20(3), p.034048. http://doi.org/10.1088/1748-9326/adb9ff
Grenfell, T.C. and J. Putkonen. 2008. A method for the detection of the severe rain-on-snow event on Banks Island, October 2003, using passive microwave remote sensing. Water Resources Research 44:1-9. https://doi.org/10.1029/2007WR005929
Hall, D.K. and G.A. Riggs. 2016. MODIS/Terra Snow Cover 8-Day L3 Global 500m Grid, Version 6. Boulder, Colorado USA. NASA National Snow and Ice Data Center Distributed Active Archive Center. https://doi.org/10.5067/MODIS/MOD10A2.006
Homer, C., J. Dewitz, L. Yang, S. Jin, P. Danielson, G. Xian, J. Coulston, N. Herold, J. Wickham, and K. Megown. 2015. Completion of the 2011 National Land Cover Database for the conterminous United States – Representing a Decade of Land Cover Change Information. Photogrammetric Engineering and Remote Sensing 81:345-354. https://doi.org/10.1016/S0099-1112(15)30100-2
Liston, G.E., A.K. Reinking, and N.T. Boleman. 2023. Daily SnowModel Outputs Covering the ABoVE Core Domain, 3-km Resolution, 1980-2020. ORNL DAAC, Oak Ridge, Tennessee, USA. https://doi.org/10.3334/ORNLDAAC/2105
Pan, C.G., P.B. Kirchner, J.S. Kimball, Y. Kim, and J. Du. 2018. Rain-on-snow events in Alaska, their frequency and distribution from satellite observations. Environmental Research Letters 13:075004. https://doi.org/10.1088/1748-9326/aac9d3
Pan, C.G., J.S. Kimball, M. Munkhjargal, N.P. Robinson, E. Tijdeman, L. Menzel and P.B. Kirchner. 2019. Role of surface melt and icing events in livestock mortality across Mongolia’s semi-arid landscape. Remote Sensing 11:2392. https://doi.org/10.3390/rs11202392
Dataset Revisions
| Product Version | Release Date | Revision Notes |
|---|---|---|
| 2.0 | 2025-06-01 | The algorithm was updated with an additional constraint requiring no ROS detected on the day prior to an identified ROS event.The AMSR-E/2 data record from 2002-2023 was re-generated using the updated algorithm. The SSMI/S data record from 1988-2020 was newly added. |
| 1.0 | 2018-12-19 | First release of this dataset |