Documentation Revision Date: 2018-11-30
Data Set Version: 1
Summary
ROS events were detected using a spectral gradient ratio approach to exploit the 19 and 37 GHz dielectric properties of AMSR in response to enhanced liquid water content (LWC) within the surface snowpack. The spectral gradient ratio was applied to vertical and horizontal polarizations and then ratioed together as the gradient ratio polarization (GRP). Threshold values were then applied to the GRP to detect ROS. The threshold was set to < 1 for elevations below 900 m and < -5 for elevations above 900 m.
There are 78 data files in GeoTIFF (.tif) format with this dataset. This includes data for the 65 months of November - March 2002-2011 and November - March 2012-2016, and 13 water year summary maps for 2003-2011 and 2013-2016. There are no data for the water year 2012 (November 2011 - March 2012). The files provide the number of days per pixel associated with ROS events in ABoVE grid tiles, which are included in the file names.

Figure 1. Time series by water year, of days with rain-on-snow (ROS) summed for each 6-km pixel. A 24-km coastal mask was used to minimize open water body effects on the passive microwave (PM) retrievals.
Citation
Pan, C.G., P.B. Kirchner, J.S. Kimball, Y. Kim, and J. Du. 2018. ABoVE: Rain-on-Snow Frequency and Distribution during Cold Seasons, Alaska, 2003-2016. ORNL DAAC, Oak Ridge, Tennessee, USA. https://doi.org/10.3334/ORNLDAAC/1611
Table of Contents
- Data Set Overview
- Data Characteristics
- Application and Derivation
- Quality Assessment
- Data Acquisition, Materials, and Methods
- Data Access
- References
Data Set Overview
This dataset provides maps of rain-on-snow (ROS) events across Alaska for the individual months of November – March 2002-2011 and November – March 2012-2016, and annual water year summary maps for 2003-2011 and 2013-2016. ROS events were defined as changes in passive microwave (PM) detection in surface snow wetness and isothermal states induced by atmospheric processes often associated with winter rainfall. The data are summations of the number of days with ROS events per pixel at 6-km spatial resolution per month or per 5-month water year. The daily ROS record encompassed the months when snowmelt from solar irradiance is minimal and snow cover is widespread and relatively consistent throughout the region. Daily ROS geospatial classification across Alaska was derived by combining snow cover and daily microwave brightness temperature retrievals sensitive to landscape freeze–thaw dynamics from overlapping (1) Moderate Resolution Imaging Spectroradiometer (MODIS) MOD10A2 eight-day maximum snow cover extent (SCE) product and (2) Advanced Microwave Scanning Radiometer for EOS (AMSR-E) (2002-2011) and the Advanced Microwave Scanning Radiometer 2 (AMSR2) (2012-to present) Microwave Radiation Imager (MWRI) observations at 19 GHz and 37 GHz.
ROS events were detected using a spectral gradient ratio approach to exploit the 19 and 37 GHz dielectric properties of AMSR in response to enhanced liquid water content (LWC) within the surface snowpack. The spectral gradient ratio was applied to vertical and horizontal polarizations and then ratioed together as the gradient ratio polarization (GRP). Threshold values were then applied to the GRP to detect ROS. The threshold was set to < 1 for elevations below 900 m and < -5 for elevations above 900 m (refer to Figure 2 for a diagram of the workflow)..
Project: Arctic-Boreal Vulnerability Experiment
The Arctic-Boreal Vulnerability Experiment (ABoVE) is a NASA Terrestrial Ecology Program field campaign based in Alaska and western Canada between 2016 and 2021. Research for ABoVE links field-based, process-level studies with geospatial data products derived from airborne and satellite sensors, providing a foundation for improving the analysis and modeling capabilities needed to understand and predict ecosystem responses and societal implications.
Related Publication:
Pan, C.G., P.B. Kirchner, J.S. Kimball, Y. Kim, and J. Du. 2018. Rain-on-snow events in Alaska, their frequency and distribution from satellite observations. Environ. Res. Lett., (13),7. https://doi.org/10.1088/1748-9326/aac9d3
Acknowledgments:
This research was funded by National Park Service Southwest Alaska Network and the NASA Arctic Boreal Vulnerability Experiment (ABoVE) grant NNX15AT74A.
Data Characteristics
Spatial Coverage Alaska
ABoVE Reference Locations:
Domain: Core ABoVE
Grid cells: Ah000-001v000-001
Spatial resolution: 6 km
Temporal coverage: 2002-11-01 through 2016-03-31.
Temporal resolution: Monthly and by Water Year
Study Areas (All latitude and longitude given in decimal degrees)
| Site | Westernmost Longitude | Easternmost Longitude | Northernmost Latitude | Southernmost Latitude |
|---|---|---|---|---|
| Alaska, USA | -175.3897222 | -111.5422222 | 73.84722222 | 48.62694444 |
File information
This includes data in GeoTIFF format for the 65 months of November - March 2002-2011 and November - March 2012-2016, and 13 water year summary maps for 2003-2011 and 2013-2016. The files provide the number of days per pixel per month or per water year identified as a ROS event in AboVE grid tiles, which are included in the file names. There are no data for the water year 2012 (November 2011 - March 2012).
Data file naming conventions:
The 65 monthly files are named ABoVE.Rain-On-Snow.{year}{month}.Ah000-001.v000-001.{x}.20180604.tif
Where: year is calendar year (YYYY) and month (format mm) is the month over which the summation occurred.
The 13 water-year files are named ABoVE.Rain-On-Snow.{year}_Water_Year_Ah000-001v000-001.001.20180604.tif
Where: year is water year (YYYY). The water year, over which the summation occurred, is defined as the months November – March. That is, water year 2003 begins in November 2002 and ends in March of 2003.
ABoVe grid and version designation:
A represents the reference grid name
h000-0001 indicates that the data cover the horizontal tiles from 0-1 in the A reference grid.
v000-0001 indicates that the data cover the vertical tiles from 0-1 in the A reference grid.
x indicates the data product version (format xxx).
20180604 is the production date of the product.
Example file names:
Monthly: ABoVE.Rain-On-Snow.200212.Ah000-001v000-001.001.10212018.tif
Water year: ABoVE.Rain-On-Snow.2003_Water_Year_Ah000-001v000-001.001.10212018.tif
Table 1. Description of data values in the files.
| Value | Description |
|---|---|
| 0-133 | The range, minimum to maximum, of the number of days where ROS/wet snow was observed across the AK domain in the ABoVE grid (total ROS events per pixel). No rain-on-snow identified=0 |
| -9999 | Masked values outside of the AK domain (no data value) |
Properties of the GeoTIFF files
- Map units- meters.
- Variable units- days (number of days of snow-on-rain events per pixel).
- Native data type- Int16
- Projection-EPSG: 102001 (standard ABoVE projection)
NOTE: A companion file ROS_Data_Reader_Plotter.py is provided which provides a script with the basic GDAL tools to extract projection, rows/columns, and geotransform information from the ROS data. The script requires installations of GDAL, numpy, and matplotlib. The script also allows for quick visualization of the data by plotting the ROS data GeoTiffs as an array. The user is only required to change the ‘inputfile’ string to the file and associated directory.
Application and Derivation
Much of Alaska is in the ABoVE domain, where a better understanding of the distribution and underlying drivers of ROS will contribute to the ABoVE science objectives. The resulting data record for ROS events is suitable for documenting the spatial-temporal impacts of ROS events to changes in ecosystem services, wildlife populations, and hydrologic processes across Alaska (Pan et al., 2018).
Quality Assessment
A two-tiered validation approach was used to determine the accuracy of ROS detection. Tier-one combined human observer and meteorological measurements from Fairbanks, Alaska and resulted in estimated annual ROS detection acuracies from 75-100%. The tier-two validation filtered satellite detected snow wetness using three temperature derived proxies from 53 meteorological stations across Alaska. These proxies included the ratio between dew point and average temperature, wet bulb temperature, and the maximum and minimum temperature ratio, and produced a relative accuracy of 86% (Pan et al., 2018).
Data Acquisition, Materials, and Methods
Wet snow and the icing events that frequently follow wintertime rain-on-snow (ROS) affect high latitude ecosystems at multiple spatial and temporal scales, including hydrology, carbon cycle, wildlife, and human development. In this study, ROS spatio-temporal variability was quantified across Alaska during the cold season, for the months of November – March 2002-2011 and November – March 2012-2016, and annual water year summaries for 2003-2011 and 2013-2016.
ROS days were defined as the satellite PM detection of abrupt changes in surface snow wetness and isothermal states induced by physical processes, such as sensible, latent and turbulent heat exchange that are often associated with winter rainfall. ROS events and associated snow wetness were detected using a spectral Gradient Ratio to exploit the 19 and 37 GHz dielectric properties in response to ROS events and enhanced liquid water content (LWC) within the surface snowpack (Grenfell and Putkonen, 2008).
Data sources used in the study included:
- The AMSR-E sensor, launched in 2002 on board the NASA Aqua satellite, and operated until 2011,
- The AMSR2, successfully launched in 2012 on board the JAXA GCOM-W satellite, and
- The MOD10A2 eight-day maximum snow cover extent (SCE) product from MODIS (Hall and Riggs, 2016).
The MODIS data provide relatively fine scale information (500-m resolution) on SCE, while AMSR provides daily microwave brightness temperature (Tb) retrievals sensitive to landscape freeze–thaw dynamics, but within a relatively coarse (~12.5-km) sensor footprint, insensitive to potential signal degradation from polar darkness, low solar illumination, cloud cover, and atmospheric aerosol contamination effects.
The AMSR record was derived using an empirical calibration of similar frequency Tb retrievals from overlapping FY3B Microwave Radiation Imager (MWRI) observations. The AMSR record has twice-daily, vertical (V) and horizontal (H) polarization Tb retrievals acquired from ascending and descending polar orbital equatorial crossings at 1:30 pm and 1:30 am, which is suitable for detecting ROS. Lower-frequency Tb retrievals (18.7 GHz and 36.5 GHz, henceforth rounded to 19 and 37 GHz) from the AMSR record were used for ROS detection as they are sensitive to snow cover properties and landscape freeze–thaw dynamics but insensitive to potential signal degradation from polar darkness, low solar illumination, cloud cover, and atmospheric aerosol contamination effects.
The AMSR orbital swath Tb data were spatially re-sampled to a 6-km resolution polar EASE-Grid (version 2) geographic projection, using an inverse distance squared weighting method. The new 6-km grid provided an intermediate resolution between the finer scale (500- m) MODIS SCE and the coarser resolution (~12.5 km) AMSR Tb observations, while enabling enhanced assessment of terrain and land cover spatial heterogeneity (Pan et al., 2018).
ROS workflow
The Alaska regional classification was derived using daily ascending V and H pol Tb retrievals at 19 and 37 GHz from the 6-km resolution polar EASE-grid AMSR record (Figure 2).
- Water-contaminated pixels induced by the conical scanning of AMSR sensor records were masked using a 24 km (~4-pixel) shoreline and water-body buffer created from the 2011, 30-m resolution National Land Cover Database (Homer et al., 2015).
- The MODIS SCE record was used to identify snow-covered areas after screening out low-quality pixels, including missing or degraded snow cover observations, identified by the MOD10A2 product quality flags.
- The AMSR 37 GHz V pol Tb record was analyzed separately to identify potential snow-covered pixels outside the water body buffer, where Tb < 265 K. Pixels identified as being snow-covered by both the MODIS SCE and AMSR Tb records were then used to derive daily GR and subsequent GRP values for each classified snow pixel over the multi-year (2003–2011, 2013–2016) study period defined by the AMSR record.
- Two different GRP thresholds were applied to classify ROS events for different elevation zones: GRP < 1 was used to identify ROS events below 900 m, while GRP <−5 was used for elevations above 900 m.
- A spatial connectivity threshold of > 10 pixels was then used as a designated size threshold to isolate and analyze more regionally extensive ROS events.
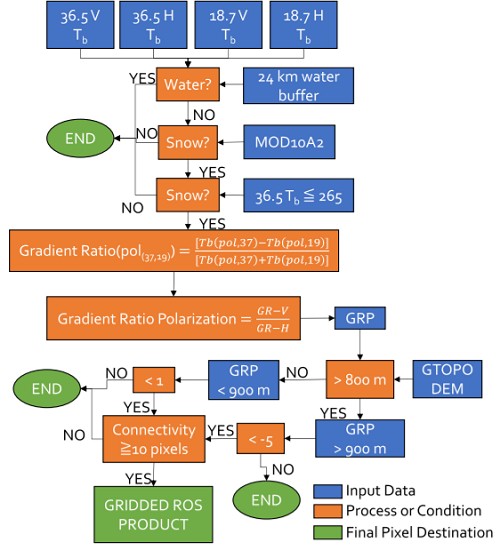
Figure 2. Schematic of workflow used to derive gridded daily PM ROS product (Pan et al., 2018).
Data Access
These data are available through the Oak Ridge National Laboratory (ORNL) Distributed Active Archive Center (DAAC).
ABoVE: Rain-on-Snow Frequency and Distribution during Cold Seasons, Alaska, 2003-2016
Contact for Data Center Access Information:
- E-mail: uso@daac.ornl.gov
- Telephone: +1 (865) 241-3952
References
Grenfell, T.C. and J. Putkonen. 2008. A method for the detection of the severe rain-on-snow event on Banks Island, October 2003, using passive microwave remote sensing Water Resour. Res. 44 1–9. https://doi.org/10.1029/2007WR005929
Hall, D. K. and G. A. Riggs. 2016. MODIS/Terra Snow Cover 8-Day L3 Global 500m Grid, Version 6. Boulder, Colorado USA. NASA National Snow and Ice Data Center Distributed Active Archive Center. https://doi.org/10.5067/MODIS/MOD10A2.006. [June 16, 2017].
Homer, C., J. Dewitz, L. Yang, S. Jin, P. Danielson, G. Xian, J. Coulston, N. Herold, J. Wickham, and K. Megown. 2015. Completion of the 2011 National Land Cover Database for the Conterminous United States – Representing a Decade of Land Cover Change Information. Photogrammetric Engineering and Remote Sensing. American Society for Photogrammetry and Remote Sensing, Bethesda, MD, 81:345-354
Pan, C.G., P.B. Kirchner, J.S. Kimball, Y. Kim, and J. Du. 2018. Rain-on-snow events in Alaska, their frequency and distribution from satellite observations. Environ. Res. Lett., 7. https://doi.org/10.1088/1748-9326/aac9d3