Documentation Revision Date: 2024-07-23
Dataset Version: 1
Summary
There are 43 data files in Comma-Separated Values (*.csv) format, one for each of 29 trees per measurement year, included in this dataset. Also included are 30 companion files providing images of selected trees.

Figure 1. A white spruce tree is instrumented with a hemispherical and field-stop photochemical reflectance index (PRI) sensor and point dendrometer at a northern treeline site along the Dalton Highway, Brooks Range, Alaska. Source: Eitel et al., 2020
Citation
Eitel, J., A.J. Maguire, K. Griffin, N. Boelman, J.E. Jensen, S.C. Schmiege, and L. Vierling. 2020. ABoVE: Photochemical Reflectance and Tree Growth, Brooks Range, Alaska, 2018-2019. ORNL DAAC, Oak Ridge, Tennessee, USA. https://doi.org/10.3334/ORNLDAAC/1781
Table of Contents
- Dataset Overview
- Data Characteristics
- Application and Derivation
- Quality Assessment
- Data Acquisition, Materials, and Methods
- Data Access
- References
Dataset Overview
This dataset provides simultaneous in-situ measurements of the photochemical reflectance index (PRI) and radial tree growth of selected white spruce trees (Picea glauca (Moench) Voss) at the northern treeline in the Brooks Range of Alaska, south of Chandalar Shelf and Atigun Pass on the east side of the Dalton Highway. PRI and dendrometer measurements were simultaneously collected on 29 trees from six plots spaced along a 5.5 km transect from south to north where tree density becomes increasingly sparse. Measurements were made throughout the 2018 and 2019 growing seasons (May 1 to September 15) with a sampling interval of 5 minutes. The data were collected to better understand the suitability of the PRI to remotely track radial tree growth dynamics.
Project: Arctic-Boreal Vulnerability Experiment
The Arctic-Boreal Vulnerability Experiment (ABoVE) is a NASA Terrestrial Ecology Program field campaign being conducted in Alaska and western Canada, for 8 to 10 years, starting in 2015. Research for ABoVE links field-based, process-level studies with geospatial data products derived from airborne and satellite sensors, providing a foundation for improving the analysis, and modeling capabilities needed to understand and predict ecosystem responses to, and societal implications of, climate change in the Arctic and Boreal regions.
Related Publication
Eitel, J.U.H., A.J. Maguire, N. Boelman, L.A. Vierling, K.L. Griffin, J. Jensen, T.S. Magney, P.J. Mahoney, A.J.H. Meddens, C. Silva, and O. Sonnentag. 2019. Proximal remote sensing of tree physiology at northern treeline: Do late-season changes in the photochemical reflectance index (PRI) respond to climate or photoperiod? Remote Sensing of Environment, 221:340–350. https://doi.org/10.1016/j.rse.2018.11.022
Related Dataset
Maguire, A.J., J. Eitel, L. Vierling, N. Boelman, K. Griffin, J.S. Jennewein, and J.E. Jensen. 2020. ABoVE: Terrestrial Lidar Scanning Forest-Tundra Ecotone, Brooks Range, Alaska, 2016. ORNL DAAC, Oak Ridge, Tennessee, USA. https://doi.org/10.3334/ORNLDAAC/1782
Acknowledgments
This work was supported by NASA ABoVE (grant NNX15AT86A).
Data Characteristics
Spatial Coverage: east side of Dalton Highway, south of Chandalar Shelf, Brooks Range, Alaska, USA
ABoVE Reference Locations
Domain: Core ABoVE
State/Territory: Alaska
Grid cells: Ch046v022
Spatial Resolution: Six plots spaced along a 5.5 km transect from south to north where tree density becomes increasingly sparse
Temporal Coverage: 2018-05-01 to 2019-09-13
Temporal Resolution: Dendrometer data are reported as a 20-minute average. Radiometer data are reported at 5-minute intervals.
Study Area: Latitude and longitude are given in decimal degrees.
| Site | Westernmost Longitude | Easternmost Longitude | Northernmost Latitude | Southernmost Latitude |
|---|---|---|---|---|
| Alaska | -149.718 | -149.76 | 68.01937 | 67.97225 |
Data File Information
There are 43 data files in Comma-Separated Values (*.csv) format, one for each of 29 trees per measurement year (Table 1). The file naming convention is <plot ID><tree ID>_dendro_<year>.csv (e.g., 1B_dendro_2018.csv), where
<plot ID> = 1—6,
<tree ID> = A—F, and
<year> = 2018 or 2019.
Data File Details
In Table 1, the X_coord and Y_coord columns reflect geospatial information using the projection "WGS 84 / UTM zone 6N" EPSG:26906, and were measured with a handheld GPS (± 3 m accuracy).
Table 1. Locations of measured trees and years of reported data.
| Plot | Tree | X_coord | Y_coord | Longitude | Latitude | 2018 Data | 2019 Data |
|---|---|---|---|---|---|---|---|
| 1 | B | 386468.4 | 7547511 | -149.719 | 68.01927 | Y | Y |
| 1 | C | 386469.3 | 7547515 | -149.719 | 68.01931 | Y | Y |
| 1 | D | 386469.6 | 7547520 | -149.719 | 68.01935 | Y | N |
| 1 | E | 386476 | 7547522 | -149.719 | 68.01937 | Y | Y |
| 1 | F | 386480.7 | 7547510 | -149.718 | 68.01927 | Y | N |
| 2 | A | 385575.8 | 7546077 | -149.739 | 68.00607 | N | Y |
| 2 | B | 385573.2 | 7546083 | -149.739 | 68.00612 | Y | N |
| 2 | C | 385581.3 | 7546087 | -149.738 | 68.00616 | Y | N |
| 2 | E | 385583.4 | 7546079 | -149.738 | 68.00609 | N | Y |
| 2 | F | 385579.8 | 7546077 | -149.739 | 68.00607 | Y | Y |
| 3 | A | 384916.8 | 7544897 | -149.753 | 67.99523 | Y | N |
| 3 | B | 384911 | 7544900 | -149.753 | 67.99526 | Y | N |
| 3 | C | 384913 | 7544903 | -149.753 | 67.99529 | Y | N |
| 3 | D | 384916.5 | 7544903 | -149.753 | 67.99529 | Y | N |
| 3 | E | 384925.7 | 7544913 | -149.753 | 67.99538 | Y | N |
| 3 | F | 384929.7 | 7544907 | -149.753 | 67.99533 | Y | N |
| 4 | A | 384878.2 | 7544827 | -149.754 | 67.99459 | N | Y |
| 5 | A | 384563.2 | 7543729 | -149.76 | 67.98463 | Y | Y |
| 5 | B | 384560.6 | 7543750 | -149.76 | 67.98482 | Y | Y |
| 5 | C | 384569.3 | 7543751 | -149.76 | 67.98483 | Y | Y |
| 5 | D | 384571.1 | 7543755 | -149.76 | 67.98487 | Y | Y |
| 5 | E | 384572.3 | 7543734 | -149.76 | 67.98468 | N | Y |
| 5 | F | 384569.7 | 7543731 | -149.76 | 67.98465 | Y | Y |
| 6 | A | 384576.5 | 7542347 | -149.759 | 67.97225 | Y | Y |
| 6 | B | 384569.9 | 7542359 | -149.759 | 67.97236 | Y | Y |
| 6 | C | 384573.7 | 7542357 | -149.759 | 67.97234 | Y | Y |
| 6 | D | 384581.5 | 7542364 | -149.758 | 67.97241 | Y | Y |
| 6 | E | 384581.5 | 7542359 | -149.758 | 67.97236 | Y | Y |
| 6 | F | 384581.4 | 7542352 | -149.758 | 67.9723 | Y | N |
Table 2. Variable names and descriptions. Both PRI and dendrometer measurements are in the same files. Missing values are coded as -9999.
| Column name | Units/Format | Description |
|---|---|---|
| Timestamp | yyyy-mm-dd HH:MM | Time of sampling, 5-minute frequency. Time Zone UTC-8. |
| PRI | unitless | Photochemical reflectance index (PRI), 5-minute reporting interval. |
| Radius | cm | Radius of a tree trunk reported as a 20-minute average of 1-minute measurements. Intervals between 20-minute averages are coded as missing data (i.e., -9999). |
Companion File Information
Thirty companion files provide images of selected trees, although not all selected trees have reported measurements (e.g., tree 1A in Table 1). The file naming convention is <plot ID><tree ID>.jpg (e.g., 1a.jpg), where
<plot ID> = 1—6 and
<tree ID> = A—F.
Application and Derivation
This dataset contains simultaneous in-situ measurements of the photochemical reflectance index (PRI) and radial tree growth. The data were collected to better understand the suitability of the PRI to remotely track radial tree growth dynamics. See Eitel et al., 2020 for details.
Quality Assessment
Dendrometer
Although this inexpensive potentiometer has independent linearity of ± 1%, the range of motion on a single tree at field sites over the course of a year was very small (< 2 mm) and the relative response of each unit was considered linear. Each potentiometer was independently calibrated at the time the dendrometer was installed and related to the measured tree diameter at DBH to derive tree stem radial changes from the voltage difference signal.
A test of temperature effects on the complete dendrometer/data logger system was conducted by holding a plunger in a fixed position, depressed by approximately 50% with a thin stainless-steel band attached to the potentiometer body, which demonstrated less than one bit of resolution change (< 0.1µm) while ambient temperature naturally varied across a range of more than 30°C (Griffin 2020, unpublished data). Since the dendrometers were placed on top of the thin bark (after carefully removing any loose bark with a small rasp, while avoiding damage to the living tissues), all processes that caused changes in the stem diameter were recorded. These included bark swelling and shrinking, cambial activity, changes in phloem, xylogenesis, and stem hydraulics. Of these, only xylogenesis caused an irreversible change in stem diameter and, thus, is the focus of discussion. However, caution should be taken, particularly when assessing shorter-term responses to consider other processes, particularly changes in stem diameter caused by tree hydrology.
Before using the dendrometer time-series for further analysis, a kernel-density estimation approach was implemented in the R package “ks” (Duong, 2018) to objectively remove sporadic data-points along the time-series that showed a kernel-density less than or equal to the 20th kernel density percentile.
SRS Radiometers
Calibrated radiometers (SRS, METER Group, Inc., Pullman, WA) were installed and maintained following the methods of Eitel et al., (2019). As with the dendrometer time-series, kernel-density estimation objectively removed sporadic data-points (e.g., owing to rain on foliage and/or hemispherical sensor) along the PRI time-series that showed a kernel-density less than or equal to 20th kernel density percentile.
Data Acquisition, Materials, and Methods
The following descriptions were excerpted from Eitel et al., 2020. Photos of measured trees are provided as companion files.
Study Area
Field data were collected at six research plots within the forest-tundra ecotone (FTE) of the Brooks Range, south of Chandalar Shelf and Atigun Pass on the east side of the Dalton Highway, Alaska, USA. This location is on the southern side of the Brooks Range, 100 miles north of the Arctic Circle at the northern treeline.
Data were collected during the growing seasons of 2018 and 2019 along an approximately 5.5 km long south-north transect across the FTE near the Dalton Highway, where trees are increasingly sparse and the landscape eventually transitions into treeless tundra. The FTE is underlain by continuous permafrost and consists of white spruce (Picea glauca (Moench) Voss) with sedges (e.g., Eriophorum spp.) and low-stature deciduous shrubs (e.g., Betula nana L., Alnus spp.) in the understory.
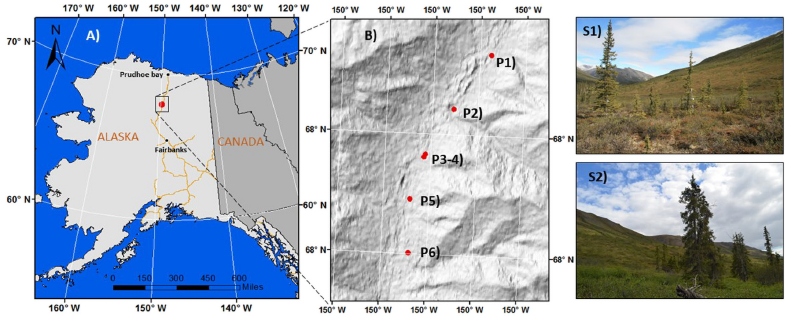
Figure 2. Map of the study area. A) Alaska; B) Hillshade map of the six study plots P1—P6; and S1-S2) Views of two study plots. The orange line represents primary and secondary roads. Red dots represent the locations of the study plots. Source: Eitel et al., 2019
Sampling Design
A stratified random sampling approach was used to collect the diameter at breast height (DBH) of trees to use as the stratification variable. Fifteen trees with DBH < 10 cm and 15 trees with DBH > 10 cm were selected across the 6 plots (Table 1). Thirty trees were selected but not all selected trees have reported measurements or measurements for both years. There are 43 tree-years of data. Trees were excluded when sensor movement (e.g., owing to active layer thaw or animal impact) was observed or foliage browsing was clearly apparent (e.g., sudden drastic shift in the dendrometer and/or PRI signal).
Radial Stem Growth of Trees
Near continuous measurements of tree stem radius were made using point dendrometers. The dendrometer is based on a linear motion, spring-loaded potentiometer (LP-10F, Midori USA). A custom-made mounting bracket held the potentiometer in a fixed position relative to the outer bark by inserting a stainless steel 6.35 mm diameter threaded rod, with 20 threads 25.4 mm-1, inserted approximately one cm into the stem. All dendrometers were installed on the north side of the tree (to minimize exposure to direct solar radiation) at a height of 1.37 m from the ground surface after removing any loose outer bark (Fig. 3). An excitation voltage was sent to the potentiometer every minute and the corresponding half-bridge return signal was recorded using a data logger (CR300, Campbell Scientific, Logan Utah, USA or EM50, Meter Group Inc, Pullman, WA 99163). Data were recorded as 20-minute averages for each dendrometer.
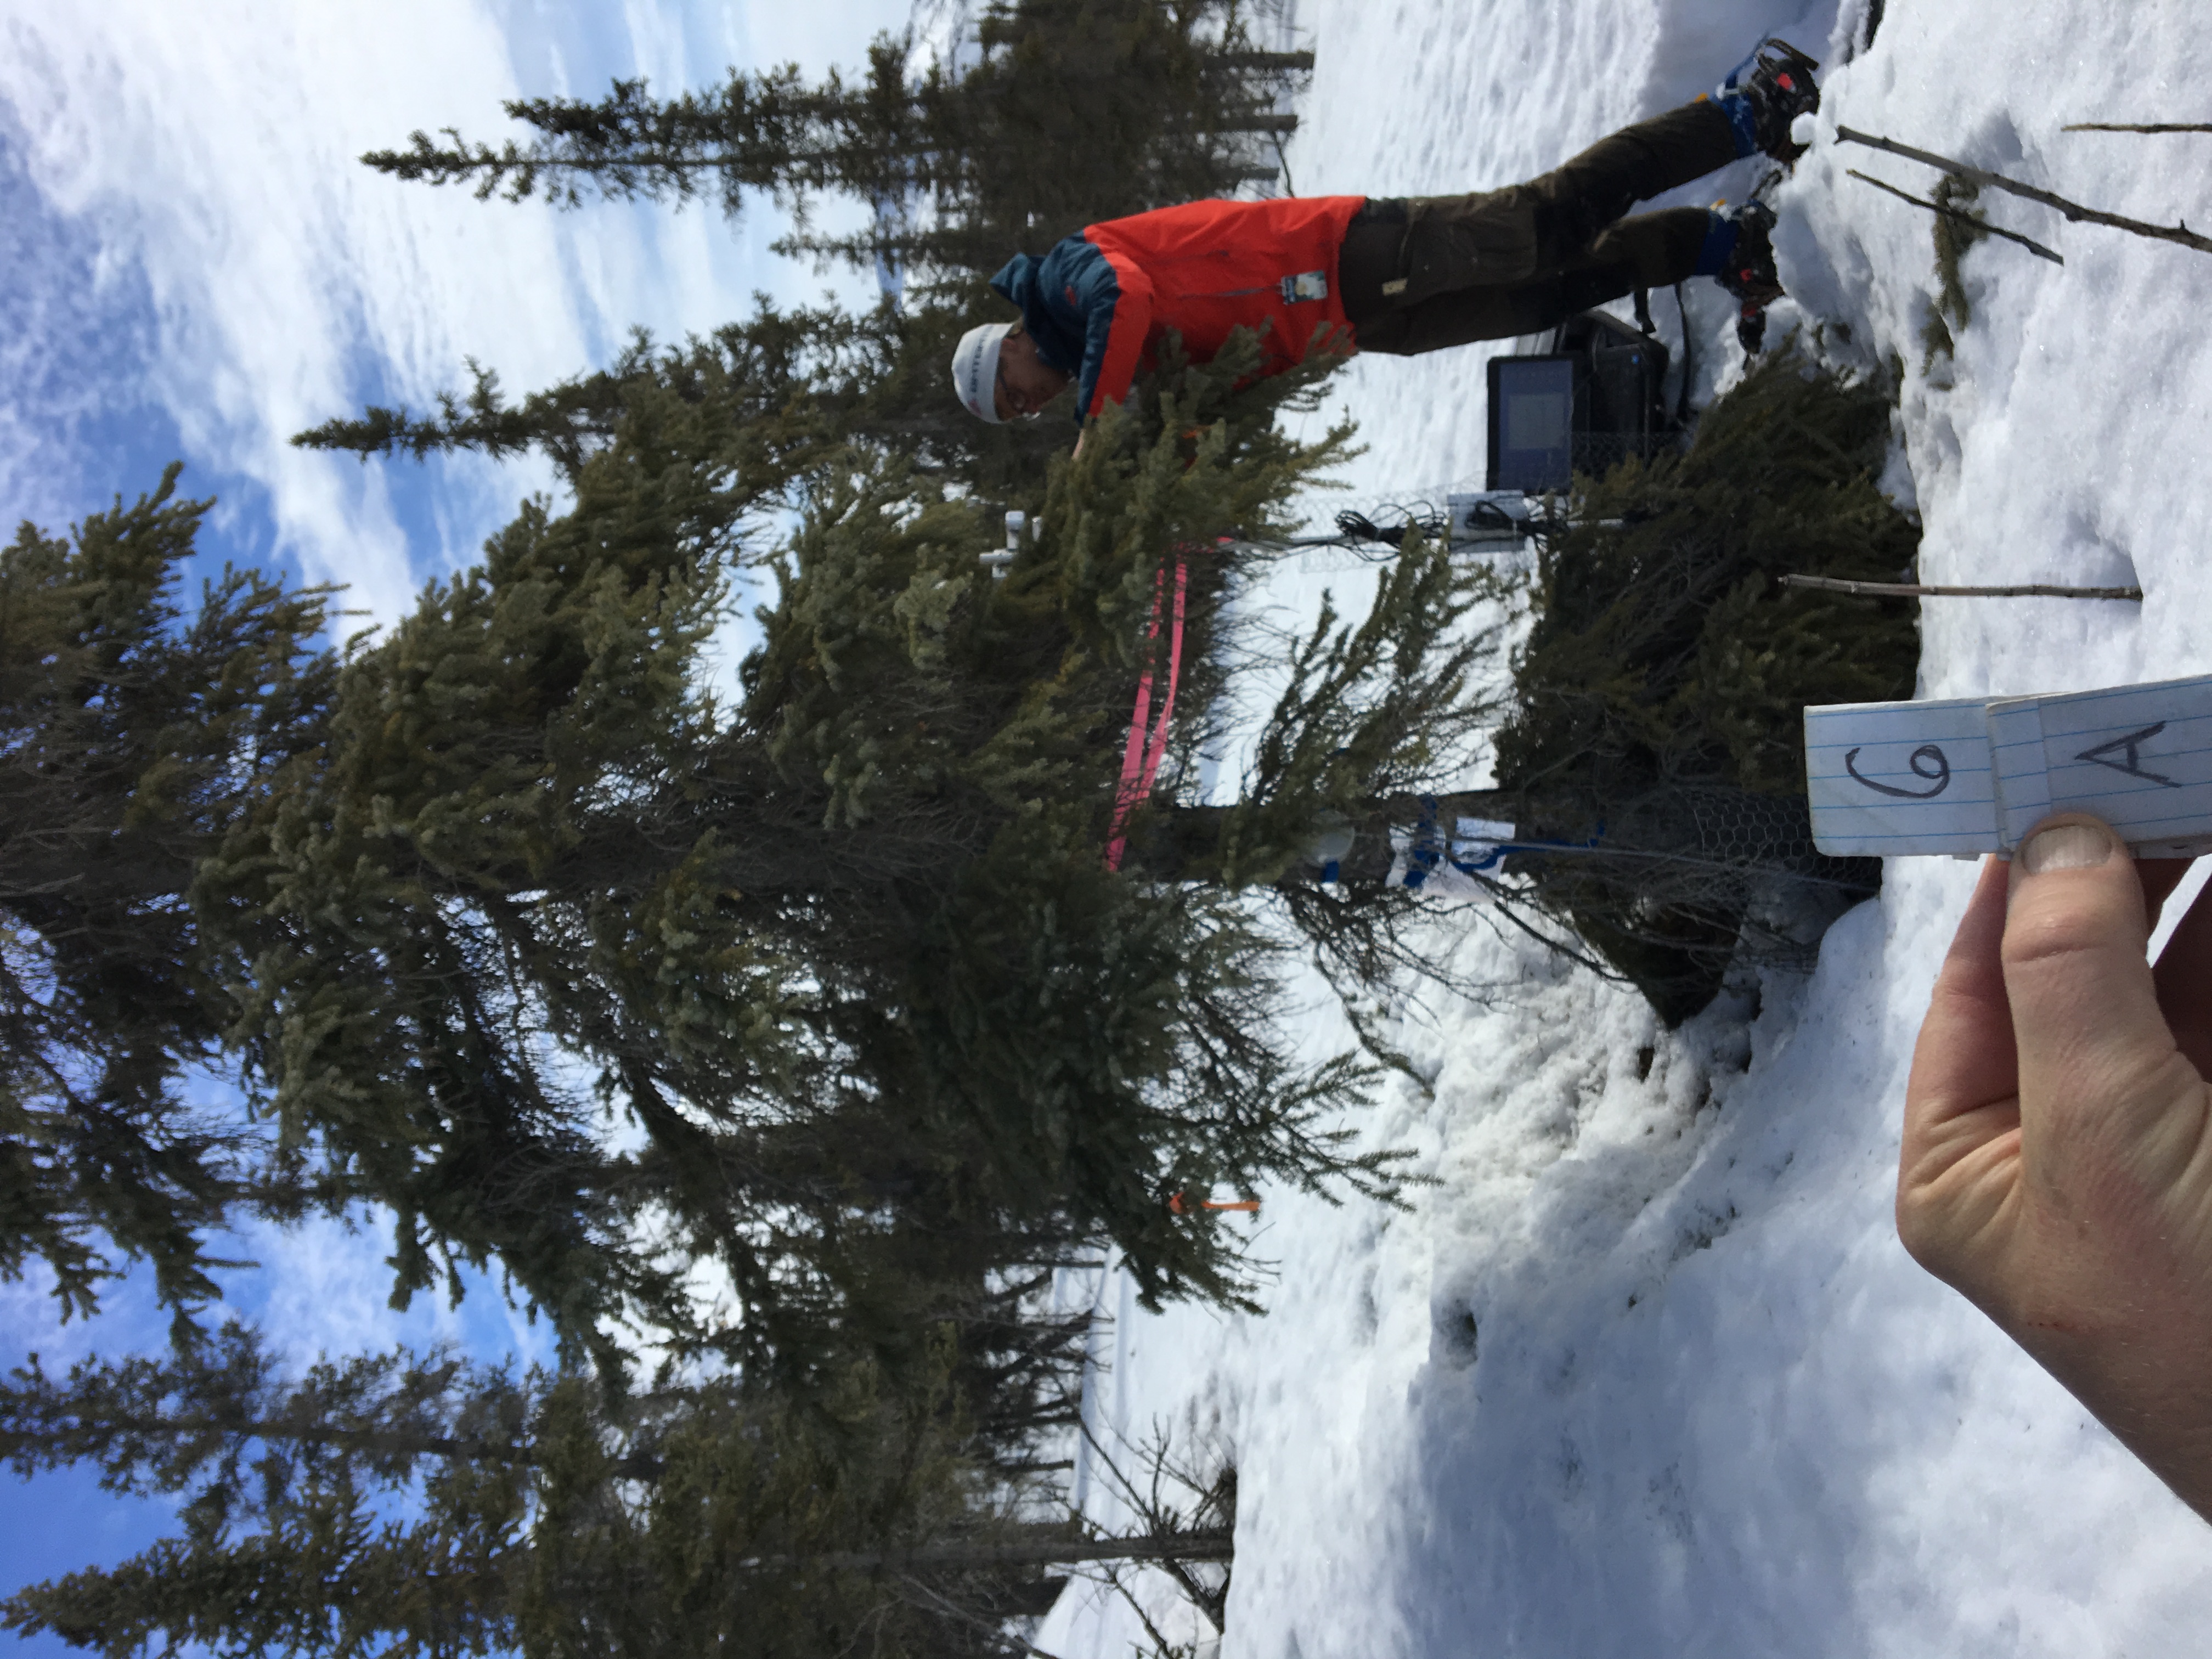
Figure 3. Photograph of tree A in plot 6 showing an installed dendrometer on the left side of trunk and positioning of the PRI instrument 1.5 m above the ground surface within the foliage. Source: companion file 6a.jpg.
In-situ PRI
Following Eitel et al., (2019), calibrated radiometers (SRS, METER Group, Inc., Pullman, WA) were mounted approximately 1.5 m above the ground on the south side of each tree while ensuring that the field of view (36°C or 0.75 m2 at 1.5 m) was dominated by the evergreen foliage (average foliage cover: 73.05 ± 8.25%) with an average distance of 0.11 m between the PRI sensors and the first foliage layer (Fig. 4). The SRS radiometers consist of an upward-facing (sky-looking view zenith angle of 180°) and a downward-facing (nadir-looking) optic. The optics are equipped with two 10 mm full-width, half-maximum bandpass filters centered at 532 nm and 570 nm enabling simultaneous quantification of both incoming and upwelling radiation and thus reflectance (outgoing/incoming) at these narrow wavelengths. To minimize cosine effects on the incoming radiation, the upward-facing PRI sensor was equipped with a Teflon diffuser. PRI measurements were collected and based on the resulting reflectance values, PRI was then calculated as:
PRI = (R532nm – R570nm)/(R532nm + R570nm)
As with the dendrometer time-series, kernel-density estimation objectively removed sporadic data-points (e.g., owing to rain on foliage and/or hemispherical sensor) along the PRI time-series that showed a kernel-density less than or equal to 20th kernel density percentile.
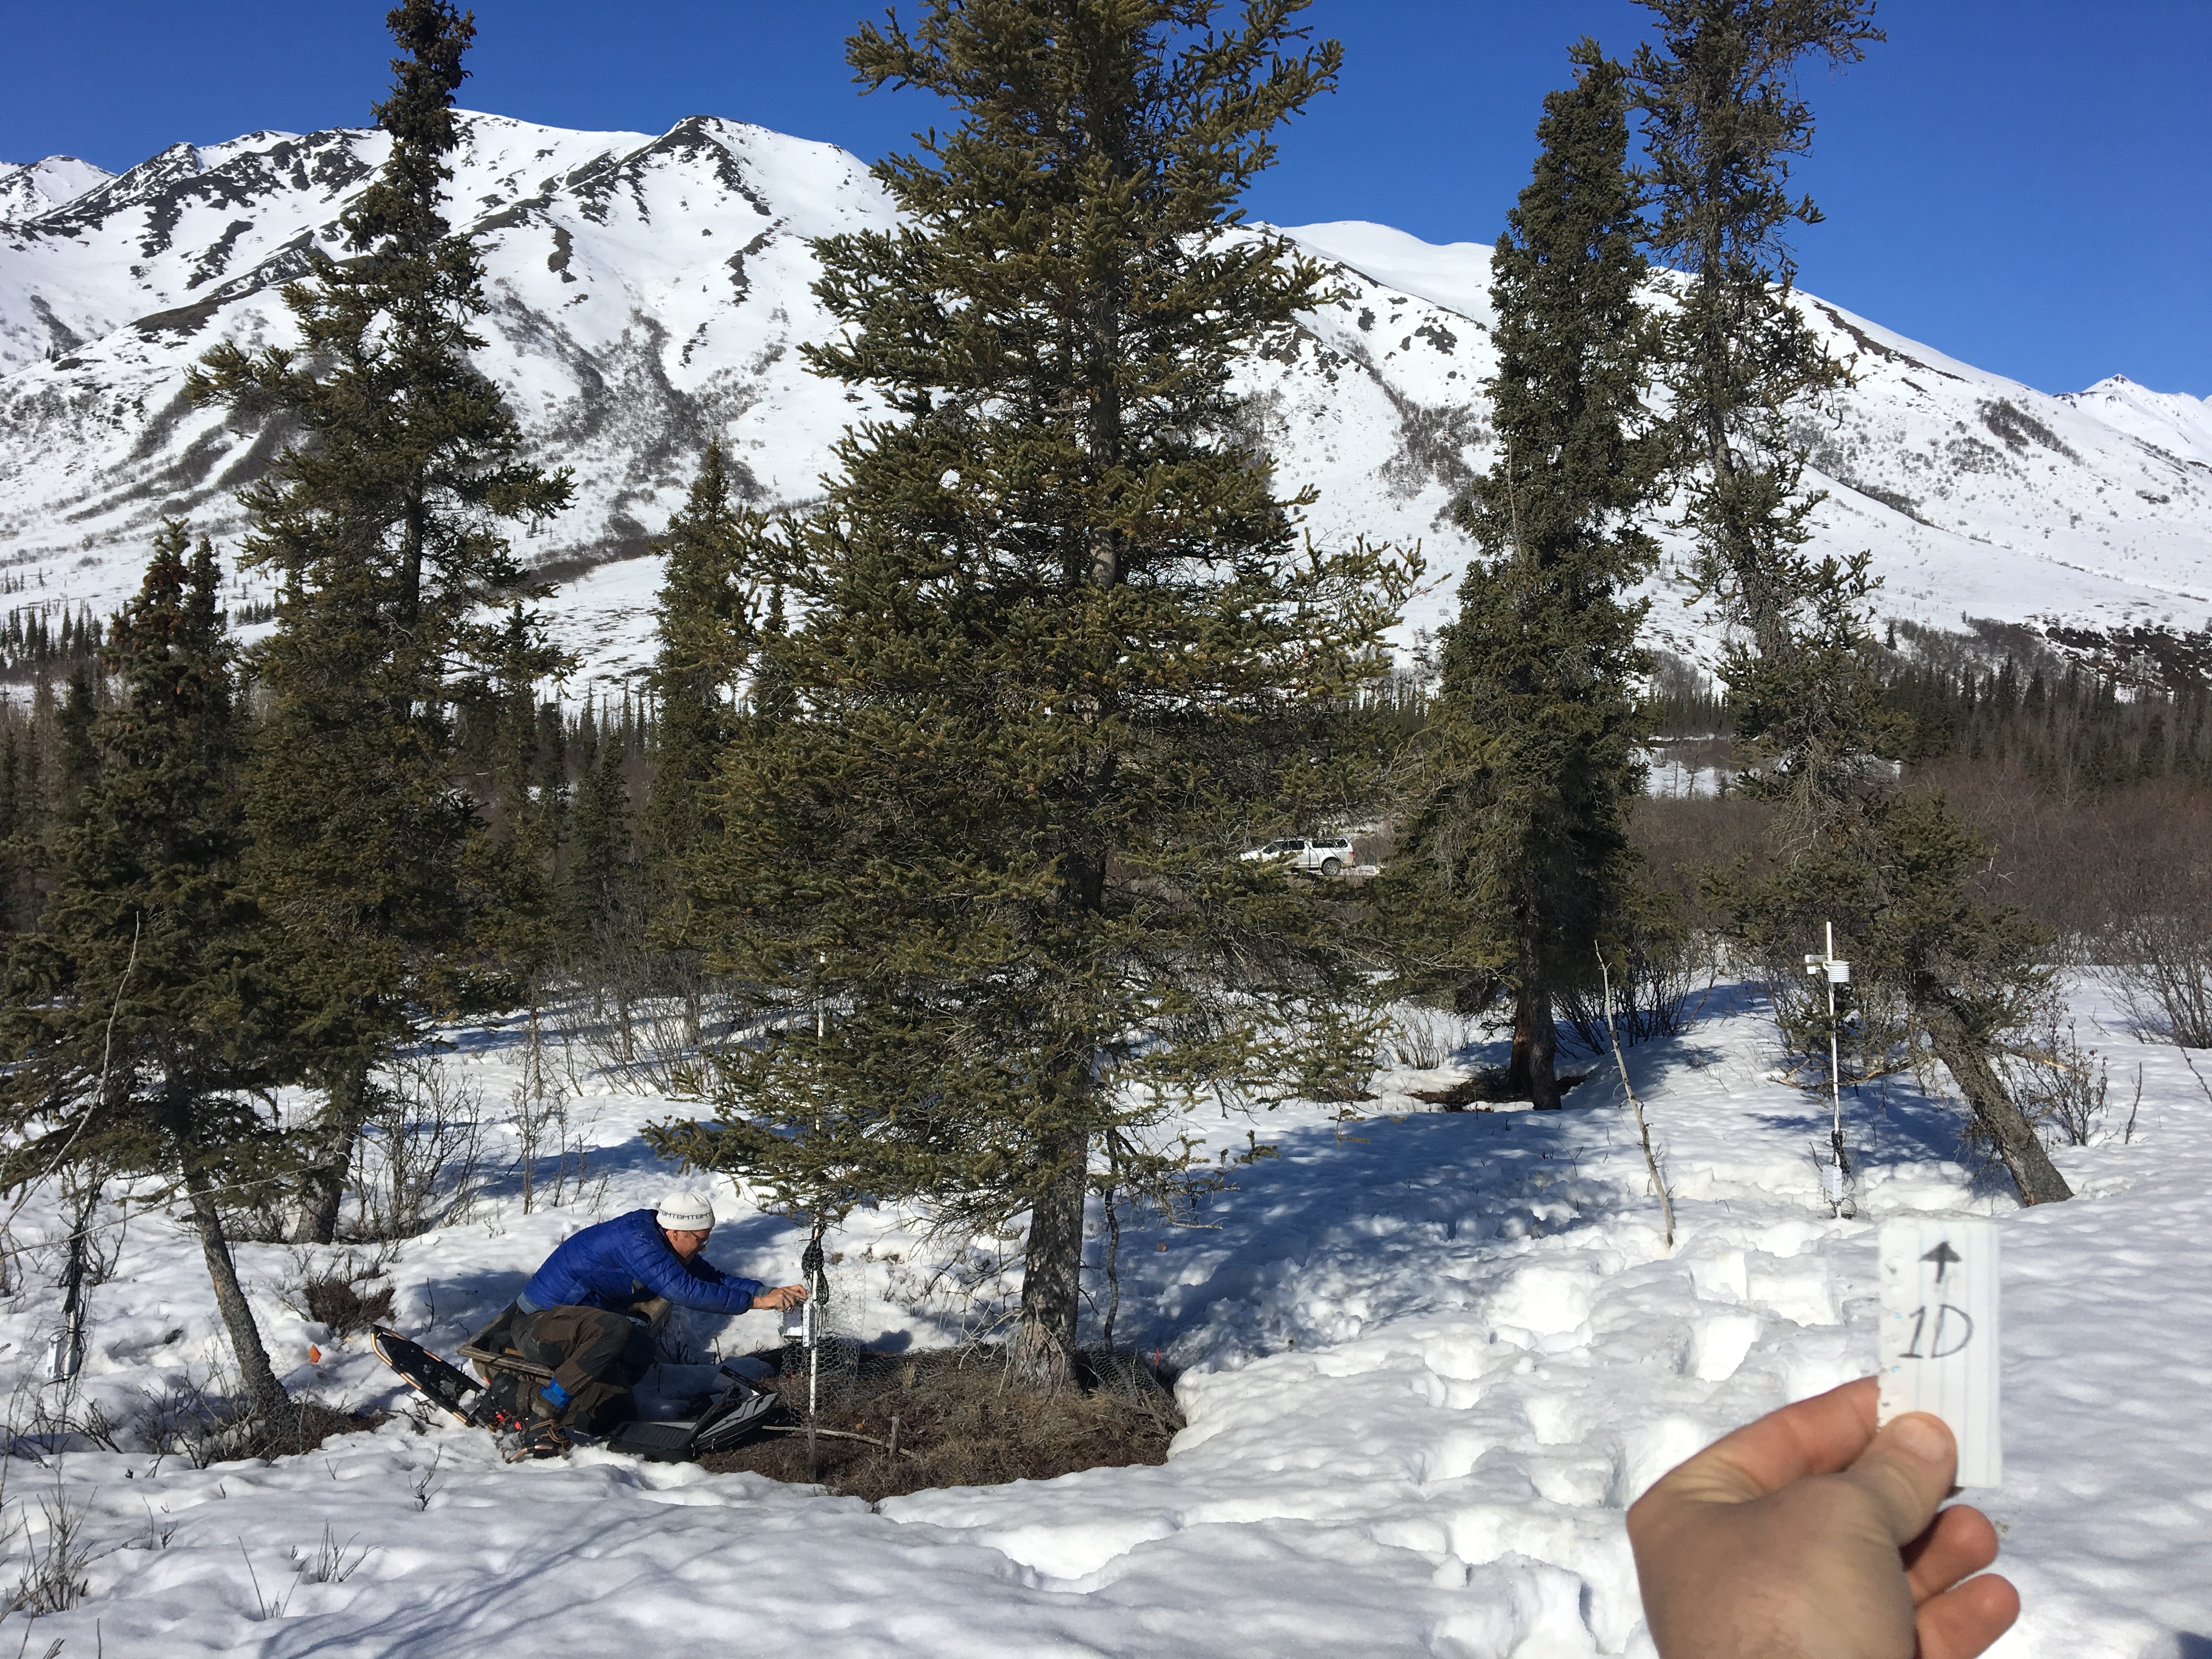
Figure 4. Photograph of tree D in plot 1 demonstrating an installed dendrometer (north side of the trunk) and PRI instrument 1.5 m above the ground surface within the foliage with southern exposure. An adjacent tree is being instrumented. The truck in the center background shows the proximity to the Dalton Highway. Source: companion file 1d.jpg.
Data Access
These data are available through the Oak Ridge National Laboratory (ORNL) Distributed Active Archive Center (DAAC).
ABoVE: Photochemical Reflectance and Tree Growth, Brooks Range, Alaska, 2018-2019
Contact for Data Center Access Information:
- E-mail: uso@daac.ornl.gov
- Telephone: +1 (865) 241-3952
References
Duong, T. 2019. ks: Kernel Smoothing. R package version 1.11.6. https://CRAN.R-project.org/package=ks
Eitel J.U.H., K.L. Griffin, N.T. Boelman, et al. 2020. Remote sensing tracks daily radial wood growth of evergreen needleleaf trees. Glob Change Biology. 26: 4068–4078. https://doi.org/10.1111/gcb.15112
Eitel, J.U.H., A.J. Maguire, N. Boelman, L.A. Vierling, K.L. Griffin, J. Jensen, T.S. Magney, P.J. Mahoney, A.J.H. Meddens, C. Silva, and O. Sonnentag. 2019. Proximal remote sensing of tree physiology at northern treeline: Do late-season changes in the photochemical reflectance index (PRI) respond to climate or photoperiod? Remote Sensing of Environment, 221:340–350. https://doi.org/10.1016/j.rse.2018.11.022
Maguire, A.J., J. Eitel, L. Vierling, N. Boelman, K. Griffin, J.S. Jennewein, and J.E. Jensen. 2020. ABoVE: Terrestrial Lidar Scanning Forest-Tundra Ecotone, Brooks Range, Alaska, 2016. ORNL DAAC, Oak Ridge, Tennessee, USA. https://doi.org/10.3334/ORNLDAAC/1782