Documentation Revision Date: 2018-12-31
Data Set Version: 1
Summary
This dataset includes three data files in *.csv format and three companion files in *.pdf format.

Figure 1. Collecting field notes at Plot 1403 in the Prudhoe Bay region of Alaska
Citation
Walker, D.A. 2018. Arctic Vegetation Plots at Prudhoe Bay, Alaska, 1973-1980. ORNL DAAC, Oak Ridge, Tennessee, USA. https://doi.org/10.3334/ORNLDAAC/1360
Table of Contents
- Data Set Overview
- Data Characteristics
- Application and Derivation
- Quality Assessment
- Data Acquisition, Materials, and Methods
- Data Access
- References
Data Set Overview
This dataset provides environmental, soil, and vegetation data collected between 1973 and 1980 from 89 study plots in the Prudhoe Bay region of Alaska. Data includes the baseline plot information for vegetation, soils, and site factors for study plots subjectively located in 43 plant communities and 4 broad habitat types across the glaciated landscape. Specific attributes include: dominant vegetation, species, and cover; soil chemistry, physical characteristics, moisture, and organic matter. This product brings together for easy reference all the available information collected from the plots that has been used for classification, mapping, and analysis of geobotanical factors in the Prudhoe Bay region and across Alaska.
The Pre-ABoVE vegetation plot datasets were curated to create the Alaska Arctic Vegetation Archive (AVA-AK; Walker et al. 2016b, Walker 2013). The AVA-AK is a regional database that is part of the larger Arctic Vegetation Archive (Walker 2016a, Walker et al. 2013, Walker and Raynolds 2011). The database contains vegetation plots from homogeneous plant communities with tables of cover or cover-abundance scores for all species and accompanying environmental site data. Field data were collected using Braun-Blanquet, US National Vegetation Classification protocols, or comparable methods.
Project: Arctic-Boreal Vulnerability Experiment (ABoVE)
The Arctic-Boreal Vulnerability Experiment (ABoVE) iis a NASA Terrestrial Ecology Program field campaign that will take place in Alaska and western Canada between 2016 and 2021. Climate change in the Arctic and Boreal region is unfolding faster than anywhere else on Earth. ABoVE seeks a better understanding of the vulnerability and resilience of ecosystems and society to this changing environment.
Acknowledgements:
These data files were edited by Donald A. Walker, Amy L. Breen and Lisa A. Druckenmiller at the University of Alaska Fairbanks' Alaska Geobotany Center and obtained via the Arctic Geoecological Atlas (http://arcticatlas.geobotany.org/), which provides access to existing Arctic vegetation plot and map data in support of the ABoVE campaign.
Data Characteristics
Spatial Coverage: Plots near Prudhoe Bay, Alaska
ABoVE Grid Location: Ah1v0Bh2v2
Spatial Resolution: Point resolution
Temporal Coverage: 19730101 - 19801231
Temporal Resolution: Each plot was sampled once
Study Area (All latitude and longitude given in decimal degrees)
|
Site |
Westernmost Longitude |
Easternmost Longitude |
Northernmost Latitude |
Southernmost Latitude |
|
Frost Boils, Alaska |
-148.9532 |
-148.2892 | 70.3779 | 70.2520 |
Data File Information: There are three data files with this dataset in comma-separated (.csv) format.
Table 1. Data files
| Data File Name | Description |
| Prudhoe_Bay_Soil_Data.csv | Soil characterization data for Prudhoe Bay research plots |
| Prudhoe_Bay_Environmental_Data.csv | Comprehensive set of environmental characterization data for Prudhoe Bay research plots including the descriptive site factors. |
| Prudhoe_Bay_Species_Data.csv | Species cover data for Prudhoe Bay research plots |
Data Descriptions: The column names, their units, and descriptions for each of the *.csv data files are listed below.
Table 2. Prudhoe_Bay_Soil_Data.csv
| Column Name | Units | Description |
| FIELD_PLOT_NUMBER | Field plot number | |
| SOIL_MOISTURE_IN_1977 | % | Percentage of water content in the soil sample |
| BULK_DENSITY_IN_1977 | g/cm3 | Bulk density of the soil sample |
| SAND | % | Percentage of sand in the soil sample |
| SILT | % | Percentage of silt in the soil sample |
| CLAY | % | Percentage of clay in the soil sample |
| FIELD_CAPACITY_AT_1/3_BAR | % | Percentage of moisture content in the soil sample at 1/3 atmosphere of pressure |
| WILTING_POINT_AT_15_BAR | % | Percentage of moisture content in the soil sample at 15 atmospheres of pressure |
| AVAILABLE_WATER | % | Percentage of available water in soil sample (FIELD_CAPACITY - WILTING_POINT) * |
| HYGROSCOPIC_MOISTURE | % | Percentage of soil moisture obtained through hygroscopic absorption |
| WATER_ABSORPTION | % | Percentage of oven-dried weight * |
| ORGANIC_MATTER | % | Percentage of organic matter in the soil sample |
| PH_PASTE_AT_10_CM | PH of the soil sample at 10-cm depth | |
| NH4_MASS_CONCENTRATION | PPM | NH4 concentration in the soil sample |
| NO3_MASS_CONCENTRATION | PPM | NO3 concentration in the soil sample |
| CO3_MASS_CONCENTRATION | % | Percentage CO3 concentration in the soil sample |
| P_MASS_CONCENTRATION | PPM | P concentration in the soil sample |
| K_MASS_CONCENTRATION | PPM | K concentration in the soil sample |
| CA_MASS_CONCENTRATION | PPM | Ca concentration in the soil sample |
| MG_MASS_CONCENTRATION | PPM | Mg concentration in the soil sample |
* See Walker (1985) for complete description of data records
Table 3. Prudhoe_Bay_Environmental_Data.csv
NOTE: Coded and scalar variables are followed by a description column (e.g. LOCATION and LOCATION_DESC). See legend companion file for complete list of coded and scalar variables and their descriptions.
| Column Name | Units | Description |
| FIELD_PLOT_NUMBER | Field plot number | |
| STAND_TYPE | Stand type * | |
| PLANT_COMMUNITY_DESCRIPTION | Primary vegetation types | |
| MICROSITE | Detailed description of microsite within the plots | |
| SOIL_MOISTURE_IN_1977 | % | Percentage of water content in the soil sample |
| BULK_DENSITY_IN_1977 | g/cm3 | Bulk density of the soil sample |
| SAND | % | Percentage of sand in the soil sample |
| SILT | % | Percentage of silt in the soil sample |
| CLAY | % | Percentage of clay in the soil sample |
| FIELD_CAPACITY_1/3_BAR | % | Percentage of moisture content in the soil sample at 1/3 atmosphere of pressure |
| WILTING_POINT_AT_15_BAR | % | Percentage of moisture content in the soil sample at 15 atmospheres of pressure |
| AVAILABLE_WATER | % | Percentage of available water in soil sample (FIELD_CAPACITY - WILTING_POINT) * |
| HYGROSCOPIC_MOISTURE | % | Percentage of soil moisture obtained through hygroscopic absorption |
| WATER_ABSORPTION | % | Percentage of oven-dried weight * |
| ORGANIC_MATTER | % | Percentage of organic matter in the soil sample |
| PH_PASTE_AT_10_CM | PH of the soil sample at 10-cm depth | |
| NH4.MASS_CONCENTRATION_AT_10_CM | PPM | NH4 concentration in the soil sample |
| NO3_MASS_CONCENTRATION_AT_10_CM | PPM | NO3 concentration in the soil sample |
| C03_MASS_CONCENTRATION_AT_10_CM | % | Percentage CO3 concentration in the soil sample |
| P_MASS_CONCENTRATION_AT_10_CM | PPM | P concentration in the soil sample |
| K_MASS_CONCENTRATION_AT_10_CM | PPM | K concentration in the soil sample |
| CA_MASS_CONCENTRATION_AT_10_CM | PPM | Ca concentration in the soil sample |
| MG_MASS_CONCENTRATION_AT_10_CM | PPM | Mg concentration in the soil sample |
| LOCATION | Plot location within Prudhoe Bay | |
| LOCATION_DESC | Description of plot location within Prudhoe Bay | |
| TEMPERATURE_REGIME | Plot temperature regime | |
| TEMPERATURE_REGIME_DESC | Description of plot temperature regime | |
| MOISTURE_REGIME | Plot moisture regime | |
| MOISTURE_REGIME_DESC | Description of plot moisture regime | |
| SNOW_REGIME | Plot snow regime | |
| SNOW_REGIME_DESC | Description of plot snow regime | |
| CRYOTURBATION_REGIME | Plot cryoturbation regime | |
| CRYOTURBATION_REGIME_DESC | Description of plot cryoturbation regime | |
| VEGETATION_TYPE | Vegetation type within the plots | |
| TOPOGRAPHIC_FEATURE | Topographic feature of the plots | |
| TOPOGRAPHIC_FEATURE_DESC | Description of the topographic feature of the plots | |
| SLOPE | Slope of the plots | |
| SLOPE_DESC | Description of slope of the plots | |
| HUMMOCK_MEAN_HEIGHT | Mean height of plot hummocks | |
| HUMMOCK_MEAN_HEIGHT_DESC | Description of mean height of plot hummocks | |
| ASPECT | Aspect of the plots | |
| SOIL_COVER | % | Percentage of soil cover of the plots |
| ROCK_COVER | % | Percentage of rock cover of the plots |
| WATER_COVER | % | Percentage of water cover of the plots |
| THAW_DEPTH_IN_1977 | CM | Thaw depth of the plots |
| WATER_DEPTH_IN_1977 | CM | Water depth of the plots |
| MARL_SURFACE_COVER | % | Percentage of marl surface cover of the plots |
| CRUSTOSE_LICHEN_COVER | % | Percentage of crustose lichen cover of the plots |
| FOLIOSE_LICHEN_COVER | % | Percentage of foliose lichen cover of the plots |
| BRYOPHYTE_COVER | % | Percentage of bryophyte cover of the plots |
| ERECT_DEAD_PLANT_COVER | % | Percentage of erect dead plant cover of the plots |
| PROSTRATE_DEAD_PLANT_COVER | % | Percentage of prostrate dead plant cover of the plots |
| PLOT_SIZE | Size of the plots | |
| PLOT_SIZE_DESC | Description of size of the plots | |
| ANIMAL_DISTURBANCE_CARIBOU_FECES | Animal activity gradient for caribou feces * | |
| ANIMAL_DISTURBANCE_CARIBOU_GRAZING | Animal activity gradient for caribou grazing * | |
| ANIMAL_DISTURBANCE_BROWN_LEMMING | Animal activity gradient for brown lemming * | |
| ANIMAL_DISTURBANCE_COLLARED_LEMMING | Animal activity gradient for collared lemming * | |
| ANIMAL_DISTURBANCE_MISCELLANEOUS_BIRD | Animal activity gradient for miscellaneous birds * | |
| ANIMAL_DISTURBANCE_FOX | Animal activity gradient for fox * | |
| ANIMAL_DISTURBANCE_PTARMIGAN | Animal activity gradient for ptarmigan * | |
| ANIMAL_DISTURBANCE_GOOSE | Animal activity gradient for goose * | |
| ANIMAL_DISTURBANCE_SQUIRREL | Animal activity gradient for squirrel * | |
| ANIMAL_DISTURBANCE_BEAR | Animal activity gradient for bear * | |
| COMMUNITY_AND_LOCATION_DESCRIPTIONS | Field notes about plant community and landscape of the plots | |
| LATITUDE | decimal degrees | Latitude of the plots |
| LONGITUDE | decimal degrees | Longitude of the plots |
| LITTER_COVER | % | Percentage of litter cover of the plots |
| SOIL_TEXTURE | Soil texture of the plots |
* See Walker (1985) for more complete description of data records
Table 4. Prudhoe_Bay_Species_Data.csv
| Column Numbers | Column Name | Units | Description |
| 1 | PASL_TAXON_SCIENTIFIC_NAME_NO_AUTHORS | Current taxonomy according to the Panarctic Species List (PASL) | |
| 2 | PASL_TAXON_SCIENTIFIC_NAME_WITH_AUTHORS | Current taxonomy according to the Panarctic Species List (PASL) including authors names | |
| 3 | DATASET_TAXON | Dataset taxonomy | |
| 4 to 92 | DATASET_PLOT_NUMBER | Column headings are all 117 plot numbers. The data values are Species Cover Classes (Braun-Blanquet cover-abundance scale): where r (rare), + (common, but less than 1 percent cover), 1 (1-5 percent), 2 (6 to 25 percent), 3 (25 to 50 percent), 4 (51 to 75 percent), 5 (76 to 100 percent). |
Companion Files: There are three companion files with this dataset in .pdf format.
Table 5. Companion files
| Companion File Name | Description |
| Prudhoe_Bay_Plot_Photos.pdf | Plot photos |
| Prudhoe_Bay_dwalker1985_Report.pdf | Summary report of all the data collected, methods of collection, maps/plots etc. for the 81 study plots at the Prudhoe Bay research site. Walker 1985 |
| Prudhoe_Bay_Env_Legend.pdf | List of coded and scalar variables and their descriptions (Prudhoe_Bay_Environmental_Data.csv) |
Application and Derivation
This dataset is important because these data were recorded 5 years after the discovery of the Prudhoe Bay Oilfield and this data includes baseline vegetation and environmental data of the Prudhoe Bay Oil Field.
Derived regional maps of these data will be used in regional models of fluxes of trace gases, water, and energy from tundra surfaces. In addition, a circumpolar vegetation classification resulting from these datasets would be highly desirable to extend the results to the entire arctic region.
Quality Assessment
No specific quality assessment information provided.
Data Acquisition, Materials, and Methods
The vegetation of the Prudhoe Bay area was described and mapped by D. A. Walker for doctoral thesis at the University of Colorado, Department of Environmental, Population and Organismic Biology (Walker 1981). The study was initiated in 1973 under the U.S. Tundra Biome portion of the International Biological Program (IBP) and is part of U.S. Army Corps of Engineers, Cold Regions Research and Engineering Laboratory (CRREL) research activities. A map of the plots is depicted in Figure 2.
Data from 89 subjectively located study plots are presented. Plots occur in 43 plant communities and 4 broad habitat categories including:
- dry tundra - including gravelly pingos, high-centered polygons, frost scars, dry river sands and gravels, sand dunes, river bluffs, coastal beaches, and early melting snowbeds (24 plots);
- moist tundra - including moist nonacidic tundra, acidic coastal tundra, snowbeds, moist stream banks, bird mounds and animal dens, and moist sandy tundra (33 plots);
- wet tundra - including wet nonacidic tundra, wet acidic tundra, and wet saline coastal tundra (22 plots); and,
- aquatic tundra - including shallow and deep water habitats (10 plots)
Plots were permanently marked in a corner of the first square meter of the 1x10-m plots, and in a corner of the 1-m2 plots. Species and environmental data (including soil physical variables, subjective site assessments, and active layer depths) were collected in the field and soil samples were brought back to the lab for the chemical assessments. Approximate GPS coordinates were obtained for all but 2 plots by the author in 2013 utilizing aerial photographs of the study area in conjunction with Google Earth.
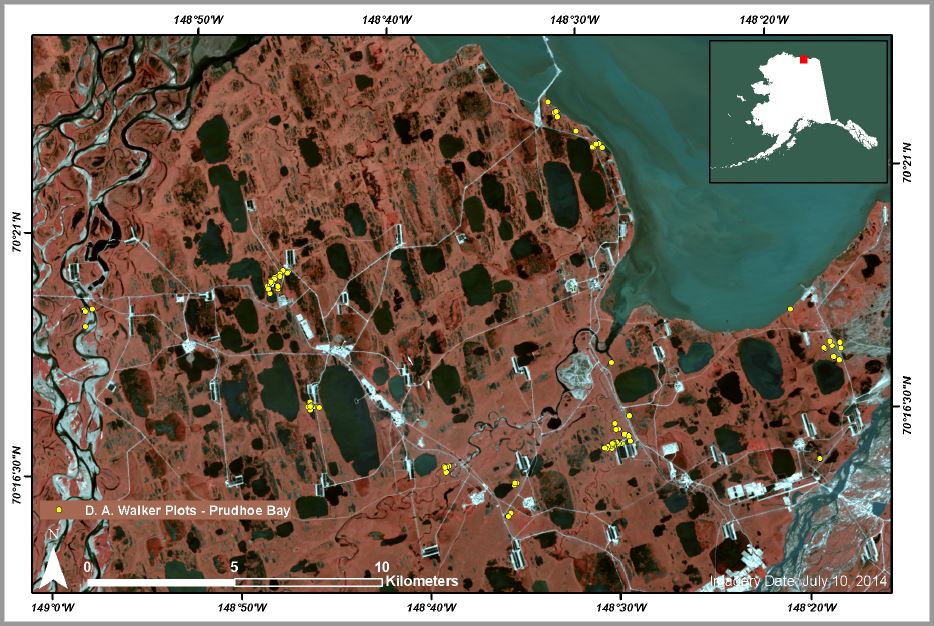
Figure 2. Aerial photograph of Prudhoe Bay region of Alaska with study plots marked in yellow.
Species Data
The source of these data is the Prudhoe Bay CRREL report 85-14 (Walker 1985). Species cover classes are by percent. Both the author's determination and the current taxonomy according to the Panarctic Species List (PASL) are listed. Taxa are listed in alphabetical order according to the accepted PASL name. In one instance, taxa were lumped into a single taxon in the PASL: Ochrolechia frigida (Ochrolechia frigida and Ochrolechia frigida thelephoroides).
Environmental Data
The source of these data is the Prudhoe Bay CRREL report 85-14 (Walker 1985). The plot numbers in the source data are the author's. The main plot numbers in the Turboveg database are accession numbers and will differ. The author's plot numbers are retained in the FIELD_RELEVE_NUMBER field in the Turboveg database.
Observations of soil moisture and pH, percentage of organic matter, soil nutrients, snow depth, hummock size, cryoturbation and animal activity were recorded for each of the plots.
Soils Data
These are the physical and chemical characteristics of the soils for the Prudhoe Bay vegetation plots from the CRREL report 85-14 (Walker 1985). Soil terminology is according to Soil Survey Staff Manual (1974; USDA).
Data Access
These data are available through the Oak Ridge National Laboratory (ORNL) Distributed Active Archive Center (DAAC).
Arctic Vegetation Plots at Prudhoe Bay, Alaska, 1973-1980
Contact for Data Center Access Information:
- E-mail: uso@daac.ornl.gov
- Telephone: +1 (865) 241-3952
References
Walker, D. A. 1981. The vegetation and environmental gradients of the Prudhoe Bay region, Alaska. Dissertation. University of Colorado, Boulder, CO, USA.
Walker, D. A. 1985. The vegetation and environmental gradients of the Prudhoe Bay region. CRREL Report No. 85-14. U.S. Army Cold Regions Research and Engineering Laboratory, Hanover, New Hampshire, USA.