Documentation Revision Date: 2018-12-31
Data Set Version: 1
Summary
Permanent vegetation and soil plots were established along two, 200-meter transects in polygon centers and troughs. Five additional vegetation plots were established outside the transects; three in heavy dust areas, and two plots in relatively undisturbed mesic tundra. Plant communities were noted in four broad habitat types including: 1) Coastal salt marsh vegetation (1 plot), 2) Dry coastal beach and sand dune vegetation (1 plot), 3) Sedge grass and dwarf shrub mire and fen vegetation (19 plots), and 4) Dry and mesic dwarf-shrub and graminoid vegetation on non-acidic substrates (10 plots).
Spine Road was constructed in 1969, and is the oldest, most heavily traveled road in the region. Compared to sites further south, this study site was unusual for its exceptionally high volumes of dust, probably due to the higher wind velocities and the contributions from numerous road sources in the Prudhoe Bay Oilfield.
There are four data files in comma-separated format (.csv) with this dataset.
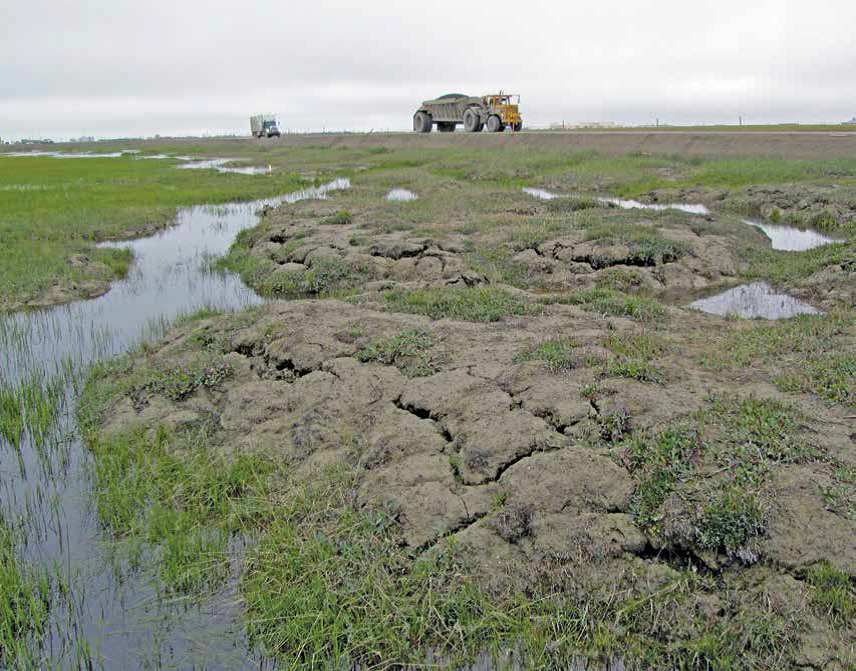
Figure 1. Study area in the vicinity of Lake Colleen off the Spine Road at Prudhoe Bay, AK. Vegetation and soil plots were established along two, 200-meter transects in polygon centers and troughs. Spine Road is the most heavily traveled road in the region. The photo captures the exceptionally high volumes of dust that accumulates along the roadside (photo from the cover of Walker et al., 2015).
Citation
Walker, D.A. 2018. Arctic Vegetation Plots, Prudhoe Bay ArcSEES Road Study, Lake Colleen, Alaska, 2014. ORNL DAAC, Oak Ridge, Tennessee, USA. https://doi.org/10.3334/ORNLDAAC/1555
Table of Contents
- Data Set Overview
- Data Characteristics
- Application and Derivation
- Quality Assessment
- Data Acquisition, Materials, and Methods
- Data Access
- References
Data Set Overview
This dataset provides environmental, soil, and vegetation data collected from study plots in the vicinity of Lake Colleen off the Spine Road at Prudhoe Bay, AK, during August of 2014. Data include vegetation species, leaf area index (LAI), percent cover classes, soil moisture and color, and plot characteristics including geology, topographic position, slope, aspect, and plot disturbance.
The study area for this dataset was the Lake Colleen region (Prudhoe Bay, Alaska) along the Spine Road, the oldest most heavily traveled road in the region. Constructed in 1969, the road is presently elevated about 1 m above the general tundra level to protect the underlying permafrost, which is more prevalent now than in 1969, and is most extensive on the southwest side. Compared to sites further south, this study area was unusual for its generally windier conditions, greater percentage of high velocity winds, and for exceptionally high volumes of dust recorded at over 100 m from the road.
Permanent vegetation and soil plots were established along the transects in the polygon centers and troughs. Five additional vegetation plots were established outside the transects, three placed in heavy dust areas within five meters of the road on the south side, and two plots placed in relatively undisturbed mesic tundra at approximately 435 m along Transect 1. Plant communities were noted in four broad habitat types. Soil temperature loggers were installed at all plots, and air and snow temperature loggers were installed along T1. A soil core was extracted for laboratory analysis. Soils were classified using the USDA Soil Taxonomy (Soil Survey Staff 1999). Peat samples were classified using the von Post scale (von Post et al.,1926). The fiber and roots were estimated following Malterer et al. (1992).
The Pre-ABoVE vegetation plot datasets were curated to create the Alaska Arctic Vegetation Archive (AVA-AK; Walker et al. 2016b, Walker 2013). The AVA-AK is a regional database that is part of the larger Arctic Vegetation Archive (Walker 2016a, Walker et al. 2013, Walker and Raynolds 2011). The database contains vegetation plots from homogeneous plant communities with tables of cover or cover-abundance scores for all species and accompanying environmental site data. Field data were collected using Braun-Blanquet, US National Vegetation Classification protocols, or comparable methods.
Project: Arctic-Boreal Vulnerability Experiment (ABoVE)
The Arctic-Boreal Vulnerability Experiment (ABoVE) iis a NASA Terrestrial Ecology Program field campaign that will take place in Alaska and western Canada between 2016 and 2021. Climate change in the Arctic and Boreal region is unfolding faster than anywhere else on Earth. ABoVE seeks a better understanding of the vulnerability and resilience of ecosystems and society to this changing environment.
Related datasets:
Walker, D.A. 2016. Pre-ABoVE: Arctic Vegetation Plots at Prudhoe Bay, Alaska, 1973-1980. ORNL DAAC, Oak Ridge, Tennessee, USA. http://dx.doi.org/10.3334/ORNLDAAC/1360
Walker, D.A., M.K. Raynolds, K. Everett, P.J. Webber, J. Brown, W. Acevedo, K.J. Ambrosius, M. Kanevskiy, Y. Shur, G. Kofinas, and V.E. Romanovsky. 2017. Pre-ABoVE: Geobotanical and Impact Map Collection for Prudhoe Bay Oilfield, Alaska. ORNL DAAC, Oak Ridge, Tennessee, USA. https://doi.org/10.3334/ORNLDAAC/1387
Acknowledgements:
The work was funded by the National Science Foundation, Arctic Science, Engineering, and Education for Sustainability (NSF, ArcSEES) Program, Award No 1233854, and the National Aeronautics and Space Administration, Land-Cover and Land-Use Change (NASA, LCLUC) Program, Award No. NNX14AD906.
These data files were edited by Donald A. Walker, Amy L. Breen and Lisa A. Druckenmiller at the University of Alaska Fairbanks' Alaska Geobotany Center and obtained via the Arctic Geoecological Atlas (http://arcticatlas.geobotany.org/), which provides access to existing Arctic vegetation plot and map data in support of the ABoVE campaign.
Data Characteristics
Spatial Coverage: Spine Road in the Lake Colleen area, Prudhoe Bay, Alaska
ABoVE Grid Locations: Ahh1Avv0Bh2Bv2
Spatial Resolution: Point resolution
Temporal Coverage: August 2014
Temporal Resolution: One-time data collection at each plot
Study Area (All latitude and longitude given in decimal degrees)
| Site | Westernmost Longitude | Easternmost Longitude | Northernmost Latitude | Southernmost Latitude |
|---|---|---|---|---|
| Lake Colleen area off the Spine Road at Prudhoe Bay | -148.474 | -148.467 | 70.22479 | 70.22136 |
Data File Information
There are four data files with this dataset in comma-separated (.csv) format. The files provide vegetation species as well as the percent ground cover occupied by the species, soil characterization, plot environmental data, and leaf area index (LAI).
There were 29 releves. Releve number indicates: 1) Transect 1 (T1) or Transect 2 (T2), 2) distance from road measured in meters, and 3) polygon center (C) or polygon trough (T). Extra plots are indicated only by the year of collection (14-2014) and a plot number.
Missing data are reported as -9999 or as not available (n/a).
Table 1. Data files
| Data File Names | Description |
|---|---|
| spine_rd_prudhoe_bay_veg_plots_environmental.csv | Environmental characterization data |
| spine_rd_prudhoe_bay_veg_plots_lai.csv | Leaf Area Index (LAI) data |
| spine_rd_prudhoe_bay_veg_plots_species.csv | Species cover data in comma separated (.csv) format. Both the author's determination and the current taxonomy according to the Panarctic Species List (PASL) |
| spine_rd_prudhoe_bay_veg_plots_soils.csv | Soil data |
Table 2. Variables in the file spine_road_prudhoe_bay_environmental.csv
These data describe the environment of the plots in the vicinity of Lake Colleen off the Spine Road at Prudhoe Bay. Refer to the companion file aava_pruarc_dwalker_2015_envlegend_anc.pdf for the ordinal scale descriptions and associated codes.
| Column number | Variable | Units/format | Description |
|---|---|---|---|
| 1 | releve_number | Releve number | |
| 2 | date | yyyymmdd | Date plot was investigated |
| 3 | latitude | decimal degrees | Plot latitude |
| 4 | longitude | decimal degrees | Plot longitude |
| 5 | elevation | m | Elevation in meters |
| 6 | slope | degrees | Slope of plot |
| 7 | aspect | degrees | Aspect-Too flat to determine |
| 8 | landform | code | Landform |
| 9 | surficial_geology | code | Surficial geology-parent material |
| 10 | surficial_geomorphology | code | Surficial geomorphology |
| 11 | glacial_geology | code | Glacial geology |
| 12 | topographic_position | scalar | Topographic position |
| 13 | soil_moisture | code | Soil moisture |
| 14 | soil_grab_samples | Number of soil grab samples taken | |
| 15 | mean_thaw_depth | cm | Mean thaw depth |
| 16 | snow_duration | scalar | Estimated snow duration (+ slightly more; - slightly less) |
| 17 | organic_layer | cm | Depth of the soil organic layer |
| 18 | microrelief | cm | Microrelief |
| 19 | lai | Leaf area index | |
| 20 | vegetation_type_and_dust | code | (CODE from Walker and Webber 1980) |
| 21 | vegetation_type | Vegetation type | |
| 22 | cover_low_shrubs | % | Percent of plot covered with low shrubs, live/standing dead |
| 23 | cover_erect_dwarf_shrubs | % | Percent of plot covered with dwarf shrubs, live/standing dead |
| 24 | cover_prostrate_ dwarf_ shrub | % | Percent of plot covered with prostrate dwarf shrubs. live/standing dead |
| 25 | cover_evergreen_shrubs | % | Percent of plot covered with evergreen shrubs, live/standing dead |
| 26 | cover_deciduous_shrubs | % | Percent of plot covered with deciduous shrubs, live/standing dead |
| 27 | cover_erect_forbs | % | Percent of plot covered with erect forbs, live/standing dead |
| 28 | cover_mat_cushion_forbs | Percent of plot covered with mat cushion forbs, live/standing dead | |
| 29 | cover_tussock_graminoids | % | Percent of plot covered with tussock graminoids, live/standing dead |
| 30 | cover_nontussock_graminoids | % | Percent of plot covered with nontussock graminoids, live/standing dead |
| 31 | cover_foliose_lichens | % | Percent of plot covered with foliose lichen, live/standing dead |
| 32 | cover_fruticose_lichen | % | Percent of plot covered with fruticose lichen, live/standing dead |
| 33 | cover_crustose_lichen | % | Percent of plot covered with crustose lichen |
| 34 | cover_pleurocarpous_bryophytes | % | Percent of plot covered with bryophytes, live/standing dead |
| 35 | cover_acrocarpous_bryophytes | % | Percent of plot covered with acrocarpous bryophytes |
| 36 | cover_horsetails | % | Percent of plot covered with horsetails |
| 37 | cover_liverworts | % | Percent of plot covered with liverworts |
| 38 | cover_algae | % | Percent of plot covered with algae |
| 39 | cover_rocks | % | Percent of plot that was bare rock |
| 40 | cover_bare_soil | % | Percent of plot that was bare soil |
| 41 | cover_water | % | Percent of plot that had water |
| 42 | water_depth | cm | Water depth |
| 43 | cover_litter | % | Percent of plot that had litter cover |
| 44 | dwarf_shrub_ht | cm | Height of dwarf shrubs |
| 45 | herbaceous_ht | cm | Height of herbaceous vegetation |
| 46 | live_moss_ht | cm | Height of live moss |
| 47 | dead_moss_depth | cm | Depth of dead moss |
| 48 | dust_thickness | cm | Dust thickness |
| 49 | disturbed | Site disturbed, yes or no | |
| 50 | disturbance_degree | code | Degree of disturbance |
| 51 | disturbance_type | code | Disturbance type |
| 52 | physical_stability | code | Plot physical stability |
| 53 | exposure | scalar | Exposure to wind and other elements |
| 54 | plot_photos | Numbered photos taken at the plots | |
| 55 | soil_photos | Numbered photos of the soils | |
| 56 | notes | ||
| 57 | observers | Field study observers: D.A. Walker and M.K. Raynolds |
Table 3. Variables in the file spine_rd_prudhoe_bay_veg_plots_species.csv
These files contain species cover data collected in 2014 for the vegetation studies. Both the author's determination and the current taxonomy according to the Panarctic Species List (PASL) are listed. Taxa are listed in alphabetical order according to the accepted PASL name.
| Column number | Column header | Description |
|---|---|---|
| 1 | PASL_taxon_scientific_name | Current nomenclature according to the Panarctic Species List (PASL) |
| 2 | PASL_taxon_scientific_name_author | Current nomenclature according to the Panarctic Species List (PASL) with the data authors name |
| 3 | dataset_taxon | Dataset taxonomy |
| 4 | field_species_code | Species code name |
| 5-38 | TURBOVEG_plot_accession_number and dataset_plot_number_author | Two rows of column headers which are plot numbers/accession numbers. The first row is TURBOVEG accession numbers. Column headers (TURBOVEG accession numbers): 12763-12791. The 2nd row is dataset_plot_number_author, the plot numbers as named in the original dataset: 1) Transect 1 (T1) or Transect 2 (T2), 2) distance from road measured in meters, and 3) polygon center (C) or polygon trough (T). Extra plots are indicated only by the year of collection (14-2014) and a plot number. Species cover classes are the old Braun-Blanquet cover-abundance scale: r= (rare) + (common, but less than 1 percent) 1 (1-5%) 2 (6-25 %) 3 (26-50%) 4 (51-75%) 5 (76-100%) |
Data note: In one instance, taxa were lumped into a single taxon in the PASL: Unknown crustose lichen (Black soil crust and White soil crust).
Table 4. Variables in the file spine_rd_prudhoe_bay_veg_plots_soils.csv
Soils were classified using the USDA Soil Taxonomy (Soil Survey Staff 1999). *Layer code: indicates if the soil samples were taken from the dust horizon (1) or organic horizon (2) immediately below the dust layer.
| Column number | Variable | Units/format | Description |
|---|---|---|---|
| 1 | releve_number | Releve number | |
| 2 | sample_number | Sample number | |
| 3 | transect_number | Transect number | |
| 4 | distance | m | Distance from road |
| 5 | layer | code | |
| 6 | soil_color_dry_hue | Dry soil color hue according to the Munsell chart | |
| 7 | soil_color_dry_value | Dry soil color value according to the Munsell chart | |
| 8 | soil_color_dry_chroma | Dry soil color chroma according to the Munsell chart | |
| 9 | soil_color_moist_hue | Moist soil color hue according to the Munsell chart | |
| 10 | soil_color_moist_value | Moist soil color value according to the Munsell chart | |
| 11 | soil_color_moist_chroma | Moist soil color chroma according to the Munsell chart | |
| 12 | gravimetric_soil_moisture | percent | Soil gravimetric moisture |
| 13 | volumetric_soil_moisture | percent | Soil volumetric moisture |
| 14 | bulk_density | g/m3 | Soil bulk density |
| 15 | pH | code | Soil pH |
| 16 | gravel | percent | Percent dry weight of soil composed of gravel |
| 17 | undecomposed_organics | percent | Percent dry weight of soil composed of undecomposed organics |
| 18 | organic_matter | percent | Percent dry weight of soil composed of organic matter |
Table 5. Variables in the data file spine_rd_prudhoe_bay_veg_plots_lai.csv
Leaf Area Index measured using an AccuPAR LP-80 PAR/LAI ceptometer. Data were not collected at the extra plots.
| Column number | Variable | Description |
|---|---|---|
| 1 | releve_number | Releve where LAI measurements were made |
| 2 | lai | Leaf area index |
Table 6. Companion files
| File names | Descriptions |
|---|---|
| aava_pruarc_dwalker_2015_envlegend_anc.pdf | Provides the codes and scalar definitions for the environmental data |
| walkerd_2015_datarpt_agc15-01_prudhoebaythermokarst.pdf | A summary report of the research at the Lake Colleen area, Spine Rd |
| pruarc_dwalker_2015_plotphotos_anc.pdf | Plot and soil photos |
| Prudhoe_Bay_ArcSEES_Veg_Plots.pdf | PDF of this guide document |
Application and Derivation
These data could be of use to climate change, environmental impacts, and environmental policy analysis.
Quality Assessment
Refer to the full study report walkerd_2015_datarpt_agc15-01_prudhoebaythermokarst.pdf provided as a companion file with this dataset.
Data Acquisition, Materials, and Methods
Site description
The study area was the Lake Colleen region (Prudhoe Bay, Alaska) along the Spine Road, the oldest most heavily traveled road in the region. The area of the study site is defined as a 60 m swath centered on two transects, T1 on the northeast side of the road and T2 on the southwest side (Walker et al., 2015). Lake Colleen is completely surrounded by roads with few culverts. Several areas between the lake and roads experience flooding during spring and summer.
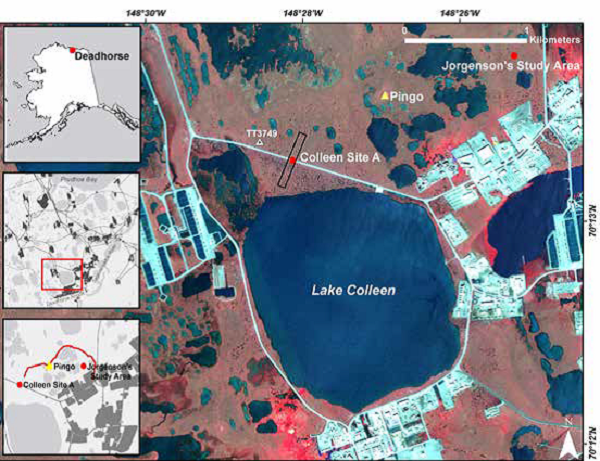
Figure 2. The Lake Colleen region. The Colleen Site A study area is located along a straight section of the road on the north side of Lake Colleen, 2.9 km north of the main Deadhorse airport. Several partially drained thaw lakes are on the east, north, and west sides of the lake. Colleen Site A and Jorgenson's study area are both on a residual surface that shows no apparent history of thaw lake processes. Note that the lake is surrounded by roads and other infrastructure. TT3749 is a benchmark that provided reference for the topographic survey. The bright red tones show areas of highly productive vegetation, mainly in drained lake basins and in areas of altered drainage near roads and gravel pads.
The Spine Road was constructed in 1969, and is presently elevated about 1 m above the general tundra level to protect the underlying permafrost, which is more prevalent now than in 1969, and is most extensive on the southwest side. Compared to sites further south, this site was unusual for its generally windier conditions, greater percentage of high velocity winds, and for exceptionally high volumes of dust recorded at over 100 m from the road. The volume of dust at 1,000 m was two to nine times greater than at the other sites, probably reflecting both the transport of dust to greater distances from the road caused by higher wind velocities and the contributions from numerous road sources in the Prudhoe Bay Oilfield. High dust volumes, earlier snow melt, warmer soil temperatures, and extensive new wetlands near the roads affect the phenology of vegetation and use of the roadside areas by wildlife (Walker et al., 2015).
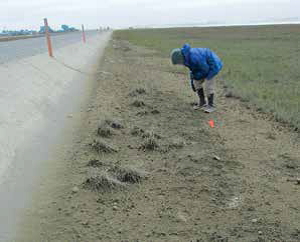
Figure 3. Heavy dust area adjacent to the southwest side of Spine Road. Up to 18 cm of dust and gravel were measured in areas 5 m from the road. This photo shows deeper accumulations within 5 m have elevated the surface creating a relatively well drained gentle slope from the foot of the road that is colonized mainly by a few coastal and dune species (photo from Walker et al., 2015).
Methods
Transects
Two 200-meter transects (Transect 1 (T1) on the northeast side of the road, and Transect 2 (T2) on the southwest side) were established through polygon centers and troughs extending through 5, 10, 25, 50, 100, and 200 meters from the road. Pin flags were placed at one-meter intervals to 100 m from the road and then at 5 m intervals to 200 m. Vertical 150 cm PVC posts were placed at 50, 100, and 200 m.
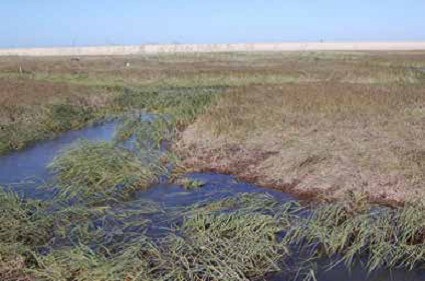
Figure 4. Transect 2, at 50 m mark, polygon trough (T2-050-T) (photo from Walker et al., 2015).
Vegetation
Permanent vegetation and soil plots were established along the transects in the polygon centers and troughs. Five additional vegetation plots were established outside the transects, three placed in heavy dust areas within five meters of the road on the south side, and two plots placed in relatively undisturbed mesic tundra at approximately 435 m along Transect 1. Plant communities were noted in four broad habitat types including: 1) Coastal salt marsh vegetation (1 plot), 2) Dry coastal beach and sand dune vegetation (1 plot), 3) Sedge grass and dwarf shrub mire and fen vegetation (19 plots), and 4) Dry and mesic dwarf-shrub and graminoid vegetation on non-acidic substrates (10 plots).
At each pin flag, thaw depth was measured with a 1 m steel thaw probe, water depth and plant canopy heights were measured with a meter stick, and LAI was measured with an AccuPAR LP-80 PAR/LAI Ceptometer. Vegetation type and microrelief were recorded at each meter. Elevations along the transect were measured using a Topcorn RTK (real-time kinematic) GPS HiPer Lite+ and robotic Topcon IS3 surveying instrument. Dust layer thickness was measured at five m intervals by removing a core of soil using a Sharpshooter shovel.
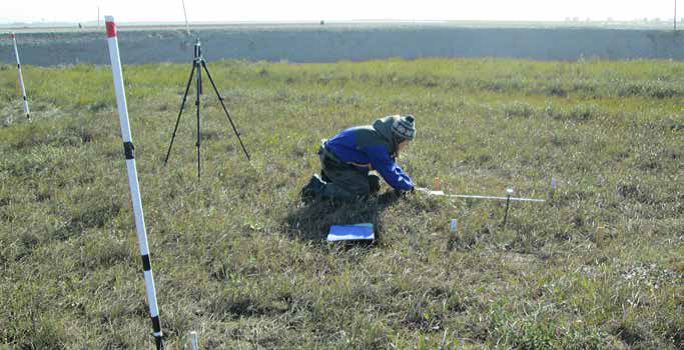
Figure 5. Measurements and instrumentation at a permanent 1 m plot. The plot is marked by short wooden stakes in the four corners and a photo point in the center of the plot with the plot number engraved on the aluminum cap that is attached to an 18-inch piece of steel rebar rod. Temperature loggers are attached to the short white stake in the foreground; the tall stake is for measuring snow depths and has temperature loggers attached to record air and snow temperature (once the logger is covered by snow). Martha Raynolds is measuring leaf-area index (LAI) (photo from Walker et al., 2015).
Soils
Soils were classified using the USDA Soil Taxonomy (Soil Survey Staff 1999). *Layer code: indicates if the soil samples were taken from the dust horizon (1) or organic horizon (2) immediately below the dust layer. Soil temperature loggers were installed at all plots, and air and snow temperature loggers were installed along T1. A soil core was extracted using a Sharpshooter shovel for laboratory analysis. Peat samples were classified using the von Post scale (von Post et al.,1926). The fiber and roots were estimated following Malterer et al. (1992).
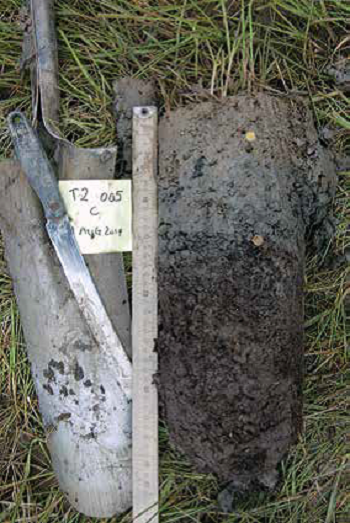
Figure 6. Soil plug from center of an ice-wedge polygon at 5 m from the road along Transect 2. Note the 13-cm thick mineral surface horizon, which is the dust layer above the original organic surface horizon (photo from Walker et al., 2015).
To determine gravimetric and volumetric soil moisture and bulk density, the soils were weighed wet then dried at 105 degrees C for 48 hours and reweighed. Gravimetric soil moisture was calculated as mass of water divided by the mass of dry soil times 100%. Volumetric soil moisture was calculated as the volume of water divided by the volume of the soil can (190 cm3) times 100%, noting that 1 cm3 of water weighs 1 g. The bulk density of the soil was calculated from the dry mass of the soil divided by the volume of the soil can and reported as g/cm3.
Dry and moist soil colors were determined in the lab after the soils were dried using a Munsell color book. To determine percentage soil organic matter, the soils were first put through a 2-mm sieve to remove gravel and undecomposed plant material. These components were weighed and reported as percent of total soil sample. Organic matter content was determined from 5-10 g samples of the < 2-mm soil component. The samples were dried to 105 degrees C, then put in a combustion oven at 550 degrees C for seven hours. Samples were reweighed after drying and after combustion, and kept in desiccators to cool to minimize moisture absorption before reweighing.
This dataset was edited and processed by Dr. Amy Breen and Lisa Druckenmiller and provided by the GINA repository at http://agc.portal.gina.alaska.edu/plot-archive/plot-datasets/28-prudhoe-bay-arcsees-road-study
Data Access
These data are available through the Oak Ridge National Laboratory (ORNL) Distributed Active Archive Center (DAAC).
Arctic Vegetation Plots, Prudhoe Bay ArcSEES Road Study, Lake Colleen, Alaska, 2014
Contact for Data Center Access Information:
- E-mail: uso@daac.ornl.gov
- Telephone: +1 (865) 241-3952
References
Malterer, T.J., E.S. Verry, and J. Erjavec. 1992. Fiber content and degrees of decomposition in peats: Review of national methods. Soil Science Society of America Journal 56 (4): 1200-1211.
Soil Survey Staff. 1999. Soil Taxonomy: A Basic System of Soil Classification for Making and Interpreting Soil Surveys. 2nd Edition. Natural Resources Conservation Service. US Department of Agriculture Handbook 436, Washington, DC.
Von Post, L., and E. Granlund. 1926. Södra Sveriges Torvtillgångar I. Sveriges Geologiska Undersokning, Yearbook, 19.2 Series C, No. 335. Stockholm, pp. 1–127.
Walker, D.A., M. Buchhorn, M. Kanevskiy, G.V. Matyshak, M.K. Raynolds, Y.L. Shur, and L.M. Wirth. 2015. Infrastructure-Thermokarst-Soil-Vegetation interactions at Lake Colleen Site A, Prudhoe Bay, Alaska. Alaska Geobotany Center Data Report AGC 15-01, 92 pp. Institute of Arctic Biology, University of Alaska Fairbanks, Fairbanks, AK.