Documentation Revision Date: 2019-11-12
Dataset Version: 1
Summary
The AirMOSS radar is a P-band (UHF) fully polarimetric synthetic aperture radar (SAR) currently operating in the 420-440 MHz band designed to measure root-zone soil moisture (RZSM) and is flown on a NASA Gulfstream-III aircraft. The L1 products were derived for each data take (acquisition) of the AirMOSS radar instrument, where one data take is one flight line over a site. There were usually four data takes performed on a visit to a site (on some occasions as few as one or as many as six were taken).
There are a total of 2616 data files included in this dataset divided into 65 directories, with one directory for each data take. Each directory contains ~40 individual data products. Note that data are provided at two resolutions, 0.5 arcseconds (about 15 meters) and 3.0 arcseconds (about 90 meters), and the resolution is denoted in each file name.
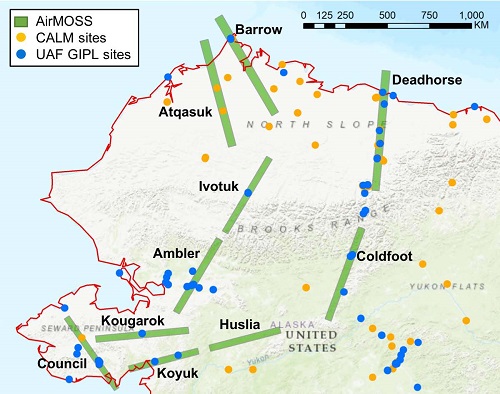
Figure 1. AirMOSS radar swaths for 10 sites over Northern Alaska. Also shown are co-located permafrost observation sites for the CALM (Circumpolar Active Layer Monitoring) and the UAF GIPL (Geophysical Institute Permafrost Laboratory, University of Alaska Fairbanks) programs. These are sites where in-situ soil moisture and temperature profile measurements were obtained and used to validate AirMOSS data products. From Chen et al. (2019).
Citation
Lou, Y., J.G. Shimada, T.R. Michel, R.J. Muellerschoen, Y. Zheng, and M. Moghaddam. 2019. Pre-ABoVE: L1 S-0 Polarimetric Data from AirMOSS P-band SAR, Alaska, 2014-2015. ORNL DAAC, Oak Ridge, Tennessee, USA. https://doi.org/10.3334/ORNLDAAC/1678
Table of Contents
- Dataset Overview
- Data Characteristics
- Application and Derivation
- Quality Assessment
- Data Acquisition, Materials, and Methods
- Data Access
- References
Dataset Overview
This data set provides level 1 (L1) polarimetric radar backscattering coefficient (sigma-0), multi-look complex, polarimetrically calibrated, and georeferenced data products from the Airborne Microwave Observatory of Subcanopy and Subsurface (AirMOSS) radar instrument collected over 10 study sites across Northern Alaska, USA. Flight campaigns took place in August 2014, October 2014, April 2015, August 2015, September 2015, and October 2015. The acquired L1 P-band radar backscatter data will be used to derive estimates of soil water content and permafrost state at the study sites.
The AirMOSS radar is a P-band (UHF) fully polarimetric synthetic aperture radar (SAR) currently operating in the 420-440 MHz band designed to measure root-zone soil moisture (RZSM) and is flown on a NASA Gulfstream-III aircraft. The L1 products were derived for each data take (acquisition) of the AirMOSS radar instrument, where one data take is one flight line over a site. There were usually four data takes performed on a visit to a site (on some occasions as few as one or as many as six were taken).
Project: Arctic-Boreal Vulnerability Experiment
The Arctic-Boreal Vulnerability Experiment (ABoVE) is a NASA Terrestrial Ecology Program field campaign based in Alaska and western Canada between 2016 and 2021. Research for ABoVE links field-based, process-level studies with geospatial data products derived from airborne and satellite sensors, providing a foundation for improving the analysis and modeling capabilities needed to understand and predict ecosystem responses and societal implications.
Information and data from other AirMOSS campaigns can be found at https://airmoss.ornl.gov.
Related Data:
Chen, R.H., A. Tabatabaeenejad, and M. Moghaddam. 2019. ABoVE: Active Layer and Soil Moisture Properties from AirMOSS P-band SAR in Alaska. ORNL DAAC, Oak Ridge, Tennessee, USA. https://doi.org/10.3334/ORNLDAAC/1657
Acknowledgements:
This work was funded by the NASA Interdisciplinary Studies Program, Grant number NNX14AO23G.
Data Characteristics
Spatial Coverage: Alaska
ABoVE Reference Locations:
Domain: Core ABoVE
State/territory: Alaska
Grid cells: Ah0v0Bh3Bv2Ch0Cv0, Ah0v0Bh4Bv2Ch0Cv0, Ah0v0Bh5Bv2Ch0Cv0, Ah0v0Bh4Bv1Ch0Cv0, Ah0v0Bh3Bv1Ch0Cv0, Ah0v0Bh4Bv3Ch0Cv0, Ah0v0Bh5Bv3Ch0Cv0, Ah1v0Bh6Bv2Ch0Cv0, Ah1v0Bh7Bv2Ch0Cv0, Ah1v0Bh8Bv2Ch0Cv0, Ah1v0Bh9Bv2Ch0Cv0, Ah1v0Bh7Bv1Ch0Cv0, Ah1v0Bh8Bv1Ch0Cv0, Ah1v0Bh7Bv3Ch0Cv0, Ah1v0Bh8Bv3Ch0Cv0, Ah1v0Bh6Bv4Ch0Cv0, Ah1v0Bh7Bv4Ch0Cv0
Spatial Resolution: Data are provided at two different resolutions: 0.5 arcseconds (about 15 meters) and 3.0 arcseconds (about 90 meters).
Temporal Coverage: Periodic flights occurred over Alaska from August 2014 - October 2015.
Temporal Resolution: Each flight campaign represents a single day.
Study Area (coordinates in decimal degrees)
| Site | Westernmost Longitude | Easternmost Longitude | Northernmost Latitude | Southernmost Latitude |
|---|---|---|---|---|
| Alaska | -165.31576 | -135.54465 | 71.48243 | 57.22465 |
Table 1. Study Site Summary. Coordinates represent the approximate boundaries of all flights over the site. See Figure 1 for a map.
| Study Site | Site Abbreviation | Sampled in 2014 | Sampled in 2015 | North Latitude | South Latitude | East Longitude | West Longitude |
|---|---|---|---|---|---|---|---|
| Ambler (Brooks Range Foothills, south) | ambler | X | X | 66.7 | 66.4 | -161 | -161.6 |
| Atqasuk (North Slope) | atqasu | X | X | 70.3 | 70 | -159.8 | -160.4 |
| Barrow (North Slope) | barrow | X | X | 70.9 | 70.6 | -158.2 | -158.9 |
| Coldfoot (Brooks Range Foothills, south) | coldfo | - | X | 66.9 | 66.7 | -152.8 | -153.4 |
| Council (Seward Peninsula) | council/seward | X | X | 65 | 64.8 | -166.2 | -166.7 |
| Deadhorse (North Slope) | dhorse | X | X | 69.8 | 69.5 | -151 | -151.6 |
| Huslia (Interior Alaska) | huslia | - | X | 65.6 | 65.4 | -156.7 | -157.2 |
| Ivotuk (Brooks Range Foothills, north) | ivotuk | X | X | 68.5 | 68.2 | -157.9 | -158.5 |
| Kougarok (Seward Peninsula) | kougar | X | X | 65.7 | 65.4 | -163.7 | -164.2 |
| Koyuk (Interior Alaska) | koyukk | X | X | 65.1 | 64.8 | -162.4 | -162.9 |
Data File Information
There are a total of 2616 data files included in this dataset, divided into 65 directories, with one directory for each data take. Each directory contains ~40 individual data products. Note that data are provided at two resolutions, 0.5 arcseconds (about 15 meters) and 3.0 arcseconds (about 90 meters), and the resolution is denoted in each file name.
Naming Conventions – see Name Element Table (Table 2) below for definitions of specific elements.
Directories
The directory names follow this convention:
ssssss_LLLLL_FFFFF_CCC_YYMMDD_PL090fffww_XX_01
Example directory names:
permaf_34505_15142_008_151001_PL09043020_XX_01
alaska_3502L_15141_002_150930_PL09043020_XX_01
File Names
File names for types (.ann, .h5, hgt, .inc, .jpg, .kmz, .png, and .slope) follow this convention. See File Extension Table (Table 4) below. All elements are the same as the directory, except for the addition of “_gg” for spatial resolution.
ssssss_LLLLL_FFFFF_CCC_YYMMDD_PL090fffww_gg_XX_vv.ext
Example file name: alaska_13047_15123_005_150828_PL09043020_05_XX_01.ann
File names of the multi-looked complex cross products (.mcl) and georeferenced data files (.grd) follow this convention. See File Extension Table (Table 4) below. All elements are the same as file name above, except for the addition of pppp, a 4-character abbreviation for the cross product.
ssssss_LLLLL_FFFFF_CCC_YYMMDD_PL090fffww_ggpppp_XX_vv.ext
Example file name: alaska_13047_15123_005_150828_PL09043020_05HVVV_XX_01.mlc
Table 2. Name Element Definitions for directory and file naming conventions.
| Name Element | Short Name | Example Values | Short Description | AirMOSS Description |
|---|---|---|---|---|
| ssssss | Site name | alaska | The Alaskan AirMOSS sites (alaska or permaf) | 6-character sitename assigned to the site where data was acquired. All files are either permf or alaska |
| LLLLL | Flight line ID | 34505 | Flight line is based on aircraft orientation. There may be multiple flights on different dates that followed the same flight line. | 5-character flight line ID, where the first 3 characters are the aircraft heading in integer degrees, range 000-359; and the last 2 characters are an alphanumeric counter chosen to ensure uniqueness of the flight line ID. |
| FFFFF | Flight ID | 15124 | The first 2 digits are the last 2 digits of the year and the next 3 digits are a numeric counter. | 5-digit flight ID, where the first 2 digits are the last 2 digits of the year of the AirMOSS flight and the next 3 digits a numeric counter chosen to ensure uniqueness of the flight ID. |
| CCC | Data take counter | 8 | Data take counter for this flight | 3-digit data take counter for this flight. The allowed characters for this field are digits 0-9. A first digit of 0 indicates that the data take was collected in automatic mode, while a first digit of 1 indicates that it was collected in manual mode. Usually, the data take counter starts at 000 for the first science data take of a flight and increments by 1 for each successive science data take. Since the radar system may reinitialize the counter if a system reset occurs during flight, the data take counter may not be unique for a flight. |
| YYMMDD | Flight date | 151001 | UTC date at start of flight (yymmdd) | UTC date at the start of the data take, with YY being the last two digits of the year, MM the month of the year (01-12), and DD the day of the month (01-31) |
| PL090fffww | Radar codes | PL09043020 | Radar codes are the same for all directories and files. | See Radar Naming Convention Table (Table 3) below for specific elements |
| gg | Spatial resolution | 30 | Grid spatial resolution | 2-digit grid spacing in integer units of 0.1 arcseconds ("). The allowed values are 05 for 0.5" and 30 for 3.0". |
| pppp | Cross product abbreviation | HHHV | 4-character abbreviation for the cross product. | The abbreviation is formed from the subscripts of the two factors of each cross product read from left to right. For example, the abbreviation for the second cross product, SHHS'*HV, is HHHV. The allowed values for this field are thus HHHH, HHHV, HHVV, HVHV, HVVV, and VVVV. |
| XX | Crosstalk removal status | XX | Crosstalk removal status | 2-character crosstalk removal status. The allowed values are CX when crosstalk has been removed and XX when crosstalk has not been removed. All standard AirMOSS science data products have this field set to XX. |
| vv | Version number | 1 | Incremental version number | 2-digit product version number starting at 01. The version number is incremented by 1 when a product is redelivered. |
Table 3. Radar Code Naming Conventions. Radar codes are the same for all directories and files and follow this convention: _PL090fffww_ . Example value: PL09043020
| Name Element | Short Name | Example Values | AirMOSS Description |
|---|---|---|---|
| P | Radar band | P | Radar band, 1 character; fixed value of P for P-band for AirMOSS |
| L | Left looking radar | L | 1 character indicating whether radar is Left-looking or Right-looking relative to direction of flight; fixed value of L for AirMOSS. |
| 90 | Squint angle | 90 | Squint angle in integer degrees; fixed value of 090 for AirMOSS |
| fff | Chirp frequency | 430 | 3-digit chirp center frequency in integer MHz, with allowed values in (280, 440). All standard AirMOSS science data products have this field set to 430. |
| ww | Chirp bandwidth | 20 | 2-digit chirp bandwidth in integer MHz, with allowed values in [06, 80]. All standard AirMOSS science data products have this field set to 20. |
Table 4. List of data product files (file extensions) in each directory. See Section 5 below for details.
| File extension | Number of files per flight data take directory | Description |
|---|---|---|
| .ann | 2 files, one for the 0.5 arcsecond grid spacing and one for 3.0 arcsecond. | Annotation files contain metadata for this product, including filenames, file dimensions, grid coordinates, and radar processing parameters. |
| .grd | 12 files, 6 for the 0.5 arcsecond grid spacing and 6 for 3.0 arcsecond. | Georeferenced data (GRD) files are generated by projecting the (slant range) SLC data to ground range using the backward projection method. |
| .h5 | 2 files, one for the 0.5 arcsecond grid spacing and one for 3.0 arcsecond. | The HDF5 files contain copies of the ground-range product layers described above, specifically the Georeferenced data (.grd), Digital Elevation Map (.hgt), Terrain slope (.slope), and Incidence angle (.inc). |
| .hgt | 2 files, one for the 0.5 arcsecond grid spacing and one for 3.0 arcsecond. | Digital elevation map files contain the terrain height values that were used to produce the GRD data in the same geographic coordinates as those files. |
| .inc | 2 files, one for the 0.5 arcsecond grid spacing and one for 3.0 arcsecond. | The incidence angle files contain the local incidence angle at each point in the GRD files. |
| .jpg | 2 files, one for the 0.5 arcsecond grid spacing and one for 3.0 arcsecond. | Browse thumbnails in .jpg format produced from the .png files. |
| .kmz | 2 files, one for the 0.5 arcsecond grid spacing and one for 3.0 arcsecond. | The KMZ files contain the GRD data rendered as color images. The KMZ files are compressed Keyhole Markup Language files for display in Google Earth. |
| .mlc | 12 files, 6 for the 0.5 arcsecond grid spacing and 6 for 3.0 arcsecond. | Multi-looked complex (MLC) cross products. |
| .png | 2 files, one for the 0.5 arcsecond grid spacing and one for 3.0 arcsecond. | The PNG files contain the images from the KMZ files in PNG file format. |
| .slope | 2 files, one for the 0.5 arcsecond grid spacing and one for 3.0 arcsecond. | The terrain slope files contain the derivatives of the DEM files in the East and North direction. |
Application and Derivation
The Level 1 Sigma-0 data generated by the AirMOSS radar instrument were used to generate other, higher-level, data products.
Quality Assessment
These Level 1 data are provided with no QA information. Extensive quality checks were performed on the higher-level products derived from this data.
Data Acquisition, Materials, and Methods
The AirMOSS aircraft carried an ultra-high frequency synthetic aperture radar that has the capability to penetrate through substantial vegetation canopies and soil to depths down to approximately 1.2 meters (see https://airmoss.ornl.gov/documentation.html). A Level-1 S0 (“sigma-0”) polarimetric product consists of the following set of files that are generated from a single data take (data collection or acquisition) of the AirMOSS radar instrument. Several of the file descriptions below specify dependencies upon the number of chirp waveforms used for a data take. While the AirMOSS radar is capable of using one, two, or three chirp waveforms during a single data take, all AirMOSS data takes that were acquired for standard science data processing were collected using a single chirp waveform having a center frequency of 430 MHz and a (10-dB) bandwidth of 20 MHz.
Many of the AirMOSS Level-1 S0 product layers are the same as the ones produced for the L-band UAVSAR airborne radar polarimetric products. Much of the material in this section has been adapted from the online UAVSAR product documentation at: http://uavsar.jpl.nasa.gov/science/documents/polsar-format.html.
1. Annotation Files
The annotation files contain the metadata for this product, including filenames, file dimensions, grid coordinates, and radar processing parameters. The annotation files do not conform to any of the standard metadata file formats but use a simple "keyword = value" ASCII text file format, with a maximum of one keyword per line. Each line is terminated by a carriage return (newline). Unit specifications, if present, are placed within a single pair of parentheses to the left of the equals sign. At least one space should separate the right parenthesis of the unit specification and the equals sign.
Most of the Level-1 S0 product layers are output at grid spacings of 0.5" (arcseconds, about 15 meters) and 3.0" (about 90 meters). Two annotation files are generated for each chirp waveform used during the data take, one for the 0.5" files and the other for the 3.0" files.
2. Single-Look Complex (SLC) Data
Because of the large data volume and low demand for this layer, the SLC data is not provided here.
3. Multi-Looked Complex (MLC) Cross Products
The multi-looked complex (MLC) cross products are generated by first calculating the following six cross products from each set of four SLC files:
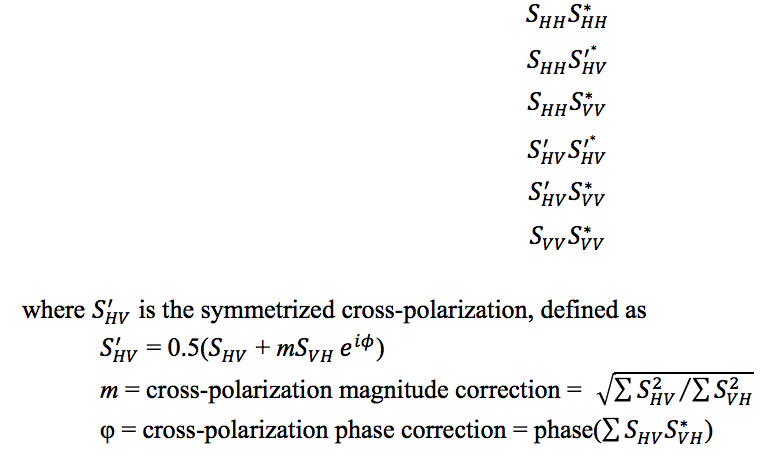
and where each summation has been performed over all samples in the respective SLC file(s).
Each cross product is then multi-looked (averaged) in both the range and the azimuth dimensions. The cross products are output at grid spacings of approximately 0.5" and 3.0", with separate files written for each combination of cross product and grid spacing. Twelve MLC files are thus produced for each chirp waveform used during the data take.
Each MLC file is a pure binary file with a fixed record length, no header or trailer records, and no prefix or suffix data within each record. The six files produced for a given chirp waveform and grid spacing have the same record length. For the SHHS*HH, S'HVS'*HV, and SVVS*VV cross products, each sample within a record is a 4-byte real single-precision floating-point number with little-endian byte ordering and units of linear, not dB, radar power. For the SHHS'*HV, SHHS*VV, and S'HVS*VV cross products, each sample within a record is an 8-byte complex single-precision floating-point number with little-endian byte ordering and units of linear, not dB, radar power. The projection of the data is the natural slant range projection. Samples within a record are ordered by increasing range. Records are ordered by increasing azimuth.
The following keywords in the annotation file can be used to determine the geographic location of the MLC files:
set_plat Peg latitude
set_plon Peg longitude
set_phdg Peg heading
mlc_mag.row_addr Along-track offset to upper left pixel
mlc_mag.col_addr Cross-track offset to upper left pixel
The following keywords in the annotation file give the number of looks used to generate the MLC files:
Number of Range Looks in MLC
Number of Azimuth Looks in MLC
4. Georeferenced Data (GRD)
The georeferenced data (GRD) files are generated by projecting the (slant range) SLC data to ground range using the backward projection method. An equiangular grid is defined with latitude and longitude boundaries that cover the entire slant range image. For each point on the ground range grid, the corresponding location is calculated within the SLC image. The data value closest to this location is assigned to the point on the ground range grid. One GRD file is produced for each of the six cross product formats defined for the MLC files.
Each GRD file has the same sample data type (complex or real) as that of the corresponding MLC cross product. Each sample has units of linear, not dB, radar power. Samples within a record are ordered by increasing longitude (i.e., west to east). Records within a file are ordered by descending latitude (i.e., north to south).
The following keywords in the annotation file can be used to determine the geographic location of the GRD files:
grd_mag.set_rows Number of records in GRD file
grd_mag.set_cols Number of samples per record
grd_mag.row_mult GRD Latitude Pixel Spacing
grd_mag.col_mult GRD Longitude Pixel Spacing
grd_mag.row_addr Center Latitude of Upper Left Pixel of Image
grd_mag.col_addr Center Longitude of Upper Left Pixel of Image
5. Digital Elevation Map (DEM)
The Digital Elevation Map (DEM) files contain the terrain height values that were used to produce the GRD data in the same geographic coordinates as those files. Two DEM files are generated for each chirp waveform used during the data take, one at 0.5" grid spacing and the other at 3.0" grid spacing. Each sample within a file is a 4-byte real single-precision floating-point number with little-endian byte ordering and units of meters. Each DEM file is co-registered to the GRD files having the same grid spacing.
The following keywords in the annotation file provide information about the source DEM used for processing:
DEM Used in Ground Projection
DEM Datum
DEM Source
DEM Original Pixel Spacing
6. Terrain Slope
The terrain slope files contain the derivatives of the DEM files in the East and North direction. Two terrain slope files are generated for each chirp waveform used during the data take, one at 0.5" grid spacing and the other at 3.0" grid spacing. Each sample within a file consists of two values, the first of which is the terrain slope in the east direction and the second value the slope in the north direction. Each slope value is a unitless 4-byte real single-precision floating-point number with little-endian byte ordering. Each terrain slope file is co-registered to the GRD files having the same grid spacing.
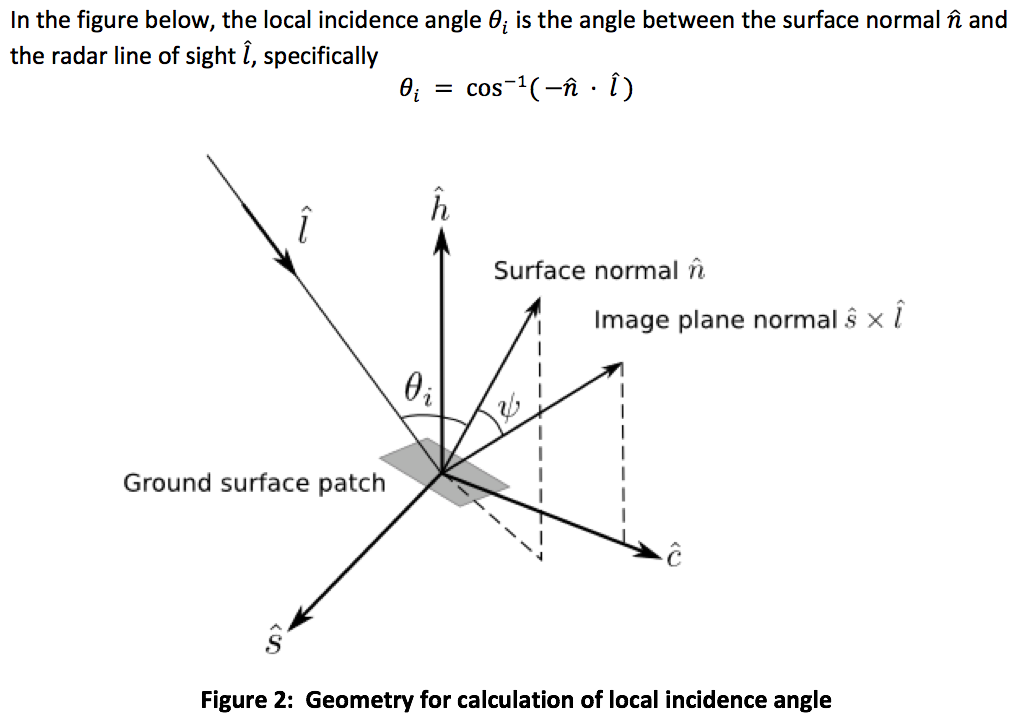
7. Incidence Angle
The incidence angle files contain the local incidence angle at each point in the GRD files.
Two incidence angle files are generated for each chirp waveform used during the data take, one at 0.5" grid spacing and the other at 3.0" grid spacing. Each sample is a 4-byte real single-precision floating-point number with little-endian byte ordering and units of radians. Each incidence angle file is co-registered to the GRD files having the same grid spacing.
8. KMZ Files
The KMZ files contain the GRD data rendered as color images. The KMZ files are compressed Keyhole Markup Language files. These files can be displayed in Google Earth. The images use the following color mappings:
Red = SHHS*HH
Green = SHVS*HV
Blue = SVVS*VV
Note that the color scaling of an image depends upon the dynamic range of the particular source dataset; no absolute color scale exists for the KMZ imagery.
Two KMZ files are generated for each chirp waveform used during the data take, one at 0.5" grid spacing and the other at 3.0" grid spacing.
9. PNG Files
The PNG files contain the images from the KMZ files in PNG file format. Two PNG files are generated for each chirp waveform used during the data take, one at 0.5" grid spacing and the other at 3.0" grid spacing.
10. HDF5 Files
The HDF5 files contain copies of the ground-range product layers described above, specifically the Georeferenced data, Digital Elevation Map, Terrain slope, and Incidence angle.
Two HDF5 files are generated for each chirp waveform used during the data take, one containing the 0.5" grid spacing files and the other the 3.0" grid spacing files.
Data Access
These data are available through the Oak Ridge National Laboratory (ORNL) Distributed Active Archive Center (DAAC).
Pre-ABoVE: L1 S-0 Polarimetric Data from AirMOSS P-band SAR, Alaska, 2014-2015
Contact for Data Center Access Information:
- E-mail: uso@daac.ornl.gov
- Telephone: +1 (865) 241-3952
References
Chapin, E, A. Chau, J. Chen, B. Heavey, S. Hensley, Y. Lou, R. Machuzak, and M. Moghaddam. 2012. AirMOSS: An Airborne P-band SAR to measure root-zone soil moisture, 2012 IEEE Radar Conference, Atlanta, GA, 2012, pp. 0693-0698. https://doi.org/10.1109/RADAR.2012.6212227
Chen, R.H., Tabatabaeenejad, A., & Moghaddam, M. (2018). P-Band Radar Retrieval of Permafrost Active Layer Properties: Time-Series Approach and Validation with In-Situ Observations. IGARSS 2018 - 2018 IEEE International Geoscience and Remote Sensing Symposium, 6777-6779. https://doi.org/10.1109/igarss.2018.8518179
Chen, R.H., A. Tabatabaeenejad, and M. Moghaddam. 2019. ABoVE: Active Layer and Soil Moisture Properties from AirMOSS P-band SAR in Alaska. ORNL DAAC, Oak Ridge, Tennessee, USA. https://doi.org/10.3334/ORNLDAAC/1657