Documentation Revision Date: 2020-07-15
Dataset Version: 1
Summary
This dataset helps to quantify carbon losses from wildfires in the southern boreal forests of North America and to assess the spatial heterogeneity in emissions which is associated with differences in burn severity, pre-fire vegetation, and fire weather.
There are two data files in GeoTIFF (.tif) format included with this dataset.
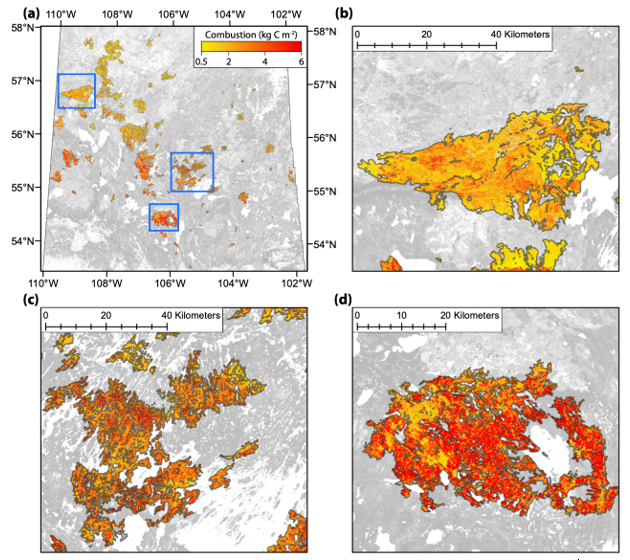
Figure 1.Spatial estimates of total carbon combustion at 30-m resolution across the 2015 fire perimeters in Saskatchewan (a) and sampled fires (b, c, d). The spatial extents of sampled fires are shown as blue rectangles in (a). Source: Dieleman et al., 2020
Citation
Potter, S., B.M. Rogers, and C. Dieleman. 2020. ABoVE: Spatial Estimates of Carbon Combustion from Wildfires across SK, Canada, 2015. ORNL DAAC, Oak Ridge, Tennessee, USA. https://doi.org/10.3334/ORNLDAAC/1787
Table of Contents
- Dataset Overview
- Data Characteristics
- Application and Derivation
- Quality Assessment
- Data Acquisition, Materials, and Methods
- Data Access
- References
Dataset Overview
This dataset provides spatial estimates of carbon combustion from all 2015 wildfire burned areas across Saskatchewan, Canada, on a 30-m grid. Carbon combustion (kg C/m2) was derived from post-fire field measurements of carbon stocks completed in 2016 at 47 stands that burned during three 2015 Saskatchewan wildfires (Egg, Philion, and Brady) and at 32 unburned stands in adjacent areas. The study areas covered two ecozones (Boreal Plains and Boreal Shield), two stand-replacing history types (fire and timber harvest), three soil moisture classes (xeric, mesic, and subhygric), and three stand dominance classifications (coniferous, deciduous, and mixed). To spatially extrapolate estimates of combustion to all 2015 fires in Saskatchewan, a predictive radial support vector machine model was trained on the 47 burned stands with associated environmental variables and geospatial predictors and applied to historical fire areas. The dataset also includes uncertainty estimates represented as per pixel standard deviations of model estimates derived using a Monte Carlo analysis.
This dataset helps to quantify carbon losses from wildfires in the southern boreal forests of North America and to assess the spatial heterogeneity in emissions which is associated with differences in burn severity, pre-fire vegetation, and fire weather.
Project: Arctic-Boreal Vulnerability Experiment
The Arctic-Boreal Vulnerability Experiment (ABoVE) is a NASA Terrestrial Ecology Program field campaign being conducted in Alaska and western Canada, for 8 to 10 years, starting in 2015. Research for ABoVE links field-based, process-level studies with geospatial data products derived from airborne and satellite sensors, providing a foundation for improving the analysis, and modeling capabilities needed to understand and predict ecosystem responses to, and societal implications of, climate change in the Arctic and Boreal regions.
Related Publication:
Dieleman, C.M., B.M. Rogers, S. Potter, S. Veraverbeke, J.F. Johnstone, J. Laflamme, L. Gelhorn, K. Solvik, X.J. Walker, M.C. Mack, and M.R. Turetsky. 2020. Wildfire combustion and carbon stocks in the southern Canadian boreal forest: Implications for a warming world. Global Change Biology. 2020; 00: 1-18. https://doi.org/10.1111/gcb.15158.
Related Dataset:
Dieleman, C., B.M. Rogers, S. Veraverbeke, J.F. Johnstone, J. Laflamme, L. Gelhorn, K. Solvik, X.J. Walker, M.C. Mack, and M.R. Turetsky. 2019. ABoVE: Characterization of Burned and Unburned Boreal Forest Stands, SK, Canada, 2016. ORNL DAAC, Oak Ridge, Tennessee, USA. https://doi.org/10.3334/ORNLDAAC/1740
The field measurements provided in this related dataset are the raw data used to create the spatial model of carbon consumption for all fires in 2015 in Saskatchewan reported in the current dataset.
Acknowledgements:
This work was funded by the Arctic-Boreal Vulnerability Experiment grants NNX15AU56A and NX15AT71A.
Data Characteristics
Spatial Coverage: Saskatchewan, Canada
ABoVE Reference Locations
Domain: Core ABoVE
Grid cells: Ah2Av2.Bh14Bv14.Ch87Cv88, Ah2Av2.Bh14Bv14.Ch87Cv89, Ah2Av2.Bh14Bv15.Ch87v90, Ah2Av2.Bh15Bv15.Ch95v95, Ah2Av2.Bh15Bv16.Ch94v96, Ah2Av2.Bh15Bv16.Ch92Cv97, Ah2Av2.Bh15Bv16.Ch93Cv97, Ah2Av2.Bh15Bv16.Ch94Cv97, Ah2Av2.Bh15Bv16.Ch91Cv99, Ah2Av2.Bh15Bv16.Ch91Cv100, Ah2Av2.Bh15Bv16.Ch92Cv100, Ah2Av2.Bh15Bv16.Ch91Cv101
Spatial Resolution: 30 m
Temporal Coverage: 2015-04-06 to 2015-08-11
Study Areas: All latitude and longitude given in decimal degrees.
| Region | Westernmost Longitude | Easternmost Longitude | Northernmost Latitude | Southernmost Latitude |
|---|---|---|---|---|
| Alaska | -116.055 | -100.168 | 61.2389 | 51.19426 |
Data File Information
There are two data files in GeoTIFF (.tif) format included with this dataset.
Table 1. File names and descriptions.
| File Name | Units | Description |
|---|---|---|
| post_fire_carbon_combustion.tif | kg C/m2 | Spatial estimates of carbon combustion from 2015 wildfires in Saskatchewan on a 30 m grid. |
| post_fire_carbon_combustion_std_dev.tif | kg C/m2 | The standard deviations of carbon combustion from 2015 wildfires in Saskatchewan on a 30 m grid. |
Data File Details
Projection: Canada Albers Equal Area Conic
EPSG: 102001
No data value: -9999
Bands: 1
Scaling: 1
Application and Derivation
This dataset helps to quantify carbon losses from wildfires in the southern boreal forests of North America and to assess the spatial heterogeneity in emissions which is associated with differences in burn severity, pre-fire vegetation, and fire weather.
Quality Assessment
Uncertainty was measured by using a Monte Carlo analysis whereby standard errors in field-measured carbon were randomly adjusted along with residuals in the support vector machine model itself. Adjustments were made over 500 iterations to acquire per pixel standard deviation of post-fire carbon estimations (Dieleman et al., 2020).
Data Acquisition, Materials, and Methods
Following is a brief synopsis of the data sources and modeling described in Dieleman et al. (2020). Included for user convenience are summary tables and a figure from Dieleman et al. (2020) supplemental information.
Source Field Measurements
Combustion of carbon stocks was estimated from post-fire field measurements completed in 2016 at 47 stands that burned in the 2015 Saskatchewan wildfires (Egg, Philion, and Brady) and at 32 unburned stands in comparable adjacent areas. The study covered two ecozones (Boreal Plains and Boreal Shield), two stand replacing history types (fire and timber harvest), three soil moisture classes (xeric, mesic, and subhygric), and three stand dominance classifications (coniferous, deciduous, and mixed). The data for the burned stands are summarized in Table 2. These field measurements are available from the ORNL DAAC (Dieleman et al., 2019).
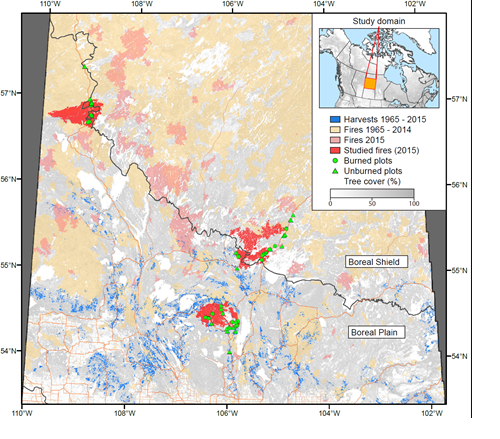
Figure 2. Study domain within the southern boreal forest of central Saskatchewan, Canada. Souce: Dieleman et al., 2020
Table 2. A summary of the field data measurements for burned stands. Values of quantified site variables as well as calculated soil and carbon parameters. Error values are calculated as the standard error of the mean, while the bracketed values indicate the data range. The error associated with carbon stocks and emissions include the propagated model uncertainties.
| Variable | Units | All Sites | Xeric Sites | Mesic Sites | Subhygric Sites |
|---|---|---|---|---|---|
| Latitude | Radians | 55.3 ± 0.1 (54.1 – 57.4) | 55.4 ± 0.2 (54.1 – 57.4) | 55.1 ± 0.2 (54.1 – 57.4) | 55.7 ± 0.3 (54.3 – 57.0) |
| Elevation | m.a.s.l. | 501.8 ± 10.8 (360 – 671) | 490.6 ± 15.1 (360 – 671) | 524.2 ± 18.0 (374 – 665) | 479.3 ± 29.0 (381 – 639) |
| Aspect | Radians | 179.0 ± 13.4 (0 – 350) | 187.9 ± 17.9 (0 – 350) | 170.4 ± 22.4 (0 – 340) | 165.5 ± 44.9 (70 – 282) |
| Slope | Radians | 3.5 ± 0.5 (0 – 22.5) | 4.6 ± 0.9 (0 – 22.5) | 2.5 ± 0.4 (0 – 7.2) | 2.3 ± 1.6 (0 – 18) |
| Stand Age | Years | 46.9 ± 4.5 (1 – 188) | 35.1 ± 5.7 (1 – 125) | 49.9 ± 6.6 (10 – 137) | 79.3 ± 15.6 (21 – 188) |
| Burn Date | Julian Days | 183 ± 1 (158 – 195) | 184 ± 2 (158 – 195) | 181 ± 2 (159 – 188) | 182 ± 5 (158 – 192) |
| Composite Burn Index | Unitless | 2.4 ± 0.1 (0.9 – 3.0) | 2.3 ± 0.1 (0.9 – 3.0) | 2.6 ± 0.1 (2.0 – 2.9) | 2.1 ± 0.3 (1.2 – 2.9) |
| Stand Density | Stems m-2 | 1.2 ± 0.2 (0 – 8.6) | 1.4 ± 0.3 (0 – 8.6) | 0.9 ± 0.1 (0.1 – 3.8) | 1.2 ± 0.4 (0.2 – 3.7) |
| Black Spruce Cover | Percent Cover | 31 ± 4 (0 – 100) | 15 ± 4 (0 – 100) | 38 ± 7 (0 – 100) | 71 ± 10 (20 – 100) |
| Jack Pine Cover | Percent Cover | 32 ± 4 (0 – 100) | 38 ± 6 (0 – 100) | 37 ± 6 (0 – 100) | 1 ± 1 (0 – 6) |
| Trembling Aspen Cover | Percent Cover | 11 ± 3 (0 – 97) | 20 ± 5 (0 – 97) | 3 ± 1 (0 – 27) | 0 ± 0 (0 – 4) |
| Paper Birch Cover | Percent Cover | 9 ± 2 (0 – 100) | 13 ± 4 (0 – 100) | 5 ± 2 (0 – 48) | 2 ± 2 (0 – 18) |
| Green Alder | Percent Cover | 4 ± 2 (0 – 71) | 3 ± 1 (0 – 24) | 6 ± 3 (0 – 71) | 6 ± 5 (0 – 60) |
| Pre-fire Soil Organic Layer Depth | cm | 15 ± 1 (2 – 75) | 8 ± 1 (2 – 24) | 16 ± 2 (6 – 42) | 33 ± 5 (19 – 75) |
| Soil Organic Layer Burn Depth | cm | 9 ± 1 (0 – 32) | 6 ± 1 (0 – 23) | 11 ± 2 (4 – 23) | 16 ± 5 (2 – 32) |
| Aboveground Carbon Stocks | kg C m-2 | 4.1 ± 0.4 (0.2 – 15.7) | 4.1 ± 0.5 (0.3 – 15.7) | 4.2 ± 0.5 (0.2 – 12.0) | 4.1 ± 0.9 (0.8 – 11.2) |
| Belowground Carbon Stocks | kg C m-2 | 3.8 ± 1.0 (0.3 – 22.9) | 2.5 ± 0.3 (0.3 – 9.3) | 4.1 ± 0.7 (1.1 – 17.2) | 7.3 ± 2.1 (1.5– 22.9) |
| Total Carbon Stocks | kg C m-2 | 7.9 ± 1.2 (2.0 – 29.4) | 6.6 ± 0.7 (2.0 – 22.3) | 8.3 ± 0.8 (2.1 – 22.0) | 11.4 ± 2.7 (2.4 – 29.4) |
| Aboveground Carbon Combustion Rate | kg C m-2 | 1.0 ± 0.3 (0.1 – 6.1) | 1.1 ± 0.3 (0.1 – 6.1) | 0.9 ± 0.1 (0.3 – 2.2) | 1.0 ± 0.3 (0.3 – 2.2) |
| Belowground Carbon Combustion Rate | kg C m-2 | 2.3 ± 1.0 (ND – 8.7) | 1.8 ± 0.4 (ND – 8.1) | 2.7 ± 0.6 (0.6 – 8.7) | 3.5 ± 1.4 (0.04 – 8.3) |
| Total Carbon Combustion Rate | kg C m-2 | 3.3 ± 1.1 (0.3 – 14.2) | 2.8 ± 0.6 (0.7 – 14.2) | 3.6 ± 0.6 (1.1 – 9.9) | 4.5 ± 1.6 (0.3– 10.4) |
Estimates of Combustion
To spatially extrapolate estimates of combustion to all 2015 fires in Saskatchewan, a predictive model was developed and trained using only geospatial predictors. Forty-seven initial predictors were acquired that were associated with environmental conditions such as soil type, topography, and fire weather (Table 3). A multicollinearity analysis was then implemented based on the absolute values of pair-wise Pearson correlations between all predictors. For any two variables that had a correlation coefficient greater than 0.6, the variable with a larger mean absolute correlation compared across all other predictors was removed. This resulted in a final predictor set of 20 (Table 3).
These final 20 predictors were re-gridded to 30-m resolution on a Canadian Albers Equal Area Conic projection within all 2015 fire scars using nearest neighbor for categorical variables (ecoregion and land cover) and bilinear interpolation for continuous variables. Fire scars were used from the Canadian National Burned Area Composite (NBAC; Fraser et al., 2000), which indicated a total burned area of 1.41M ha.
Several models were evaluated for estimating total combustion (kg C m-2) including support vector machines, multiple regression, multivariate adaptive regression splines, ridge regression, and lasso regression. To find optimal tuning parameters for each model, a random tune length of four for each available tuning parameter was used and the parameters were selected that resulted in the best model as measured by the highest R2 from a 10-fold cross validation procedure repeated three times. The final regression model was then applied to all pixels within the historical fire perimeters that had valid values for all predictors (e.g., no imagery missing from clouds), which amounted to 95.4% of the pixels. To account for these missing pixels, estimates of total emissions were scaled assuming the missing pixels had combustion values equal to the mean from all valid pixels.
Table 3. Geospatial variables used for spatial modeling of total carbon emissions. Variables that were retained in the final model are marked with an asterisk.
| Variable type | Variables | Spatial resolution (m) | Source |
|---|---|---|---|
| Topographic |
Slope* Aspect * Topographic wetness index (TWI)* Elevation |
1/3 arcsecond or approximately 10 m |
Burns et al. (2019); TWI calculated following Beven & Kirkby (1979) |
| Fire Severity | dNBR* | 30 | Google Earth Engine (Landsat 8). Clouds masked with cfmask, and dNBR calculated using the mean NBR between June 1 and August 31 for both 2014 (pre-fire) and 2016 (post-fire). |
| Tree Cover | Pre-fire tree cover* | 30 | Sexton et al. (2013) |
| Burn Timing | Date of burn* | Polygon | Loboda et al. (2017) |
| Fire Weather |
Fine Fuel Moisture Code (FFMC) * Duff Moisture Code (DMC)* Drought Code (DC) Initial Spread Index (ISI) Buildup Index (BUI) Fire Weather Index (FWI) Vapor Pressure Deficit (VPD) Wind Speed* Temperature* Relative Humidity* |
~50,000 (0.5° ´ 0.75°) |
Field et al. (2015): GFWED version 2 using MERRA-2 reanalysis. |
| Baseline Climate (1981 – 2010) |
Maximum Summer Temperature (May - August)* Minimum Summer Temperature (May - August) Precipitation (May- August) Solar Radiation (May- August) Relative Humidity (May - August) Climate Moisture Deficit (May - August) Degree Days > 5º Celsius (May – August) Mean Annual Temperature Mean Annual Precipitation Mean Annual Wettest Month Mean Annual Temperature Differential Mean Annual Number of Frost Free Days Mean Annual Frost Free Period Mean Annual Precipitation as Snow Mean Annual Climatic Moisture Deficit Mean Annual Solar Radiation Mean Annual Relative Humidity |
1 km | Wang et al. (2016) |
| Tree species |
Jack Pine-Spruce* Aspen-Birch-Poplar* Other* |
30 m | McLaughlan et al. (2014) mapped at 20 m by the Saskatchewan Provincial government |
| Soil properties |
Soil organic carbon Bulk density pH % Sand % Silt * % Clay integrated over the top 30cm |
(7.5 arc seconds) or approximately 250 m | Hengl et al. (2017) |
| Stand Age | Stand Age* | 250 m | Pan et al. (2011) |
| Ecoregion Level 2 |
Boreal Plains* Softwood Shield* Taiga Shield* |
Polygon | Commission for Environmental Cooperation Working Group (1997) |
Uncertainty Estimates for Combustion
Uncertainty for spatial modeling of total combustion across the 2015 Saskatchewan fire complex was quantified using a step-wise Monte Carlo framework. This method generated estimates of mean pixel-level uncertainty, uncertainty in total emissions, and uncertainty in mean combustion. It did so by combining the site-level uncertainty estimates with uncertainty from the spatial model used to predict emissions at any given 30-m pixel. Refer to Dieleman et al. (2020) for details.
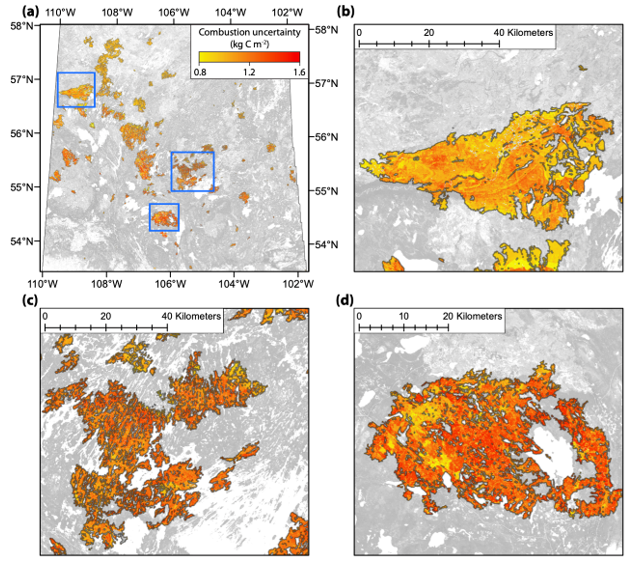
Figure 3. Spatial estimates of combustion uncertainty at 30-m resolution across the 2015 fire perimeters in Saskatchewan (a) and sampled fires (b, c, d). The spatial extents of sampled fires are shown as blue rectangles in (a). Source: Dieleman et al., 2020.
Data Access
These data are available through the Oak Ridge National Laboratory (ORNL) Distributed Active Archive Center (DAAC).
ABoVE: Spatial Estimates of Carbon Combustion from Wildfires across SK, Canada, 2015
Contact for Data Center Access Information:
- E-mail: uso@daac.ornl.gov
- Telephone: +1 (865) 241-3952
References
Dieleman, C.M., B.M. Rogers, S. Potter, S. Veraverbeke, J.F. Johnstone, J. Laflamme, L. Gelhorn, K. Solvik, X.J. Walker, M.C. Mack, and M.R. Turetsky. 2020. Wildfire combustion and carbon stocks in the southern Canadian boreal forest: Implications for a warming world. Global Change Biology. 2020; 00: 1-18. https://doi.org/10.1111/gcb.15158.
Dieleman, C., B.M. Rogers, S. Veraverbeke, J.F. Johnstone, J. Laflamme, L. Gelhorn, K. Solvik, X.J. Walker, M.C. Mack, and M.R. Turetsky. 2019. ABoVE: Characterization of Burned and Unburned Boreal Forest Stands, SK, Canada, 2016. ORNL DAAC, Oak Ridge, Tennessee, USA. https://doi.org/10.3334/ORNLDAAC/1740
Beven, K.J., and M.J. Kirkby. 1979. A physically based, variable contributing area model of basin hydrology. Hydrological Sciences Bulletin, 24:43-69. https://doi.org/10.1080/02626667909491834
Burns, P.J., R.M Massey, D.Shean, E.B. Husby, S.G. Goetz, S.G. A composite 10-m digital elevation model of Alaska and Canada for NASA ABoVE. Environmental Research Letters (in preparation).
Environmental Cooperation Working Group. 1997. Ecological regions of North America – toward a common perspective. Montreal, QC: Canada, Commission for Environmental Cooperation. ISBN: 2-922305-18-X. http://www3.cec.org/islandora/en/item/1701-ecological-regions-north-america-toward-common-perspective
Hengl, T., J. Mendes de Jesus, G.B.M Heuvelink, M. Ruiperez Gonzalez, M. Kilibarda, A. Blagotic, et al. 2017. SoilGrids250m: Global gridded soil information based on machine learning. PLoS ONE, 12:e0169748. https://doi.org/10.1371/journal.pone.0169748
Loboda, T.V., and J.V. Hall. 2017. ABoVE: Wildfire Date of Burning within Fire Scars across Alaska and Canada, 2001-2015. ORNL DAAC, Oak Ridge, Tennessee, USA. https://doi.org/10.3334/ORNLDAAC/1559
McLaughlan, M.S., R.A Wright, and R.D Jiricka. 2010. Field Guide to the Ecosites of Saskatchewan’s Provincial Forests. Prince Albert, SK: Canada, Forest Service. http://www.environment.gov.sk.ca/forests
Pan, Y., J.M Chen, R. Birdsey, K. McCullough, L. He, and F. Deng. 2011. Age structure and disturbance legacy of North American forests. Biogeosciences, 8:715-732. https://doi.org/10.5194/bg-8-715-2011
Rogers, B.M., S. Veraverbeke, G. Azzari, C.I. Czimczik, S.R. Holden, G.O. Mouteva, F. Sedano, K.K. Treseder, and J.T. Randerson. 2014). Quantifying fire-wide carbon emissions in interior Alaska using field measurements and Landsat imagery. Journal of Geophysical Research: Biogeosciences, 119:1608-1629. https://doi.org/10.1002/2014JG002657
Sexton, J.O., X. Song, M., Feng, P. Noojipady, A. Anand, C. Huang, D. Kim, K.M. Collins, S. Channan, C. DiMiceli, and J.R.G. Townshend. 2013. Global, 30-m resolution continuous fields of tree cover: Landsat-based rescaling of MODIS Vegetation Continuous Fields with lidar-based estimates of error. International Journal of Digital Earth, 130321031236007. https://doi.org/10.1080/17538947.2013.786146
Veraverbeke, S., B.M. Rogers, and J.T. Randerson. 2015. Daily burned area and carbon emissions from boreal fires in Alaska. Biogeosciences, 12:3579-3601. https://doi.org/10.5194/bg-12-3579-2015
Walker, X.J., B.M. Rogers, J.L. Baltzer, S.G. Cumming, N.J. Day, S.J. Goetz, J.F. Johnstone, E.A.G. Schuur, M.R. Turetsky, and M.C. Mack. 2018. Cross-scale controls on carbon emissions from boreal forests megafires. Global Change Biology, 24:4251-4265. https://doi.org/10.1111/gcb.14287