Documentation Revision Date: 2022-03-21
Dataset Version: 1
Summary
Potential field sites were determined a priori using a suite of fire indices and topographic variables. Burned and unburned areas were identified within fire perimeters recorded in the Alaska Large Fire Database (ALFD), and Landsat satellite imagery data was used to calculate indices of fire severity. The final set of sites were selected using a stratified random sampling scheme.
There are 7 data files included in this dataset; 1 file in comma-separated values (*.csv) format, 3 files in Keyhole Markup Language (*.kml) format, and 3 files in Portable Document Format (*.pdf).
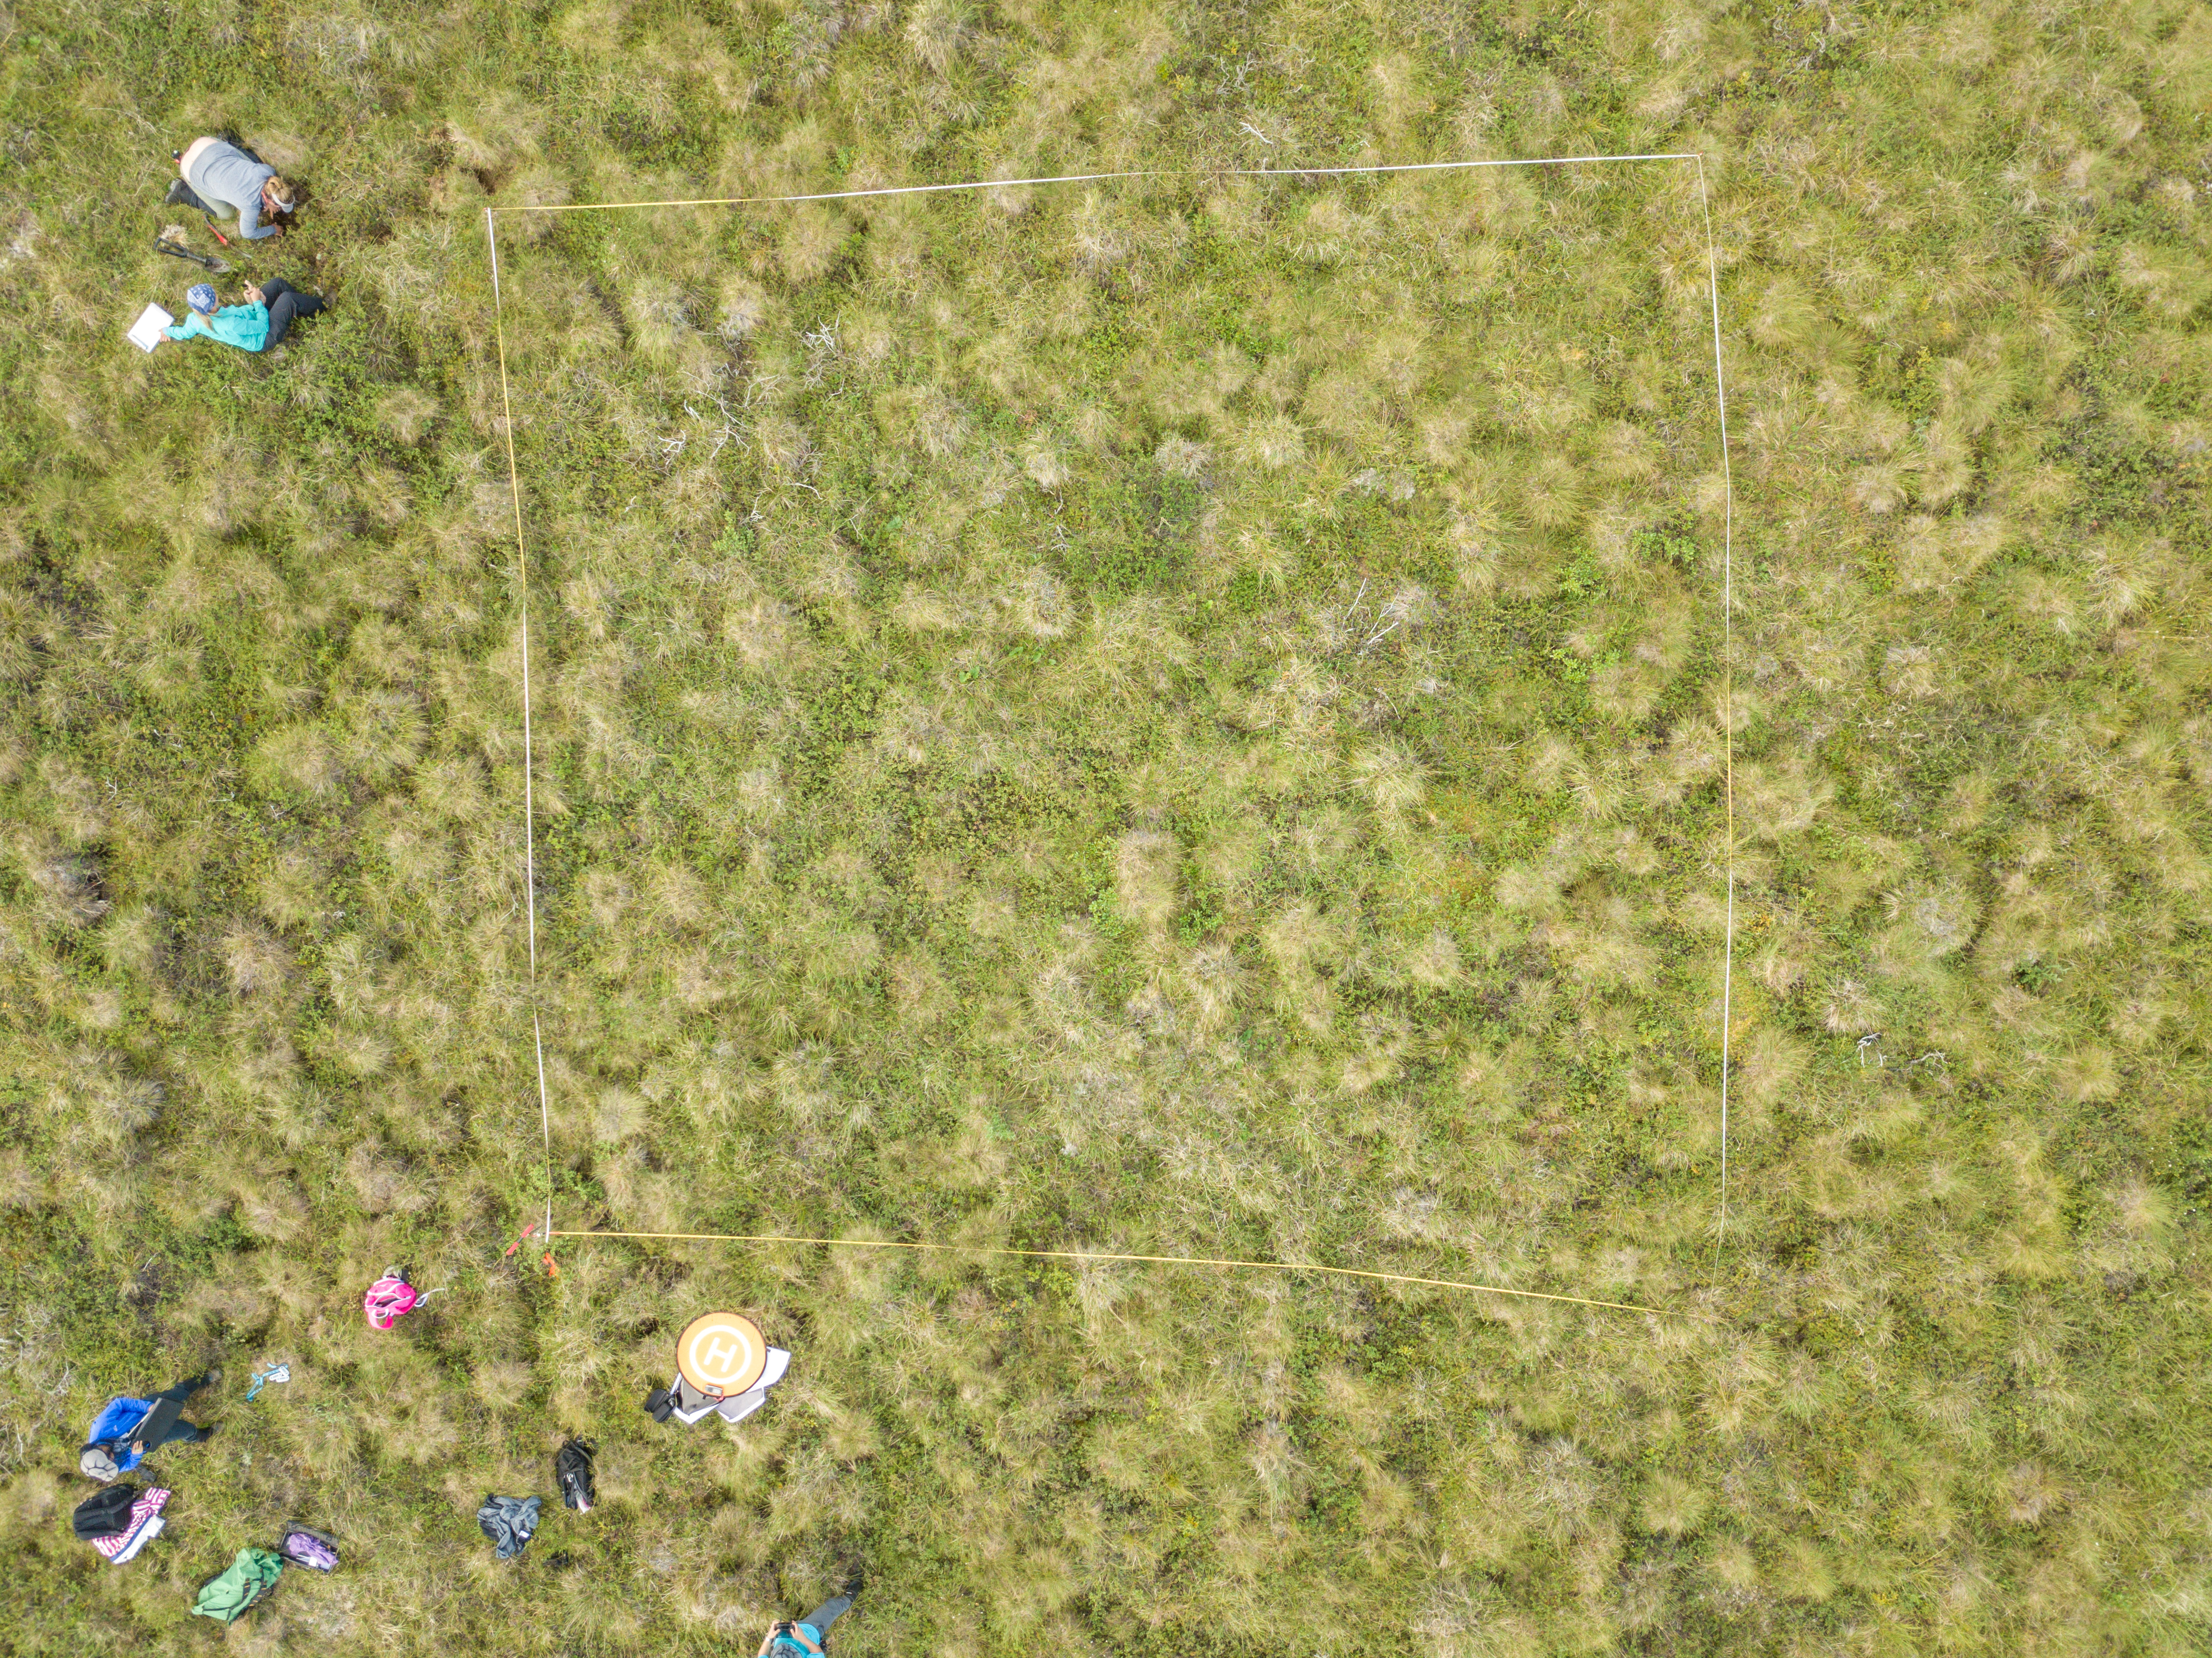
Figure 1. Researchers at a field site in the Seward Peninsula during 2017.
Citation
Loboda, T.V., L.K. Jenkins, D. Chen, J. He, and A. Baer. 2022. Burned and Unburned Field Site Data, Noatak, Seward, and North Slope, AK, 2016-2018. ORNL DAAC, Oak Ridge, Tennessee, USA. https://doi.org/10.3334/ORNLDAAC/1919
Table of Contents
- Dataset Overview
- Data Characteristics
- Application and Derivation
- Quality Assessment
- Data Acquisition, Materials, and Methods
- Data Access
- References
Dataset Overview
This dataset includes field measurements from unburned and burned 10 m x 10 m and 1 m x 1 m plots in the Noatak, Seward, and North Slope regions of the Alaskan tundra during July through August in the years 2016–2018. The data include vegetation coverage, soil moisture, soil temperature, soil thickness, thaw depth, and weather measurements. Measurements were recorded using ocular assessments and standard equipment. Plot photographs are included.
Potential field sites were determined a priori using a suite of fire indices and topographic variables. Burned and unburned areas were identified within fire perimeters recorded in the Alaska Large Fire Database (ALFD), and Landsat satellite imagery data was used to calculate indices of fire severity. The final set of sites were selected using a stratified random sampling scheme.
Project: Arctic-Boreal Vulnerability Experiment
The Arctic-Boreal Vulnerability Experiment (ABoVE) is a NASA Terrestrial Ecology Program field campaign being conducted in Alaska and western Canada, for 8 to 10 years, starting in 2015. Research for ABoVE links field-based, process-level studies with geospatial data products derived from airborne and satellite sensors, providing a foundation for improving the analysis, and modeling capabilities needed to understand and predict ecosystem responses to, and societal implications of, climate change in the Arctic and Boreal regions.
Related Publications
He, J., D. Chen, L. Jenkins, and T.V. Loboda. 2021. Impacts of wildfire and landscape factors on organic soil properties in Arctic tussock tundra. Environmental Research Letters 16:085004. https://doi.org/10.1088/1748-9326/ac1192
He, J., Loboda, T. V., Jenkins, L., Chen, D. 2019. Mapping fractional cover of major fuel type components across Alaskan tundra. Remote Sensing of Environment 232:111324. https://doi.org/10.1016/j.rse.2019.111324
Acknowledgment
This research was funded by the NASA Arctic-Boreal Vulnerability Experiment (ABoVE) program (grant NNX15AT79A).
Data Characteristics
Spatial Coverage: Noatak, Seward, and North Slope regions of the Alaskan tundra, U.S.
ABoVE Reference Locations
Domain: Core ABoVE
State/Territory: Alaska
Grid cells: Ch036v010, Ch038v011, Ch038v012, Ch037v011, Ch036v009, Ch035v009, Ch036v011, Ch025v011, Ch024v011, Ch050v019, Ch051v019, Ch052v018, Ch050v020
Spatial Resolution: Point measurements at 10 x 10- m and 1 x 1 m plots
Temporal Coverage: 2016-07-22 to 2018-08-27
Temporal Resolution: One and two-time estimates
Study Area: All latitude and longitude are given in decimal degrees. These coordinates are the approximate locations of the study sites and may not match the extent of the data files.
| Site | Northern Extent | Southern Extent | Eastern Extent | Western Extent |
|---|---|---|---|---|
| Noatak, Seward, North Slope regions, Alaska | 69.663 | 65.018 | -148.640 | -164.929 |
Data File Information
There are 7 data files included in this dataset; 1 file in comma-separated values (*.csv) format, 3 files in Keyhole Markup Language (*.kml) format, and 3 files in Portable Document Format (*.pdf).
Table 1. File names and descriptions.
| File Name | Description |
|---|---|
| Plot_Data_Noatak_Seward_Alaska.csv | Provides vegetation percent coverage, environmental conditions, weather descriptions, wind, and temperature data, as well as soil temperature, thaw depth, and soil moisture measurements (Table 1). Missing numeric data are represented by "-9999", and missing text values are represented by "NA". |
| YYYY_field_photos.kml | Georeferenced photographs of the study sites for each of the years 2016, 2017, and 2018. In the names of these files, YYYY is either 2016, 2017, or 2018. |
| YYYY_field_photos.pdf | Images and metadata for each study site. In the names of these files, YYYY is either 2016, 2017, or 2018. Within the files, information can be matched to data provided in the file Plot_Data_Noatak_Seward_Alaska.csv (for fields photo_north, photo_south, photo_east, photo_west, photo_nadir, and photo_other) by the name IMGP0aaa.JPG, where aaa is the ID number. |
Data File Details
Table 2. Variable names and descriptions in the file Plot_Data_Noatak_Seward_Alaska.csv.
| Variable | Units | Description |
|---|---|---|
| site_name | text | Field site ID for 10 m x 10 m plots and transect locations |
| site_type | text | Burned or unburned types as recorded by the Alaskan Large Fire Database |
| geographic_region | text | NOAT: Noatak River Valley; SEWP: Seward Peninsula; NS: North Slope |
| fire_frequency | text | Fire frequency based on fire perimeters and verified, where possible, with satellite imagery. Burned sites have a value of ≥ and unburned sites have a value 0. |
| fire1_year | YYYY | The most recent year of fire occurrence |
| fire1_bsi | text | Burn Severity Index (bsi) for the most recent year of fire occurrence, values include: 1 (very low), 2 (moderate), 3 (high), 4 (severe) |
| fire2_year | YYYY | The second most recent year of fire occurrence |
| fire2_bsi | text | Burn Severity Index (bsi) for the second most recent year of fire occurrence, values include: 1 (very low), 2 (moderate), 3 (high), 4 (severe) |
| fire3_year | YYYY | The third most recent year of fire occurrence |
| fire3_bsi | text | Burn Severity Index (bsi) for the third most recent year of fire occurrence, values include: 1 (very low), 2 (moderate), 3 (high), 4 (severe) |
| fire4_year | YYYY | The fourth most recent year of fire occurrence |
| fire4_bsi | text | Burn Severity Index (bsi) for the fourth most recent year of fire occurrence, values include: 1 (very low), 2 (moderate), 3 (high), 4 (severe) |
| measurement_year | YYYY | Data collection year |
| measurement_date | YYYY-MM-DD | Data collection date |
| measurement_hour | HH | Data collection hour (local time) |
| measurement_time | HH:MM:SS | Data collection time (local time) |
| latitude | Decimal degrees | Latitude of the southeast (SE) corner of the site (10 x 10-m plot) |
| longitude | Decimal degrees | Longitude of the SE corner of the site (10 x 10-m plot) |
| site_description | text | General description of the 10 m x 10 m site (e.g. vegetation distribution, drainage, topography, etc.) |
| weather_current | text | Description of weather conditions during data collection |
| weather_past_12hr | text | Description of weather conditions during the past 12 hours before data collection |
| rain | text | Binary data representing the occurrence of rain: 1 (yes) or 0 (no) |
| drainage | text | Drainage types, values include: 1 (flat-poorly drained), 2 (flat-drained), 3 (moderately-drained), 4 (well-drained). The values were created through a combination of elevation, slope, flow accumulation, and ideas described in (Kasischke and Hoy, 2012). |
| air_temp | degrees C | Air temperature at 2 m above the surface for 1 m x 1m plots and transect points |
| rh | % | Relative humidity at 2 m above the surface for 1 m x 1m plots and transect points |
| dew_temp | degrees C | Dew point temperature at 2 m above the surface for 1 m x 1m plots and transect points |
| wind_speed | m/s | Wind speed for 1 m x 1m plots and transect points |
| wind_direction | Degree | Wind direction (360 degrees with 0 at N) for 1 m x 1m plots and transect points |
| moss_percent_cover | % | Percent cover of moss within the 10 m x 10 m plot estimated via ocular assessment |
| moss_cover_flag | Flag column to indicate where moss cover percentage is <1 or other text note | |
| moss_distribution | text | General description of the spatial distribution of moss within the 10 m x 10 m plot |
| lichen_percent_cover | % | Percent cover of lichen within the 10 m x 10 m plot estimated via ocular assessment |
| lichen_cover_flag | Flag column to indicate where lichen cover percentage is <1 or other text note | |
| lichen_distribition | text | General description of the spatial distribution of lichen within the 10 m x 10 m plot |
| grass_percent_cover | % | Percent cover of grass within the 10 m x 10 m plot estimated via ocular assessment |
| grass_distribution | text | General description of the spatial distribution of grass within the 10 m x 10 m plot |
| sedge_percent_cover | % | Percent cover of sedge within the 10 m x 10 m plot estimated via ocular assessment |
| sedge_cover_flag | Flag column to indicate where sedge cover percentage is <1 or other text note | |
| sedge_distribution | text | General description of the spatial distribution of sedge within the 10 m x 10 m plot |
| shrub_percent_cover | % | Percent cover of shrub within the 10 m x 10 m plot estimated via ocular assessment |
| shrub_height | cm | Mean height of shrubs at the 10 m x 10 m plot |
| shrub_distribution | text | General description of the spatial distribution of shrub within the 10 m x 10 m plot |
| char_percent_cover | % | Percent cover of char within the 10 m x 10 m plot estimated via ocular assessment |
| char_cover_flag | Flag column to indicate where char cover percentage is <1 or other text note | |
| char_distribution | text | General description of the spatial distribution of char within the 10 m x 10 m plot |
| other_ground_cover_type | text | A different ground cover type other than measured, if any |
| other_ground_cover_percent_cover | % | Percent cover of the type, if any |
| other_cover_flag | Flag column to indicate where other cover percentage is <1 or other text note | |
| other_ground_cover_height | cm | Height of the species of the type, if any |
| other_distribution | text | Spatial distribution of the type, if any |
| other2_ground_cover_type | text | A second ground cover type other than measured, if any |
| other2_ground_cover_percent_cover | % | Percent cover of the second type, if any |
| other2_cover_flag | Flag column to indicate where other cover2 percentage is <1 or other text note | |
| other2_distribution | text | Spatial distribution of the second type, if any |
| tussock_center_uncompacted_length | cm | Uncompacted length of the central tussock located at the southeast (SE) corner of the 10 m x 10 m plot |
| tussock_center_compacted_length | cm | Compacted length of the central tussock located at the SE corner of the 10 m x 10 m plot |
| tussock_center_uncompacted_width | cm | Uncompacted width of the central tussock located at the SE corner of the 10 m x 10 m plot |
| tussock_center_compacted_width | cm | Compacted width of the central tussock located at the SE corner of the 10 m x 10 m plot |
| tussock_center_uncompacted_area2 | cm2 | Uncompacted area of the central tussock located at the SE corner of the 10 m x 10 m plot |
| tussock_center_compacted_area2 | cm2 | Compacted area of the central tussock located at the SE corner of the 10 m x 10 m plot |
| tussock_center_depth | cm | Depth (or height) of the central tussock located at the SE corner of the 10 m x 10 m plot |
| tussock_a_distance_from_center | cm | Distance from tussock A to the central tussock within 1 m x 1 m plots |
| tussock_a_uncompacted_length | cm | Uncompacted length of tussock A within 1 m x 1 m plots |
| tussock_a_compacted_length | cm | Compacted length of tussock A within 1 m x 1 m plots |
| tussock_a_uncompacted_width | cm | Uncompacted width of tussock A within 1 m x 1 m plots |
| tussock_a_compacted_width | cm | Compacted width of tussock A within 1 m x 1 m plots |
| tussock_a_uncompacted_area2 | cm2 | Uncompacted area of tussock A within 1 m x 1 m plots |
| tussock_a_compacted_area2 | cm2 | Compacted area of tussock A within 1 m x 1 m plots |
| tussock_a_depth | cm | Depth (height) of tussock A within 1 m x 1 m plots |
| tussock_b_distance_from_center | cm | Distance from tussock B to the central tussock within 1 m x 1 m plots |
| tussock_b_uncompacted_length | cm | Uncompacted length of tussock B within 1 m x 1 m plots |
| tussock_b_compacted_length | cm | Compacted length of tussock B within 1 m x 1 m plots |
| tussock_b_uncompacted_width | cm | Uncompacted width of tussock B within 1 m x 1 m plots |
| tussock_b_compacted_width | cm | Compacted width of tussock B within 1 m x 1 m plots |
| tussock_b_uncompacted_area2 | cm2 | Uncompacted area of tussock B within 1 m x 1 m plots |
| tussock_b_compacted_area2 | cm2 | Compacted area of tussock B within 1 m x 1 m plots |
| tussock_b_depth | cm | Depth (height) of tussock B within 1 m x 1 m plots |
| tussock_c_distance_from_center | cm | Distance from tussock C to the central tussock within 1 m x 1 m plots |
| tussock_c_uncompacted_length | cm | Uncompacted length of tussock C within 1 m x 1 m plots |
| tussock_c_compacted_length | cm | Compacted length of tussock C within 1 m x 1 m plots |
| tussock_c_uncompacted_width | cm | Uncompacted width of tussock C within 1 m x 1 m plots |
| tussock_c_compacted_width | cm | Compacted width of tussock C within 1 m x 1 m plots |
| tussock_c_uncompacted_area2 | cm2 | Uncompacted area of tussock C within 1 m x 1 m plots |
| tussock_c_compacted_area2 | cm2 | Compacted area of tussock C within 1 m x 1 m plots |
| tussock_c_depth | cm | Depth (height) of tussock C within 1 m x 1 m plots |
| percent_cover_shrubs | % | Percent cover of shrubs in the 1 m x 1 m plot at the SE corner of the 10 m x 10 m plot |
| ave_height_shrub | cm | Averaged height of shrubs in the 1 m x 1 m plot at the SE corner of the 10 m x 10 m plot |
| stem_count_shrub | text | Stem count of shrubs in the 1 m x 1 m plot at the SE corner of the 10 m x 10 m plot |
| depth_to_mineral_soil_1 | cm | Soil pit: measurement of depth to mineral soil side 1 |
| depth_to_mineral_soil_2 | cm | Soil pit: measurement of depth to mineral soil side 2 |
| depth_to_mineral_soil_3 | cm | Soil pit: measurement of depth to mineral soil side 3 |
| depth_to_mineral_soil_4 | cm | Soil pit: measurement of depth to mineral soil side 4 |
| ave_depth_to_mineral_soil | cm | Soil pit: averaged depth to mineral soil depth |
| soil_sampled | text | Soil sample has been collected at the plot for lab measurements: yes or no |
| thaw_depth_1 | cm | The first measurement of thaw depth for 1 m x 1 m plots and transect points |
| thaw_depth_2 | cm | The second measurement of thaw depth for 1 m x 1 m plots and transect points |
| thaw_depth_3 | cm | The third measurement of thaw depth for 1 m x 1 m plots and transect points |
| thaw_depth_4 | cm | The fourth measurement of thaw depth for 1 m x 1 m plots and transect points |
| thaw_depth_5 | cm | The fifth measurement of thaw depth for 1 m x 1 m plots and transect points |
| thaw_depth_6 | cm | The sixth measurement of thaw depth for 1 m x 1 m plots and transect points |
| active_layer_depth_avg | cm | Averaged active layer thickness for 1 m x 1 m plots and transect points |
| soil_temp_1 | degrees C | The first measurement of soil temperature for 1 m x 1 m plots and transect points |
| soil_temp_2 | degrees C | The second measurement of soil temperature for 1 m x 1 m plots and transect points |
| soil_temp_3 | degrees C | The third measurement of soil temperature for 1 m x 1 m plots and transect points |
| soil_temp_av | degrees C | Averaged soil temperature for 1 m x 1 m plots and transect points |
| soil_substrate_1 | text | Soil substrate of the first soil temperature measurement, values include: BM (Burned moss), DM (Dead moss), FB (Frost Boil), G (Grass), L (Lichen), M (Moss), MS (Mineral soil), OS (Organic soil), S (Shrub), W (Wetland) |
| soil_substrate_2 | text | Soil substrate of the second soil temperature measurement values include: BM (Burned moss), DM (Dead moss), FB (Frost Boil), G (Grass), L (Lichen), M (Moss), MS (Mineral soil), OS (Organic soil), S (Shrub), W (Wetland) |
| soil_substrate_3 | text | Soil substrate of the third soil temperature measurement values include: BM (Burned moss), DM (Dead moss), FB (Frost Boil), G (Grass), L (Lichen), M (Moss), MS (Mineral soil), OS (Organic soil), S (Shrub), W (Wetland) |
| notes_alt | text | Additional information of active layer thickness measurements for 1 m x 1 m plots and transect points |
| notes_site | text | Additional information about the 1 m x 1 m plots and transect points |
| per_vmc_6cm_oldprobe_1 | % | The first % VMC measurement at 6 cm depth using old probe |
| probe_period_6cm_oldprobe_1 | text | Probe period of the first % VMC measurement at 6 cm depth using old probe |
| per_vmc_6cm_oldprobe_2 | % | The second % VMC measurement at 6 cm depth using old probe |
| probe_period_6cm_oldprobe_2 | text | Probe period of the second % VMC measurement at 6 cm depth using old probe |
| per_vmc_6cm_oldprobe_3 | % | The third % VMC measurement at 6 cm depth using old probe |
| probe_period_6cm_oldprobe_3 | text | Probe period of the third % VMC measurement at 6 cm depth using old probe |
| per_vmc_6cm_oldprobe_4 | % | The fourth % VMC measurement at 6 cm depth using old probe |
| probe_period_6cm_oldprobe_4 | text | Probe period of the fourth % VMC measurement at 6 cm depth using old probe |
| per_vmc_6cm_oldprobe_5 | % | The fifth % VMC measurement at 6 cm depth using old probe |
| probe_period_6cm_oldprobe_5 | text | Probe period of the fifth % VMC measurement at 6 cm depth using old probe |
| per_vmc_av_6cm_old | % | Averaged % VMC measurement at 6 cm depth using old probe |
| probe_period_av_6cm_old | text | Averaged probe period at 6 cm depth using old probe |
| per_vmc_calibrated_6cm_old | % | Calibrated % VMC measurement at 6 cm depth using old probe |
| per_vmc_12cm_oldprobe_1 | % | The first % VMC measurement at 12 cm depth using old probe |
| probe_period_12cm_oldprobe_1 | text | Probe period of the first % VMC measurement at 12 cm depth using old probe |
| per_vmc_12cm_oldprobe_2 | % | The second % VMC measurement at 12 cm depth using old probe |
| probe_period_12cm_oldprobe_2 | text | Probe period of the second % VMC measurement at 12 cm depth using old probe |
| per_vmc_12cm_oldprobe_3 | % | The third % VMC measurement at 12 cm depth using old probe |
| probe_period_12cm_oldprobe_3 | text | Probe period of the third % VMC measurement at 12 cm depth using old probe |
| per_vmc_12cm_oldprobe_4 | % | The fourth % VMC measurement at 12 cm depth using old probe |
| probe_period_12cm_oldprobe_4 | text | Probe period of the fourth % VMC measurement at 12 cm depth using old probe |
| per_vmc_12cm_oldprobe_5 | % | The fifth % VMC measurement at 6 cm depth using old probe |
| probe_period_12cm_oldprobe_5 | text | Probe period of the fifth % VMC measurement at 6 cm depth using old probe |
| per_vmc_av_12cm_old | % | Averaged % VMC measurement at 12 cm depth using old probe |
| probe_period_av_12cm_old | text | Averaged probe period at 12 cm depth using old probe |
| per_vmc_calibrated_12cm_old | % | Calibrated % VMC measurement at 12 cm depth using old probe |
| per_vmc_6cm_newprobe_1 | % | The first % VMC measurement at 6 cm depth using new probe |
| probe_period_6cm_newprobe_1 | text | Probe period of the first % VMC measurement at 6 cm depth using new probe |
| per_vmc_6cm_newprobe_2 | % | The second % VMC measurement at 6 cm depth using new probe |
| probe_period_6cm_newprobe_2 | text | Probe period of the second % VMC measurement at 6 cm depth using new probe |
| per_vmc_6cm_newprobe_3 | % | The third % VMC measurement at 6 cm depth using new probe |
| probe_period_6cm_newprobe_3 | text | Probe period of the third % VMC measurement at 6 cm depth using new probe |
| per_vmc_6cm_newprobe_4 | % | The fourth % VMC measurement at 6 cm depth using new probe |
| probe_period_6cm_newprobe_4 | text | Probe period of the fourth % VMC measurement at 6 cm depth using new probe |
| per_vmc_6cm_newprobe_5 | % | The fifth % VMC measurement at 6 cm depth using new probe |
| probe_period_6cm_newprobe_5 | text | Probe period of the fifth % VMC measurement at 6 cm depth using new probe |
| per_vmc_av_6cm_new | % | Averaged % VMC measurement at 6 cm depth using new probe |
| probe_period_av_6cm_new | text | Averaged probe period at 6 cm depth using new probe |
| per_vmc_calibrated_6cm_new | % | Calibrated % VMC measurement at 6 cm depth using new probe |
| per_vmc_12cm_newprobe_1 | % | The first % VMC measurement at 12 cm depth using new probe |
| probe_period_12cm_newprobe_1 | text | Probe period of the first % VMC measurement at 12 cm depth using new probe |
| per_vmc_12cm_newprobe_2 | % | The second % VMC measurement at 12 cm depth using new probe |
| probe_period_12cm_newprobe_2 | text | Probe period of the second % VMC measurement at 12 cm depth using new probe |
| per_vmc_12cm_newprobe_3 | % | The third % VMC measurement at 12 cm depth using new probe |
| probe_period_12cm_newprobe_3 | text | Probe period of the third % VMC measurement at 12 cm depth using new probe |
| per_vmc_12cm_newprobe_4 | % | The fourth % VMC measurement at 12 cm depth using new probe |
| probe_period_12cm_newprobe_4 | text | Probe period of the fourth % VMC measurement at 12 cm depth using new probe |
| per_vmc_12cm_newprobe_5 | % | The fifth % VMC measurement at 12 cm depth using new probe |
| probe_period_12cm_newprobe_5 | text | Probe period of the fifth % VMC measurement at 12 cm depth using new probe |
| per_vmc_av_12cm_new | % | Averaged % VMC measurement at 12 cm depth using new probe |
| probe_period_av_12cm_new | text | Averaged probe period at 12 cm depth using new probe |
| per_vmc_calibrated_12cm_new | % | Calibrated % VMC measurement at 12 cm depth using new probe |
| per_vmc_20cm_newprobe_1 | % | The first % VMC measurement at 20 cm depth using new probe |
| probe_period_20cm_newprobe_1 | text | Probe period of the first % VMC measurement at 12 cm depth using new probe |
| per_vmc_20cm_newprobe_2 | % | The second % VMC measurement at 12 cm depth using new probe |
| probe_period_20cm_newprobe_2 | text | Probe period of the second % VMC measurement at 12 cm depth using new probe |
| per_vmc_20cm_newprobe_3 | % | The third % VMC measurement at 12 cm depth using new probe |
| probe_period_20cm_newprobe_3 | text | Probe period of the third % VMC measurement at 12 cm depth using new probe |
| per_vmc_20cm_newprobe_4 | % | The fourth % VMC measurement at 12 cm depth using new probe |
| probe_period_20cm_newprobe_4 | text | Probe period of the fourth % VMC measurement at 12 cm depth using new probe |
| per_vmc_20cm_newprobe_5 | % | The fifth % VMC measurement at 12 cm depth using new probe |
| probe_period_20cm_newprobe_5 | text | Probe period of the fifth % VMC measurement at 12 cm depth using new probe |
| per_vmc_av_20cm_new | % | Averaged % VMC measurement at 20 cm depth using new probe |
| probe_period_av_20cm_new | text | Averaged probe period at 20 cm depth using new probe |
| per_vmc_calibrated_20cm_new | % | Calibrated % VMC measurement at 20 cm depth using new probe |
| notes_soilmoisture | text | Additional information of soil moisture measurements |
| photo_north | text | ID of the photo taken towards the north of the 10 m x 10 m plot |
| photo_south | text | ID of the photo taken towards the south of the 10 m x 10 m plot |
| photo_east | text | ID of the photo taken towards the east of the 10 m x 10 m plot |
| photo_west | text | ID of the photo taken towards the west of the 10 m x 10 m plot |
| photo_nadir | text | ID of the photo taken at nadir of the 10 m x 10 m plot |
| photo_other | text | IDs of other photos related to the 10 m x 10 m plot |
| photo_other_desc | text | Description of "Photo_Other" |
Application and Derivation
The Alaskan tundra experiences a large number of small fires with shorter return intervals. This study examined the impact of single and repeated fires on vegetation and soil properties compared to unburned areas. The data can be used in studies focused on soil ecosystem functioning, permafrost, and climate change.
Quality Assessment
Dual blind entries for data were implemented to identify and correct errors from the process of transcribing field datasheets.
Data Acquisition, Materials, and Methods
Study Sites
The data were collected during three field campaigns at sites with active fire activity located in the Noatak River Valley, Seward Peninsula, and North Slope regions in Alaska. The field campaigns were conducted from July to August in the years 2016, 2017, and 2018.

Figure 2. Location of field sites in Alaska, U.S.
Fire Variables
The potential field sites were determined a priori using a suite of fire indices and topographic variables. Burned and unburned areas were identified within fire perimeters recorded in the Alaska Large Fire Database (ALFD; available at https://blm-egis.maps.arcgis.com/apps/MapSeries/index.html?appid=32ec4f34fb234ce58df6b1222a207ef1). Plots were established at random points at locations of 24 individual fires spanning the 1971–2015 fire seasons and covered combinations of fire properties and drainage categories.
Landsat satellite imagery data (available at https://earthexplorer.usgs.gov/) were used to calculate the indices of fire severity. Using one clear image taken during the next growing season after an identified fire, two fire indices were used to identify burned areas and classify burn severity. For fires pre-1982, Tasseled-Cap Greenness (Kauth and Thomas, 1976) was used to identify burned and unburned areas. For fires post-1982, the Normalized Burn Ratio following methods described in Loboda et al. (2013) was used.
The Burn Severity Index was assigned using the tundra-specific methodology (Loboda et al., 2013). Fire frequency and years since the last burn was calculated for both burned and unburned areas using the ALFD and Landsat imagery (He et al., 2021).
Topographic Variables
Four categories were developed for drainage types as in Kasischke and Hoy (2012); elevation, and slope and flow accumulation (calculated using a digital elevation model (Carswell, 2013).
- flat, poorly drained (slope<2 degrees & flow accumulation>0)
- flat, drained (slope<2 degrees & flow accumulation=0)
- moderately drained (slope≥2 degrees & flow accumulation>0)
- well-drained (slope≥2 degrees & flow accumulation=0)
Sampling
The final set of sites was selected using a stratified random sampling scheme, with purposeful oversampling due to anticipated limiting factors the field team may experience once on the ground such as time and physical accessibility. A total of 197 sites were visited (159 burned, 33 unburned) and sampled by establishing a 10 m x 10 m plot. Each plot included a smaller 1 m x 1 m plot in the southeast corner of the site or within 2 m diameter of the transect points. Tussock measurements include the closest tussocks to the SE corner. Soil temperature, soil volumetric moisture content, air temperature, and relative humidity were measured at these 1 m2 small plots while vegetation characteristics were measured across the 100 m2 plot. In addition, 632 point locations were sampled along transects in the vicinity of the plots (Fig. 3) where soil temperature, air temperature, and active layer thickness were measured.
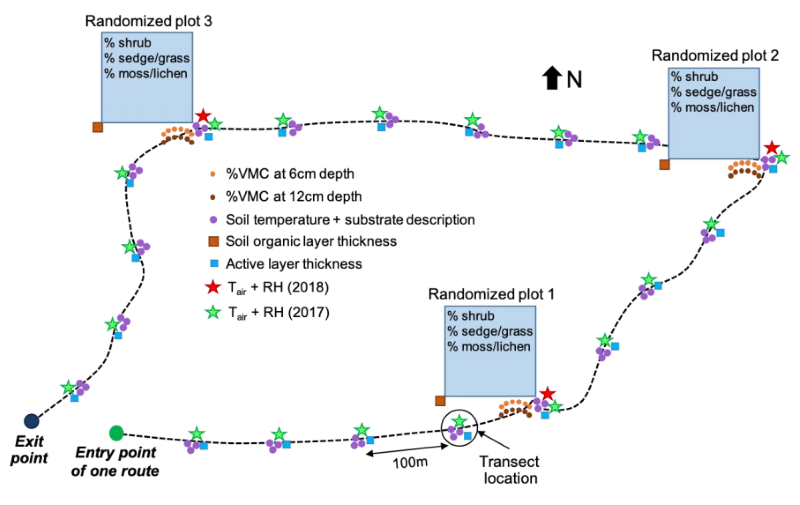
Figure 3. Representative layout of 10 m x 10 m field plots and points sampled along a transect in the same vicinity.
Field measurements included active layer depth, soil temperature, and weather. Different measurements were conducted in plots versus transect points. Soil temperature measurements were recorded using a Hanna digital soil thermometer. Soil moisture was measured using a Campbell Scientific Hydrosense II probe. Soil moisture estimates (%VMC) were calibrated using the equation:
% VWC = A*(Probe Period)2 + B*(Probe Period) + C
Calibration equations were developed (in a laboratory setting) using a total of 22 samples taken during the field campaigns (Jenkins, 2019). Weather data were recorded using Ambient Weather WM-4 digital stations.
Refer to He et al. (2021) for additional information.
Data Access
These data are available through the Oak Ridge National Laboratory (ORNL) Distributed Active Archive Center (DAAC).
Burned and Unburned Field Site Data, Noatak, Seward, and North Slope, AK, 2016-2018
Contact for Data Center Access Information:
- E-mail: uso@daac.ornl.gov
- Telephone: +1 (865) 241-3952
References
Carswell Jr., W.J. 2013. The 3D Elevation Program: summary for Alaska, Fact Sheet. Reston, VA. https://doi.org/10.3133/fs20133083
He, J., D. Chen, L. Jenkins, and T.V. Loboda. 2021. Impacts of wildfire and landscape factors on organic soil properties in Arctic tussock tundra. Environmental Research Letters 16:085004. https://doi.org/10.1088/1748-9326/ac1192
Jenkins, L. 2019. Multi-Scale Detection and Characterization of Physical and Ecological Change in the Arctic Using Satellite Remote Sensing, Chapter 4: Determination of Synthetic Aperture Radar Backscatter in the Tundra as a Function of Fire and Biophysical Parameters. Doctoral Dissertation. University of Michigan. http://hdl.handle.net/2027.42/151574
Kasischke, E.S., and E.E. Hoy. 2012. Controls on carbon consumption during Alaskan wildland fires. Global Change Biology 18:685-699. https://doi.org/10.1111/j.1365-2486.2011.02573.x
Kauth, R. J., and G.S. Thomas. 1976. The tasselled cap--a graphic description of the spectral-temporal development of agricultural crops as seen by Landsat. LARS Symposia Paper 159. https://docs.lib.purdue.edu/lars_symp/159
Loboda, T.V., N.H. French, C. Hight-Harf, L. Jenkins, and M.E. Miller. 2013. Mapping fire extent and burn severity in Alaskan tussock tundra: An analysis of the spectral response of tundra vegetation to wildland fire. Remote Sensing of Environment 134:194-209. https://doi.org/10.1016/j.rse.2013.03.003