Documentation Revision Date: 2018-09-07
Data Set Version: 1
Summary
Field measurements were recorded at 493 points along nine transects traversing plateaus found on the coastal plain (at 1-m intervals over permafrost and 5-m over non-permafrost areas) and recording thaw depth, permafrost thickness, surface water depth, and ecotype based on dominant vegetation, hydrologic, and thermokarst features. Additionally, observations of the presence/absence of permafrost were recorded at 333 non-transect points in adjacent areas.
LiDAR data collected in 2009 were used to derive an elevation map (DEM) that delineated the boundaries of the plateaus on the coastal plain that, in combination with the thaw-depth measurements, were used to produce a permafrost distribution map. To create a permafrost probability map, elevations were extracted at each transect thaw-depth sample point. The extracted elevations were modeled against the presence or absence of permafrost at each point and the model was used to predict permafrost occurrence.
To augment the LiDAR analysis, an IKONOS image from August 27, 2007 was incorporated with the LiDAR data into a Random Trees (RT) classifier. To improve upon the LiDAR distribution map, the RT classification was trained using the thaw-depth sample points along the transects and area visual interpretation and validated using the 333 presence/absence points.
There are seven data files with this dataset including four maps in GeoTIFF (.tif) format, one measurement file in comma-separated (.csv) format, and two compressed shapefiles (.zip). The data in the shapefiles are provided as companion files in .kmz format for viewing in Google Earth. Photos of the study area transects are also provided in a companion file.
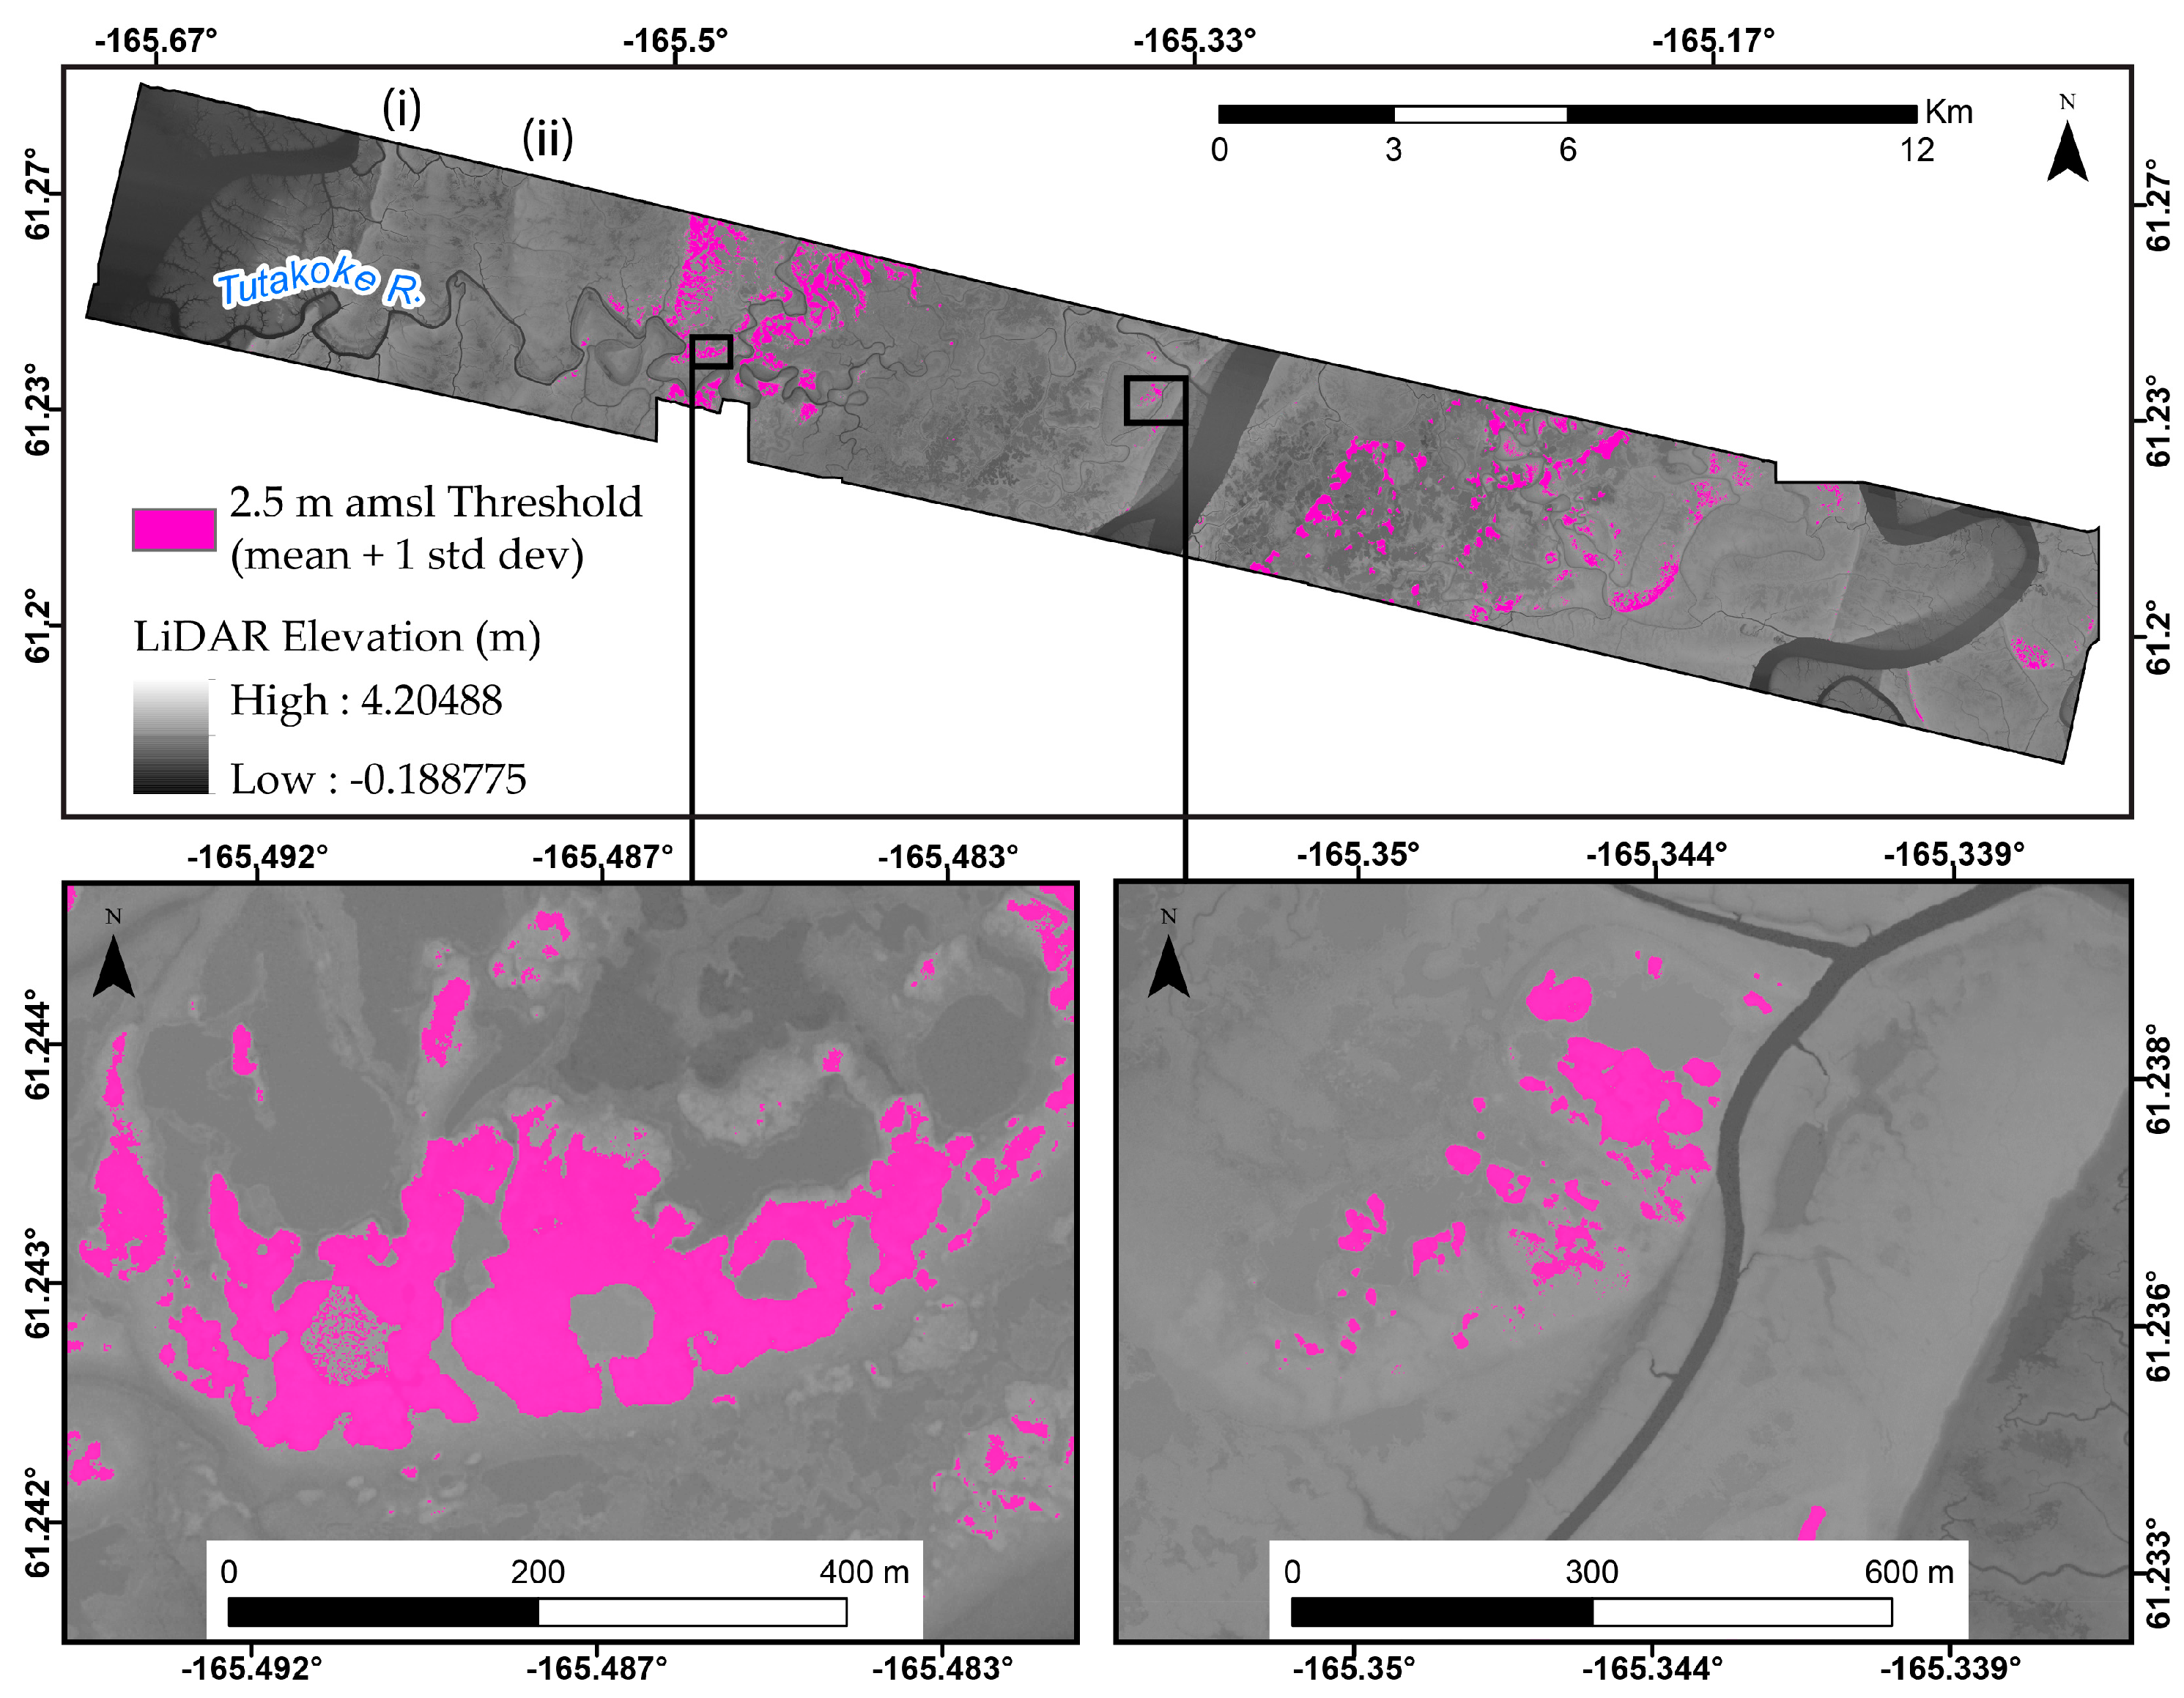
Figure 1. High-resolution map of permafrost distribution created using the 2.5 m amsl (mean + 1 SD) threshold for the entire 2009 LiDAR swath. The insets show detail for areas of high elevation (left) and relative low elevation (right) (Whitley et al., 2018).
Citation
Whitley, M., G. Frost, M.T. Jorgenson, M. Macander, C.V. Maio, and S.G. Winder. 2018. ABoVE: Permafrost Measurements and Distribution Across the Y-K Delta, Alaska, 2016. ORNL DAAC, Oak Ridge, Tennessee, USA. https://doi.org/10.3334/ORNLDAAC/1598
Table of Contents
- Data Set Overview
- Data Characteristics
- Application and Derivation
- Quality Assessment
- Data Acquisition, Materials, and Methods
- Data Access
- References
Data Set Overview
This dataset provides field observations of thaw depth and dominant vegetation types, a LiDAR-derived elevation map, and permafrost distribution and probability maps for an area on the coastal plain of the Yukon-Kuskokwim Delta (YKD), in western Alaska, USA. Field data were collected during July 8-17, 2016 to parameterize and to validate the derived permafrost maps. The YKD is in the sporadic to isolated permafrost zone where permafrost forms extensive elevated plateaus on abandoned floodplains. The region is extremely flat and vulnerable to eustatic sea-level rise and inland storm surges. These high-resolution permafrost maps support landscape change analyses and assessments of the impacts of climate change on permafrost in this region of high biological productivity, critical wildlife habitats, and subsistence-based human economy.
Project: Arctic-Boreal Vulnerability Experiment
The Arctic-Boreal Vulnerability Experiment (ABoVE) is a NASA Terrestrial Ecology Program field campaign based in Alaska and western Canada between 2016 and 2021. Research for ABoVE links field-based, process-level studies with geospatial data products derived from airborne and satellite sensors, providing a foundation for improving the analysis and modeling capabilities needed to understand and predict ecosystem responses and societal implications.
Related Publication:
Whitley, M. A., G. V. Frost, M. T. Jorgenson, M. J. Macander, C. V. Maio, and S. G. Winder. 2018. Assessment of LiDAR and spectral techniques for high-resolution mapping of sporadic permafrost on the Yukon-Kuskokwim Delta, Alaska. Remote Sensing 10(2), 258. https://doi.org/10.3390/rs10020258
Acknowledgements
This research was supported by NASA Award NNH16CP09C as part of the ABoVE field campaign.
Data Characteristics
Spatial Coverage: Tutakoke River, Yukon-Kuskokwim Delta, Alaska
ABoVE Reference Locations:
Domain: Core ABoVE
State/territory: Alaska
Grid cell(s): Ahh0Avv0Bh1Bv3
Spatial resolution: 1-5 m
Temporal coverage: Field data were collected from 2016-07-08 to 2016-07-17. Lidar data were collected on 2009-06-02. The IKONOS image (not provided) was from 2007-08-27.
Temporal resolution: One time
Study Areas (All latitude and longitude given in decimal degrees)
| Site | Westernmost Longitude | Easternmost Longitude | Northernmost Latitude | Southernmost Latitude |
|---|---|---|---|---|
| Yukon-Kuskokwim Delta, Alaska | -165.69 | - 165.03 | 61.29 | 61.17 |
Transect Locations: Beginning and ending coordinates for the thaw-depth measurement transects.
- Coordinates are provided in both latitude and longitude (WGS84) and UTM easting and northing (NAD 1983, UTM Zone 3N).
- Measurements were made along each transect every 1 m over permafrost and 5 m over non-permafrost.
- It is easier to separate the measurement points with Easting and Northing in meters rather than latitude and longitude.
- Only Easting and Northing are provided in the measurement data file.
| Transect number | Transect length | Measurement count | Measurement ID | Longitude | Latitude | Easting UTM | Northing UTM |
|---|---|---|---|---|---|---|---|
| 1 | 0 | 0 | -165.503006 | 61.2504005 | 473008.9332 | 6790781.807 | |
| 1 | 68 | 45 | 44 | -165.5019989 | 61.2504005 | 473076.7923 | 6790786.183 |
| 2 | 1 | 45 | -165.4989929 | 61.2549019 | 473249.2222 | 6791280.554 | |
| 2 | 75 | 63 | 107 | -165.496994 | 61.2550011 | 473322.7027 | 6791289.307 |
| 3 | 0 | 108 | -165.496994 | 61.2510986 | 473321.0302 | 6790862.877 | |
| 3 | 100 | 49 | 156 | -165.496994 | 61.2519989 | 473346.6902 | 6790959.529 |
| 4 | 0 | 157 | -165.5010071 | 61.2288017 | 473083.7552 | 6788376.063 | |
| 4 | 50 | 28 | 184 | -165.5019989 | 61.2290001 | 473039.9903 | 6788400.242 |
| 5 | 0 | 185 | -165.5050049 | 61.2318993 | 472875.4452 | 6788725.936 | |
| 5 | 50 | 33 | 217 | -165.5039978 | 61.2321014 | 472922.713 | 6788742.238 |
| 6 | 0 | 218 | -165.503006 | 61.2370987 | 473019.9162 | 6789304.453 | |
| 6 | 88 | 77 | 294 | -165.5010071 | 61.2369003 | 473104.9655 | 6789281.856 |
| 7 | 0 | 295 | -165.5299988 | 61.2402992 | 471554.815 | 6789667.324 | |
| 7 | 50 | 51 | 345 | -165.5310059 | 61.2402 | 471506.7237 | 6789653.641 |
| 8 | 0 | 346 | -165.4839935 | 61.2397995 | 474029.5753 | 6789592.385 | |
| 8 | 130 | 80 | 425 | -165.4850006 | 61.2388992 | 473947.7469 | 6789491.37 |
| 9 | 0 | 426 | -165.4869995 | 61.237999 | 473859.8583 | 6789394.832 | |
| 9 | 66 | 67 | 492 | -165.4880066 | 61.2374992 | 473825.83 | 6789338.281 |
Data File Information
There are seven data files with this dataset including one measurement file in comma-separated (.csv) format, two compressed shapefiles (.shp in .zip format), and four maps in GeoTIFF (.tif) format.
Table 1. Data file names and descriptions
| File name | Description |
|---|---|
| PermafrostDepth_Fielddata_2016.csv | A comma-separated (.csv) file with measurements at 493 locations |
| Tutakoke_Permafrost_Plateau_Transects.zip | A compressed shapefile (.shp) with the 493 measurement locations |
| Tutakoke_permafrost_validation.zip | A compressed shapefile (.shp) with 333 validation permafrost locations as 0 if permafrost was present, or 1 if no permafrost |
| Elevation.tif | LIDAR DEM |
| Permafrost_Extent_Elevation_Threshold.tif | A map of permafrost distribution created using a 2.5 m a.m.s.l. (mean + 1 SD) threshold for the entire 2009 LiDAR swath |
| Permafrost_Predicted_Probability.tif | A map of the probability of near-surface permafrost as predicted by 0.1 m elevation bins |
| Permafrost_Extent_Random_Trees.tif | Permafrost map created from LiDAR data integrated with IKONOS imagery into a Random Trees (RT) classifier, trained with thaw-depth sample points along transects |
Field Measurements
The field data are provided in .csv and .shp formats. The variables are described below.
Data Dictionary
User Notes: Thaw depth (frost_top) measurements were made from the surface, where surface was defined as either the top of the vegetation present, or soil if no vegetation was present. If standing water was present at the surface, the thaw depth was measured by reaching down through the water to the surface to mark the thaw depth on the probe. Water_depth is not included in the frost_top or frost_bottom values.
Data not applicable or missing are recorded as -9999.
Table 2. Variables in the file PermafrostDepth_Fielddata_2016.csv
| Column name | Units/format | Description |
|---|---|---|
| FID | Id number | |
| transect | Transect number | |
| distance | m | Spot of measurement distance in meters from the transect start. Transect length- ranging from 50 to 130 m |
| trans_distance | Transect number and transect length concatenated | |
| Easting | X coordinate for measurement location is Easting, UTM Zone 3N. See spatial data information below. | |
| Northing | Y coordinate for measurement location is Northing, UTM Zone 3N. See spatial data information below. | |
| ecotype | Ecotypes present along the transects | |
| permafrost | 0 or 1 | Permafrost presence or absence; 0 stands for no permafrost found within 125 cm of the surface, and 1 stands for permafrost found within 125 cm of the surface. See user note above. |
| frost_top | cm | Depth to the top of frost from the surface, measured in cm. Measurements were made with a 1.25 m probe. A value of 125 signifies that no frost was found within 125 cm of the surface. frost_top_depth_flag is set to GT. See user note above. |
| frost_top_depth_flag | Flag=GT (for Greater Than, '>') when frost_top measurement value is reported but the actual depth exceeded the length of the probe (125 cm). Greater than (>) was originally reported. | |
| frost_bottom | cm | Depth to the bottom of frost measured in cm, if the frost was soft enough to break through with a thaw probe. A value of -9999 signifies that no measurement was made because there was no frost encountered in the top 125 cm or the frost was too hard to break through with a thaw probe. |
| frost_bottom_depth_flag | Flag=GT (for Greater Than, '>'). A GT flag (>) was added to denote that *frost bottom measurement* was at least that deep, but could not be recorded further. Greater than (>) was originally reported. | |
| frost_thickness | cm | Frost thickness calculated where both frost_top and frost_bottom measurements were obtained (frost_bot - frost_top). A value of -9999 signifies no calculation could be made due to no frost being found within the top 125 cm or no measurement for the frost bottom was obtained because the frost was too thick or too hard to break through. |
| frost_thickness_flag | Flag=GT (for Greater Than, '>'). A GT flag was added to denote that *frost thickness measurement* was at least that deep, but could not be recorded further. Greater than (>) was originally reported. | |
| water_depth | cm | The depth of any standing water found at the surface measured in cm. A value of -9999 signifies there was no water at the surface or it was not measured. |
| photos | Photos taken along the transects. These are available in the companion file Permafrost_Thaw_Depth_YK_transect_fieldwork_pictures.zip | |
| notes | Field notes |
Table 3. Spatial Data Information for measurement point coordinates
| Projected Coordinate System: NAD_1983_UTM_Zone_3N Projection: Transverse_Mercator False_Easting: 500000.00000000 False_Northing: 0.00000000 Central_Meridian: -165.00000000 Scale_Factor: 0.99960000 Latitude_Of_Origin: 0.00000000 Linear Unit: Meter Geographic Coordinate System: GCS_North_American_1983 Datum: D_North_American_1983 Prime Meridian: Greenwich Angular Unit: Degree |
Table 4. Variables in the shapefile Tutakoke_Permafrost_Plateau_Transects.shp
For units and a description of the variables, refer to the descriptions in the above file PermafrostDepth_Fielddata_2016.csv.
| Variables |
|---|
| Transect |
| Distance |
| Trans_Dist |
| Permafrost |
| Frost_Top |
| Frost_Bot |
| Frost_Thic |
| H2O_Depth |
| Ecotype |
| Notes |
| Photos |
Table 5. Variables in the permafrost validation file Tutakoke_permafrost_validation.shp
| The only variable is permafrost, with a value of 0 indicating no permafrost, or 1 indicating the presence of permafrost. |
Table 6. Coordinates of the shapefile Tutakoke_permafrost_validation.shp
| Northernmost Latitude | Southernmost Latitude | Westernmost Longitude | Easternmost Longitude |
|---|---|---|---|
| 61.25879 | 61.23433 | -165.619 | -165.484 |
GeoTIFF (.tif) files
Table 7. Individual GeoTIFF information
| File name | Variable Units/Map units | Data type | Min-max values | No data value |
|---|---|---|---|---|
| Permafrost_Extent_Random_Trees.tif | None/meters | Byte | 0 - 2 | 255 |
| Permafrost_Extent_Elevation_Threshold.tif | None/meters | Byte | 5 - 7 | 15 |
| Permafrost_Predicted_Probability.tif | Percent/meters | Byte | 4 -100 | -128 |
| Elevation.tif | Meters/meters | Float 32 | -0.1- 4.2 | -9999 |
Table 8. Spatial information for GeoTIFFs
| Proj: NAD_1983_UTM_Zone_3N, North_American_Datum_1983 Spheroid: GRS 1980,6378137,298.2572221010042 AUTHORITY: EPSG, 7019; AUTHORITY: EPSG, 6269 Primemem: Greenwich,0 Unit: degree, 0.0174532925199433 AUTHORITY: EPSG, 4269 Projection: Transverse_Mercator latitude_of_origin: 0 central_meridian: -165 scale_factor: 0.9996 false_easting: 500000 false_northing: 0 units: meter, 1 UTHORITY: EPSG, 9001; AUTHORITY: EPSG, 26903 |
Table 9. Companion files
| File name | Description |
|---|---|
| Permafrost_Thaw_Depth_YK_transect_fieldwork_pictures.zip | Photos taken along the transects. Photo I.D. numbers are provided in the .csv data file PermafrostDepth_Fielddata_2016.csv |
| Tutakoke_Permafrost_Plateau_Transects.kmz | A .kmz with the same data as the shapefile |
| Tutakoke_permafrost_validation.kmz | A .kmz with the same data as the shapefile |
| Permafrost_Thaw_Depth_YK.pdf | A pdf of this document |
Application and Derivation
These data could be useful to climate change studies. With increasing air and ground temperatures across the Arctic, monitoring permafrost degradation (e.g., thermokarst) is important for understanding processes at both the local and the larger regional and global scales. Since nearly half of Alaska lies within the zones of isolated permafrost (>0–10% permafrost landcover), sporadic permafrost (10–50%), or discontinuous permafrost (50–90%), large areas are at risk of being affected by permafrost thaw in the future (Whitley et al., 2018).
Quality Assessment
Validation from the 333 GPS points within the LiDAR swath showed that the LiDAR map achieved 94.9% total accuracy in mapping permafrost occurrence. Elevation was found to be a highly significant indicator of near-surface permafrost in the region. The model was 98.9% accurate in mapping areas without permafrost, but only 80.3% accurate in mapping areas without permafrost.
Data Acquisition, Materials, and Methods
Study Area
This study focused on the Yukon-Kuskokwim Delta (YKD) in western Alaska, south of the village of Chevak and west of Hazen Bay (Figure 2). The region is extremely flat and vulnerable to eustatic sea-level rise and inland storm surges. The landscape is in the sporadic to isolated permafrost zone, with a mean annual temperature in Bethel, AK at -1.2 degrees C. Permafrost in the area predominantly manifests on the abandoned floodplains.
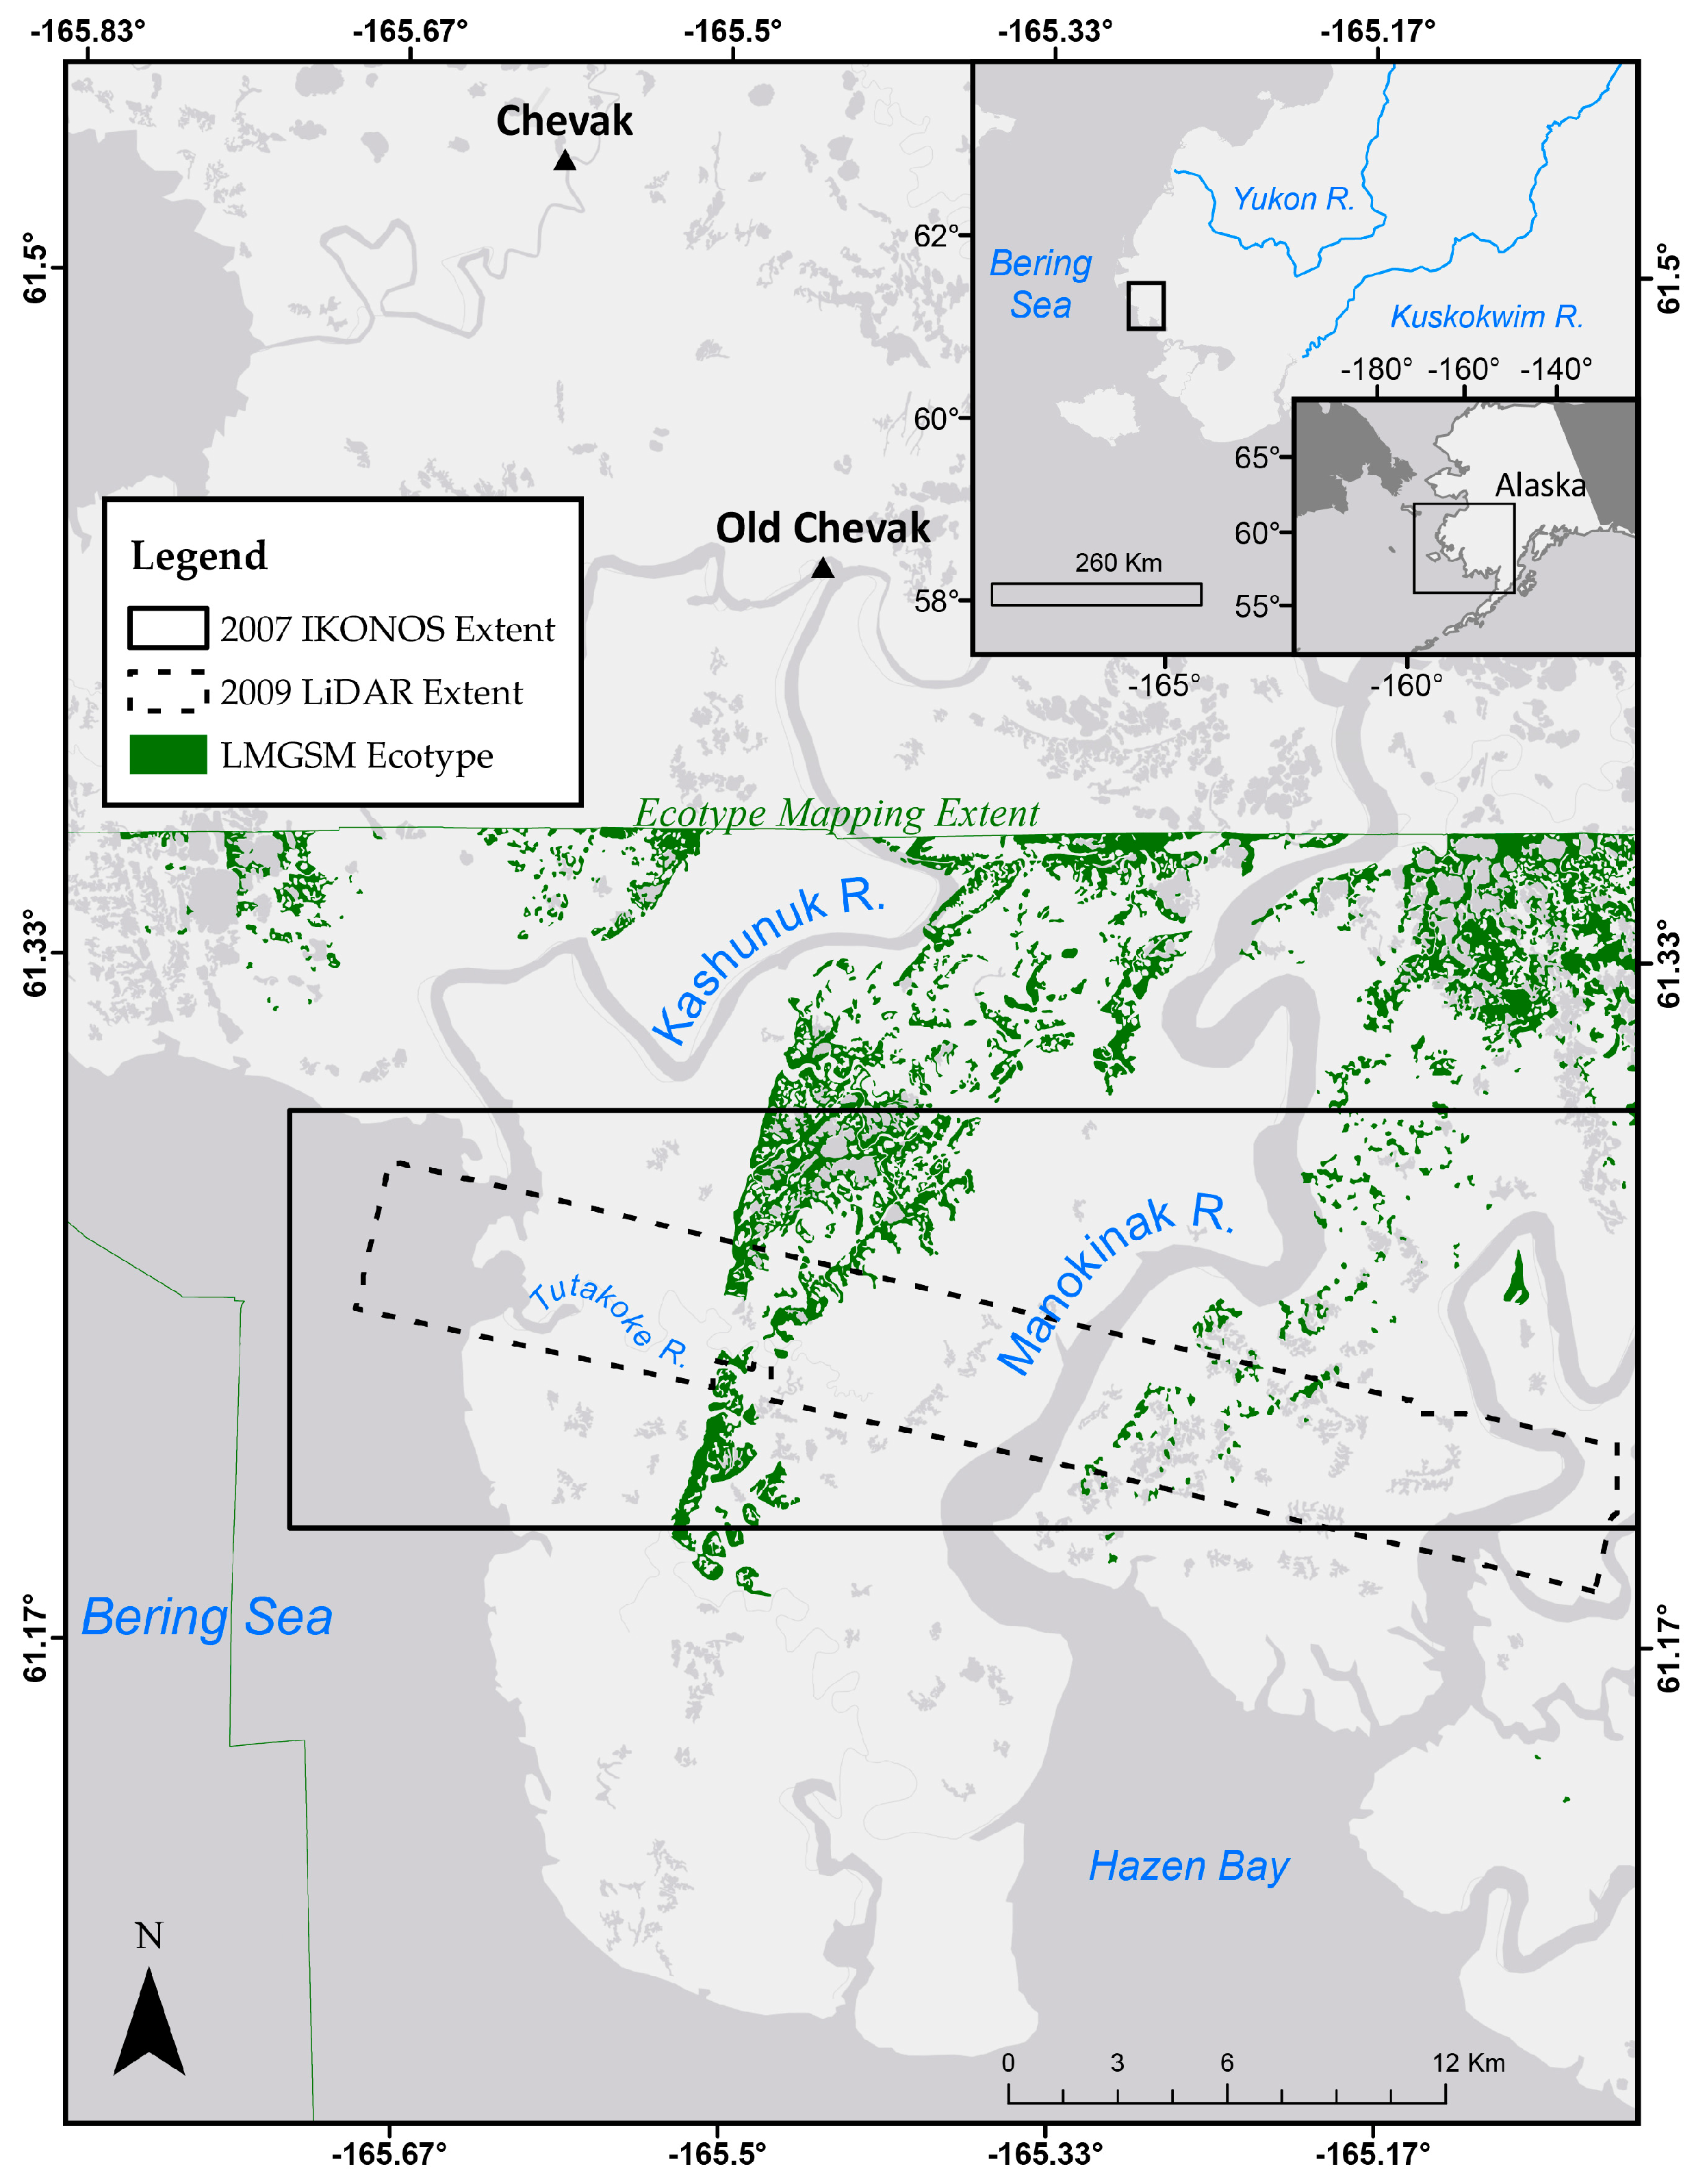
Figure 2. Study area located on the Yukon-Kuskokwim Delta (YKD) in western Alaska, USA (Whitley et al., 2018).
Field Measurements
Field data were collected during July 8–17, 2016, to support mapping analysis and validation. Transects running perpendicular to the boundary of permafrost plateaus were established subjectively according to topographic breaks, vegetation, presence of storm indicators (e.g., driftwood), and evidence of thermokarst (e.g., thermokarst pits, moats, thermo-erosional gullies). Field data were collected along nine transects, with transect lengths ranging from 50 to 130 m (Figure 3). Measurements were made along each transect every 1 m over permafrost and 5 m over non-permafrost using a 1.25 m thaw probe and a Delorme PN-60 GPS (coordinates were originally recorded in the WGS84 Geographic Coordinate System, but projected to match the raster data). When possible, frost thickness and/or permafrost was measured by breaking through frozen ground along the plateau margins. The surface was defined as the top of the vegetation present, or soil if no vegetation was present. If water was present, the thaw depths were calculated from reaching down to the surface (not the surface of the water; i.e. thaw depth + water depth = water surface to frost top). Since sampling was conducted in mid-July, seasonal frost was likely encountered in addition to the permafrost along these margins.
For validation, 333 GPS points and permafrost observations were collected opportunistically along the coast-inland gradient, separate from those collected along the transects. These validation points were later categorized as binary permafrost/non-permafrost for use in validating the map products.
The transect data were analyzed by ecotype and elevation. Similar ecotypes were grouped together to ensure a minimum sample size of at least 10 observations per ecotype. The ecotypes analyzed included: Lowland Moist Graminoid Shrub Meadow (LMGSM), Lowland Wet Graminoid ShrubMeadow (LWGSM), LowlandWet SedgeMeadow (LWSM), LowlandWet Sedge-ShrubMeadow (LWSSM), Riverine Moist Graminoid Shrub Meadow (RMGSM), Thermokarst Pits (TP), Water (W), and Wrack Lines (WL) from previous storm surges.
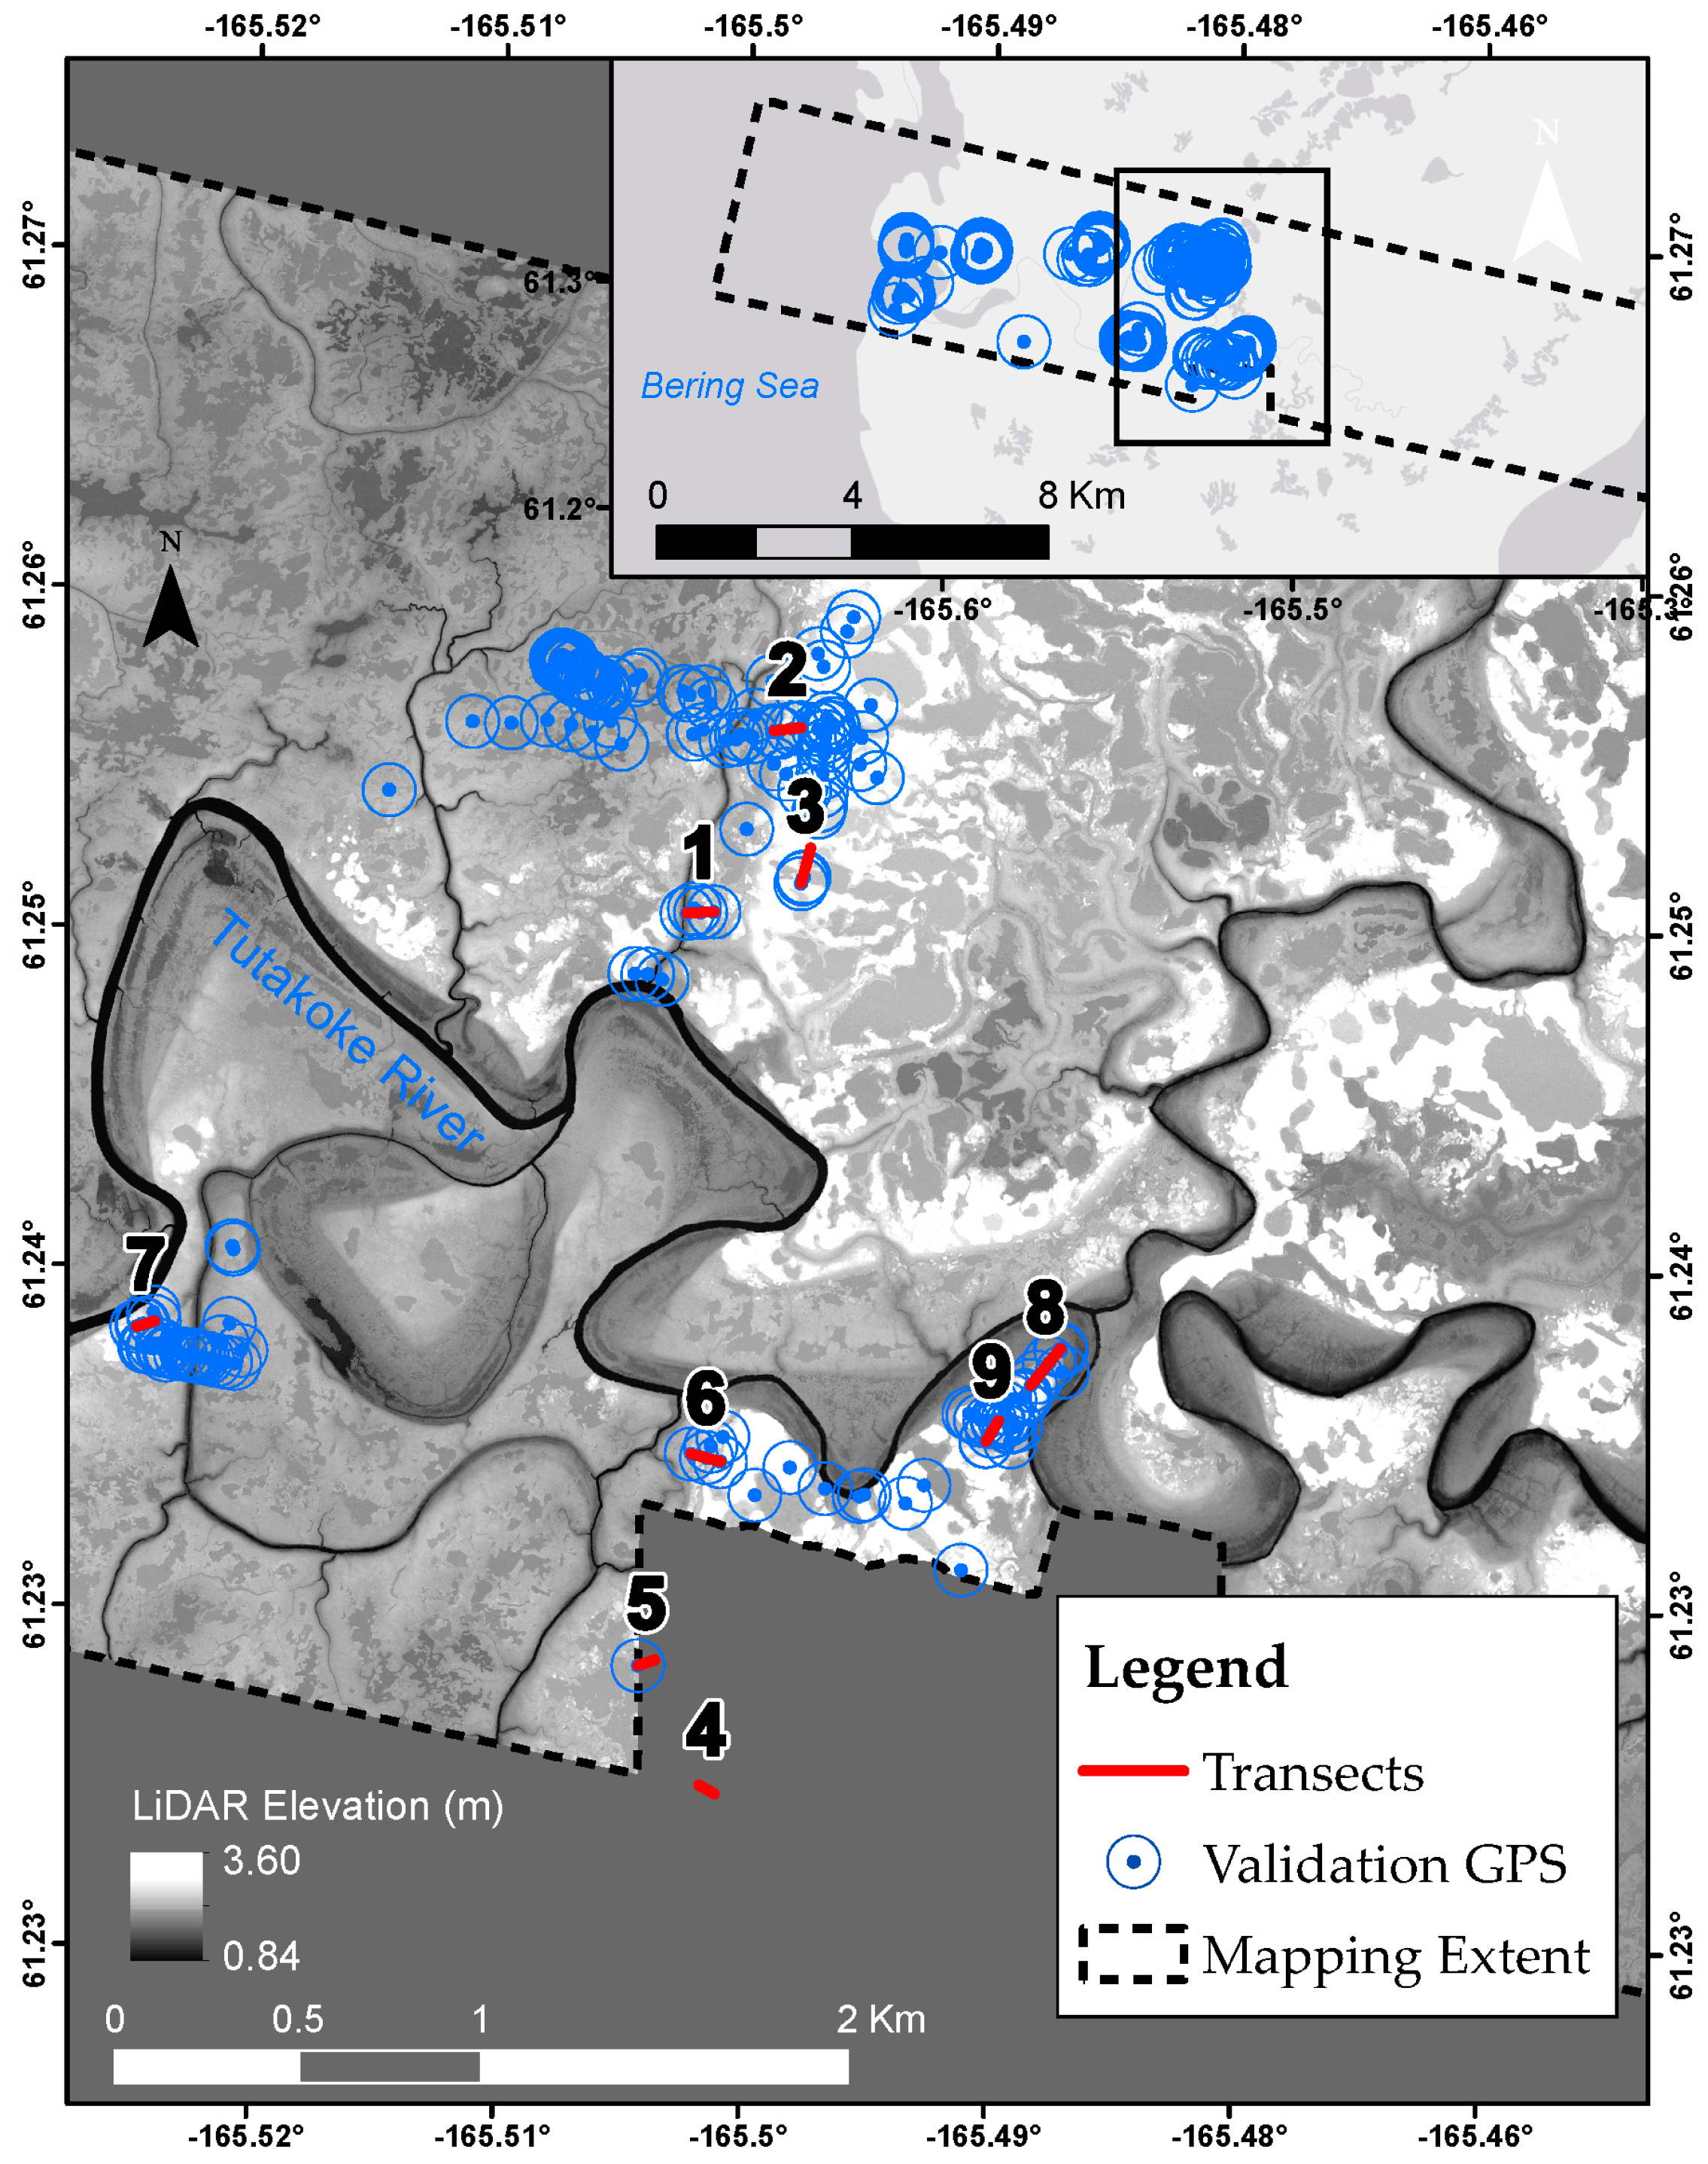
Figure 3. Transect locations and field validation sampling points, and the mapping extent (dashed line) near the Tutakoke River, YKD. Thaw depth transects (bold numbers) are in red, validation points used for spectral analysis are in black, and field points used for LiDAR analysis are in blue (Whitley et al., 2018).
LiDAR
A LiDAR mission flown between June 27 and July 2, 2009, by Kodiak Mapping, Inc. (Palmer, AK, USA) was the base dataset (Airborne Imaging, 2011) used for mapping (Figure 1). When processing the LiDAR data, only the last returns were considered to create a DEM with 1-m horizontal resolution and 0.05-m vertical resolution. The DEM was subsequently adjusted to elevation a.m.s.l. Mean sea level was calculated from a HOBO Data Logger tide gauge (Onset Computer Corporation; Bourne, MA, USA) deployed from July 28, 2009 to November 30, 2010; LiDAR data were tide-corrected (Whitley et al., 2018).
Permafrost Mapping
Using the corrected LiDAR dataset, elevations of the permafrost plateau margins were extracted at the points sampled along the transects in the field. This was performed through photo-interpretation of the transitions from permafrost plateau to coastal meadows using high-resolution imagery. To map permafrost extent in the LiDAR swath, a threshold was selected based upon mean elevation of the boundaries + 1 standard deviation (SD). This threshold was then used to create a binary mask of areas with permafrost (elevations above the threshold) and areas without permafrost (elevations below the threshold). The map was subsequently validated using the 333 GPS points and observations collected in the field that fell within the LiDAR swath. To augment the LiDAR analysis, an IKONOS image from August 27, 2007 was incorporated with the LiDAR data into a Random Trees (RT) classifier. The RT classification was trained using the thaw-depth sample points along the transects. A separate RT classification was conducted using IKONOS and LiDAR but was trained using manually delineated polygons (Whitley et al., 2018).
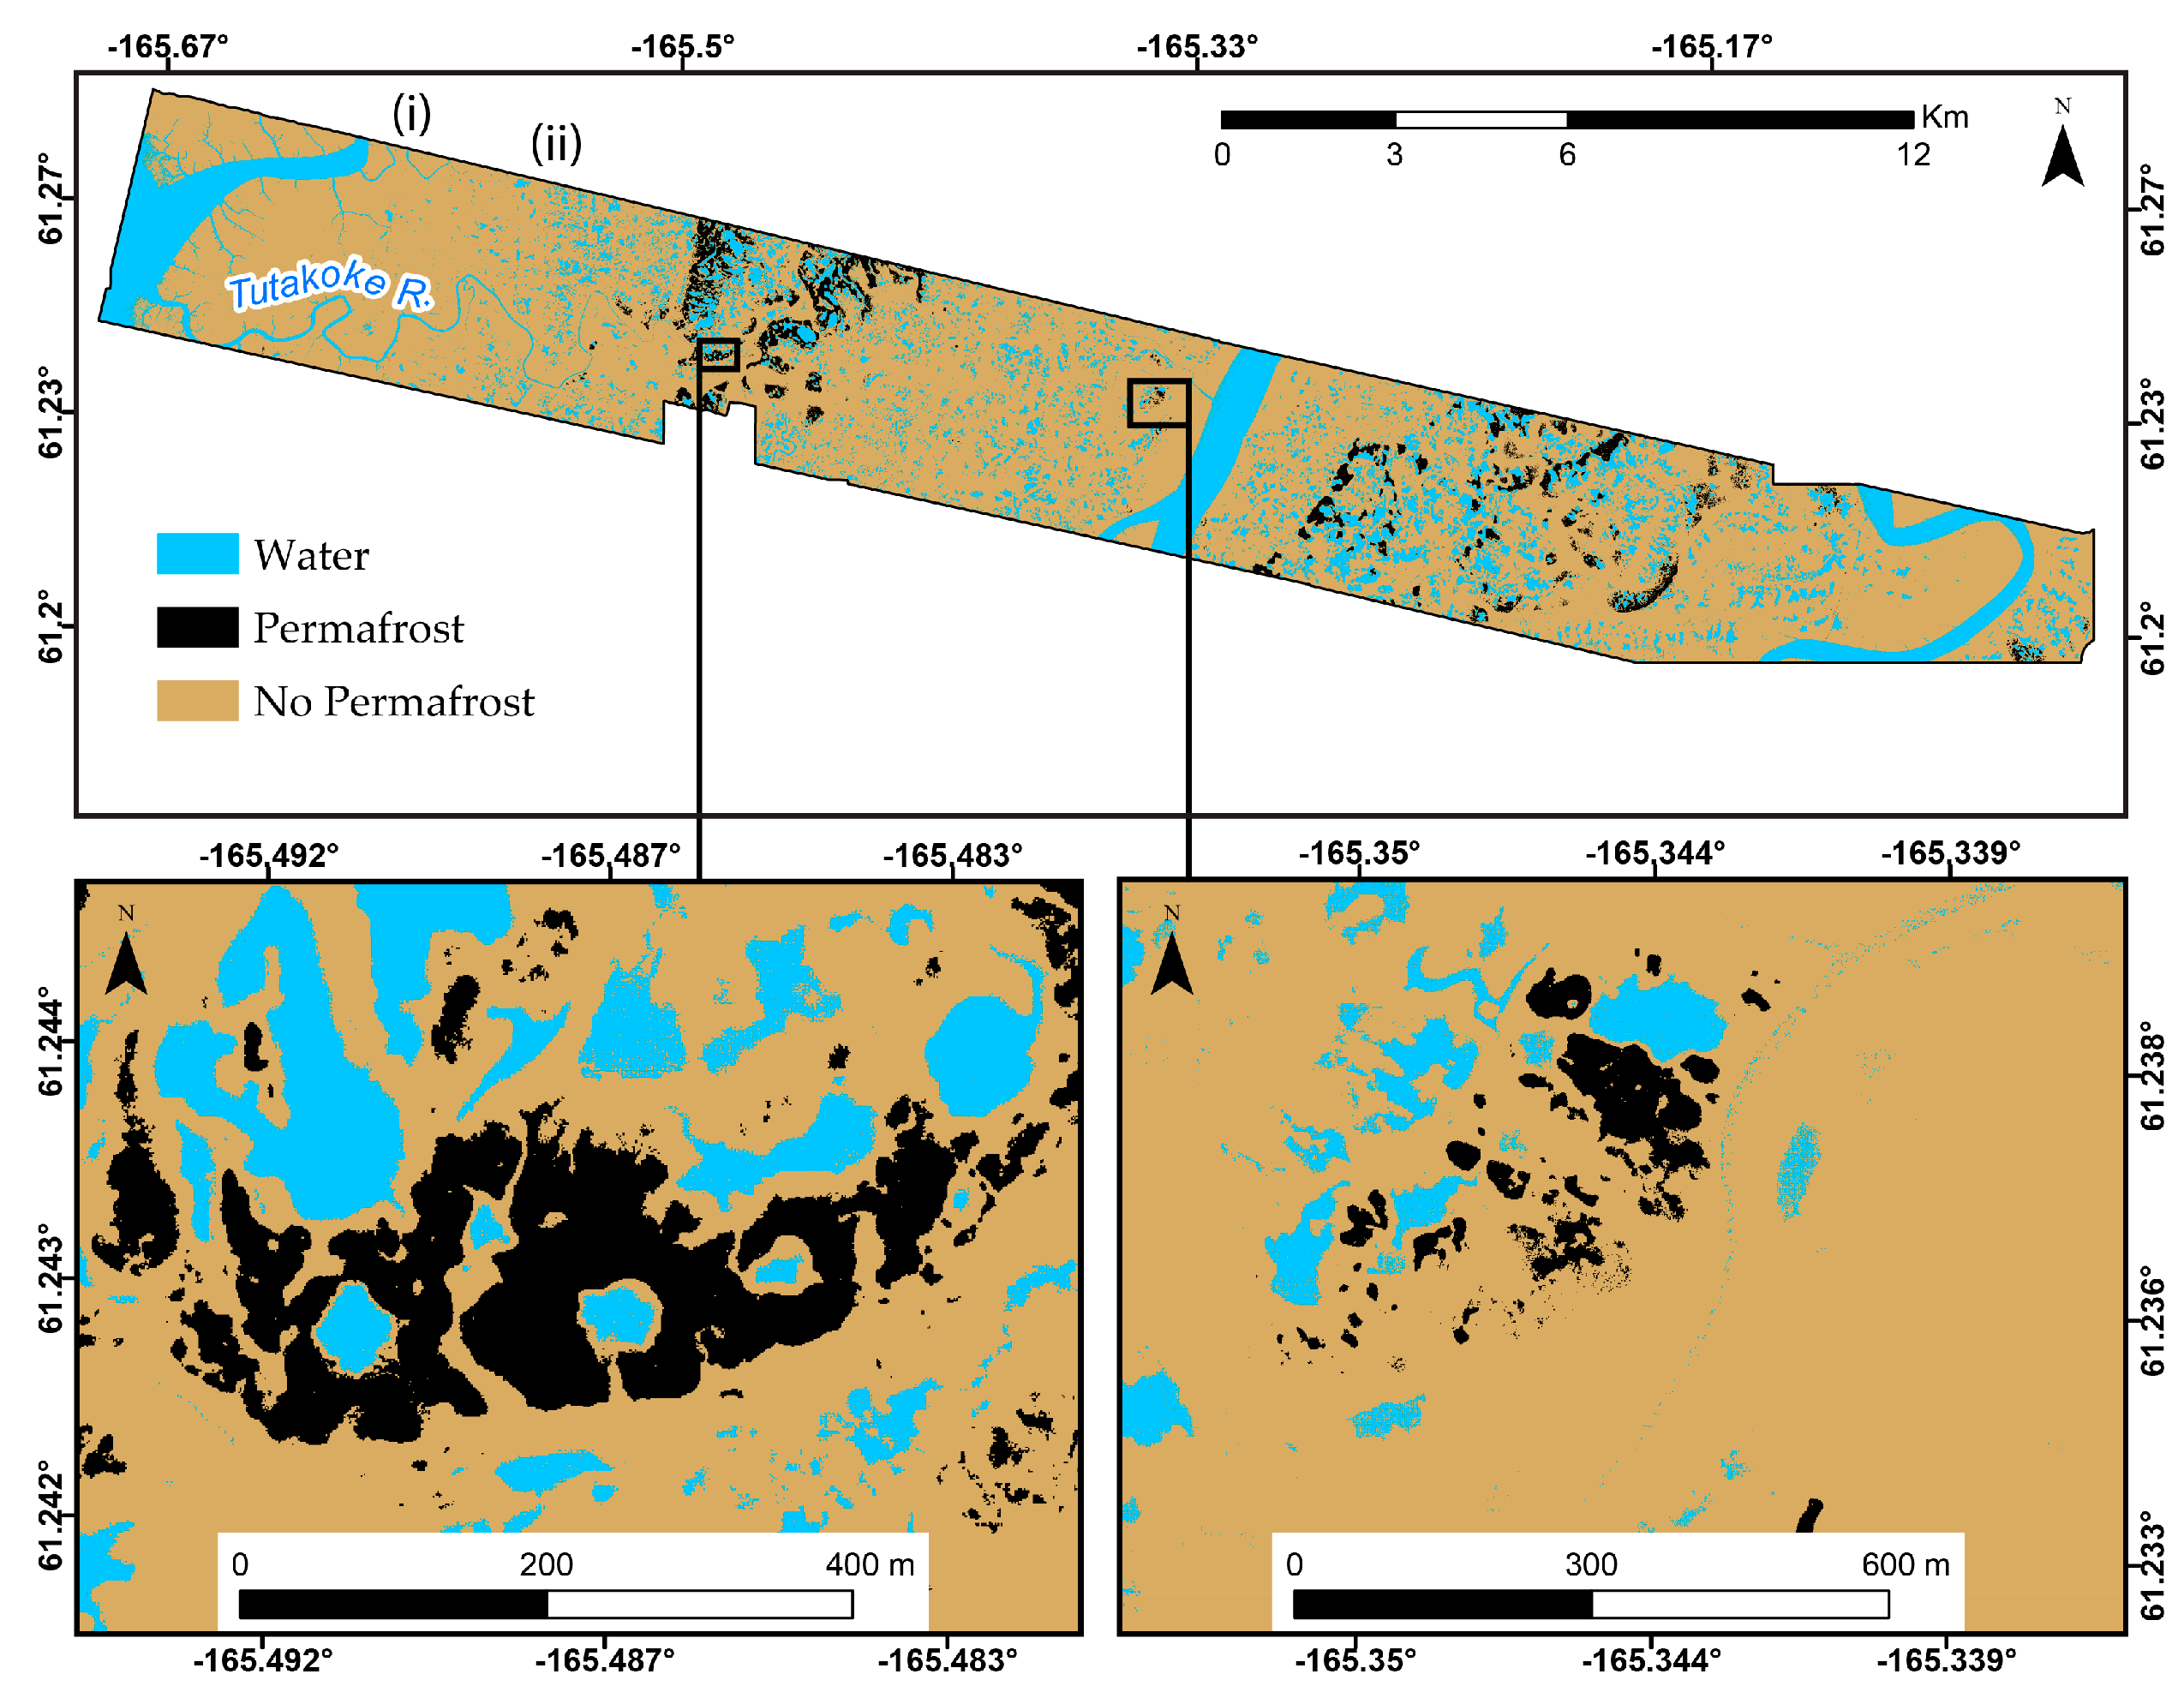
Figure 4. Permafrost map from integrated RT classification trained with visual interpretation of the landscape. The insets show detail for areas of relative high elevation (left) and relative low elevation (right). Transitions between the mudflat and active floodplain deposit (i), and the active and inactive floodplain deposits (ii) are also shown (Whitley et al., 2018).
Permafrost Probability Mapping
The relationship between elevation and permafrost occurrence was analyzed using logistic regression by assessing whether or not permafrost was encountered at each thaw-depth sample point along the transects (not just those on the boundaries of the plateaus). Elevations were extracted from the LiDAR DEM at each thaw-depth sample point and modeled against the presence or absence of permafrost at each point. The resulting model was used to predict the probability of permafrost occurrence in 0.1 m elevation bins that spanned all observed elevations. This resulted in a permafrost probability map that quantifies the uncertainty of whether or not permafrost is present (Whitley et al., 2018).
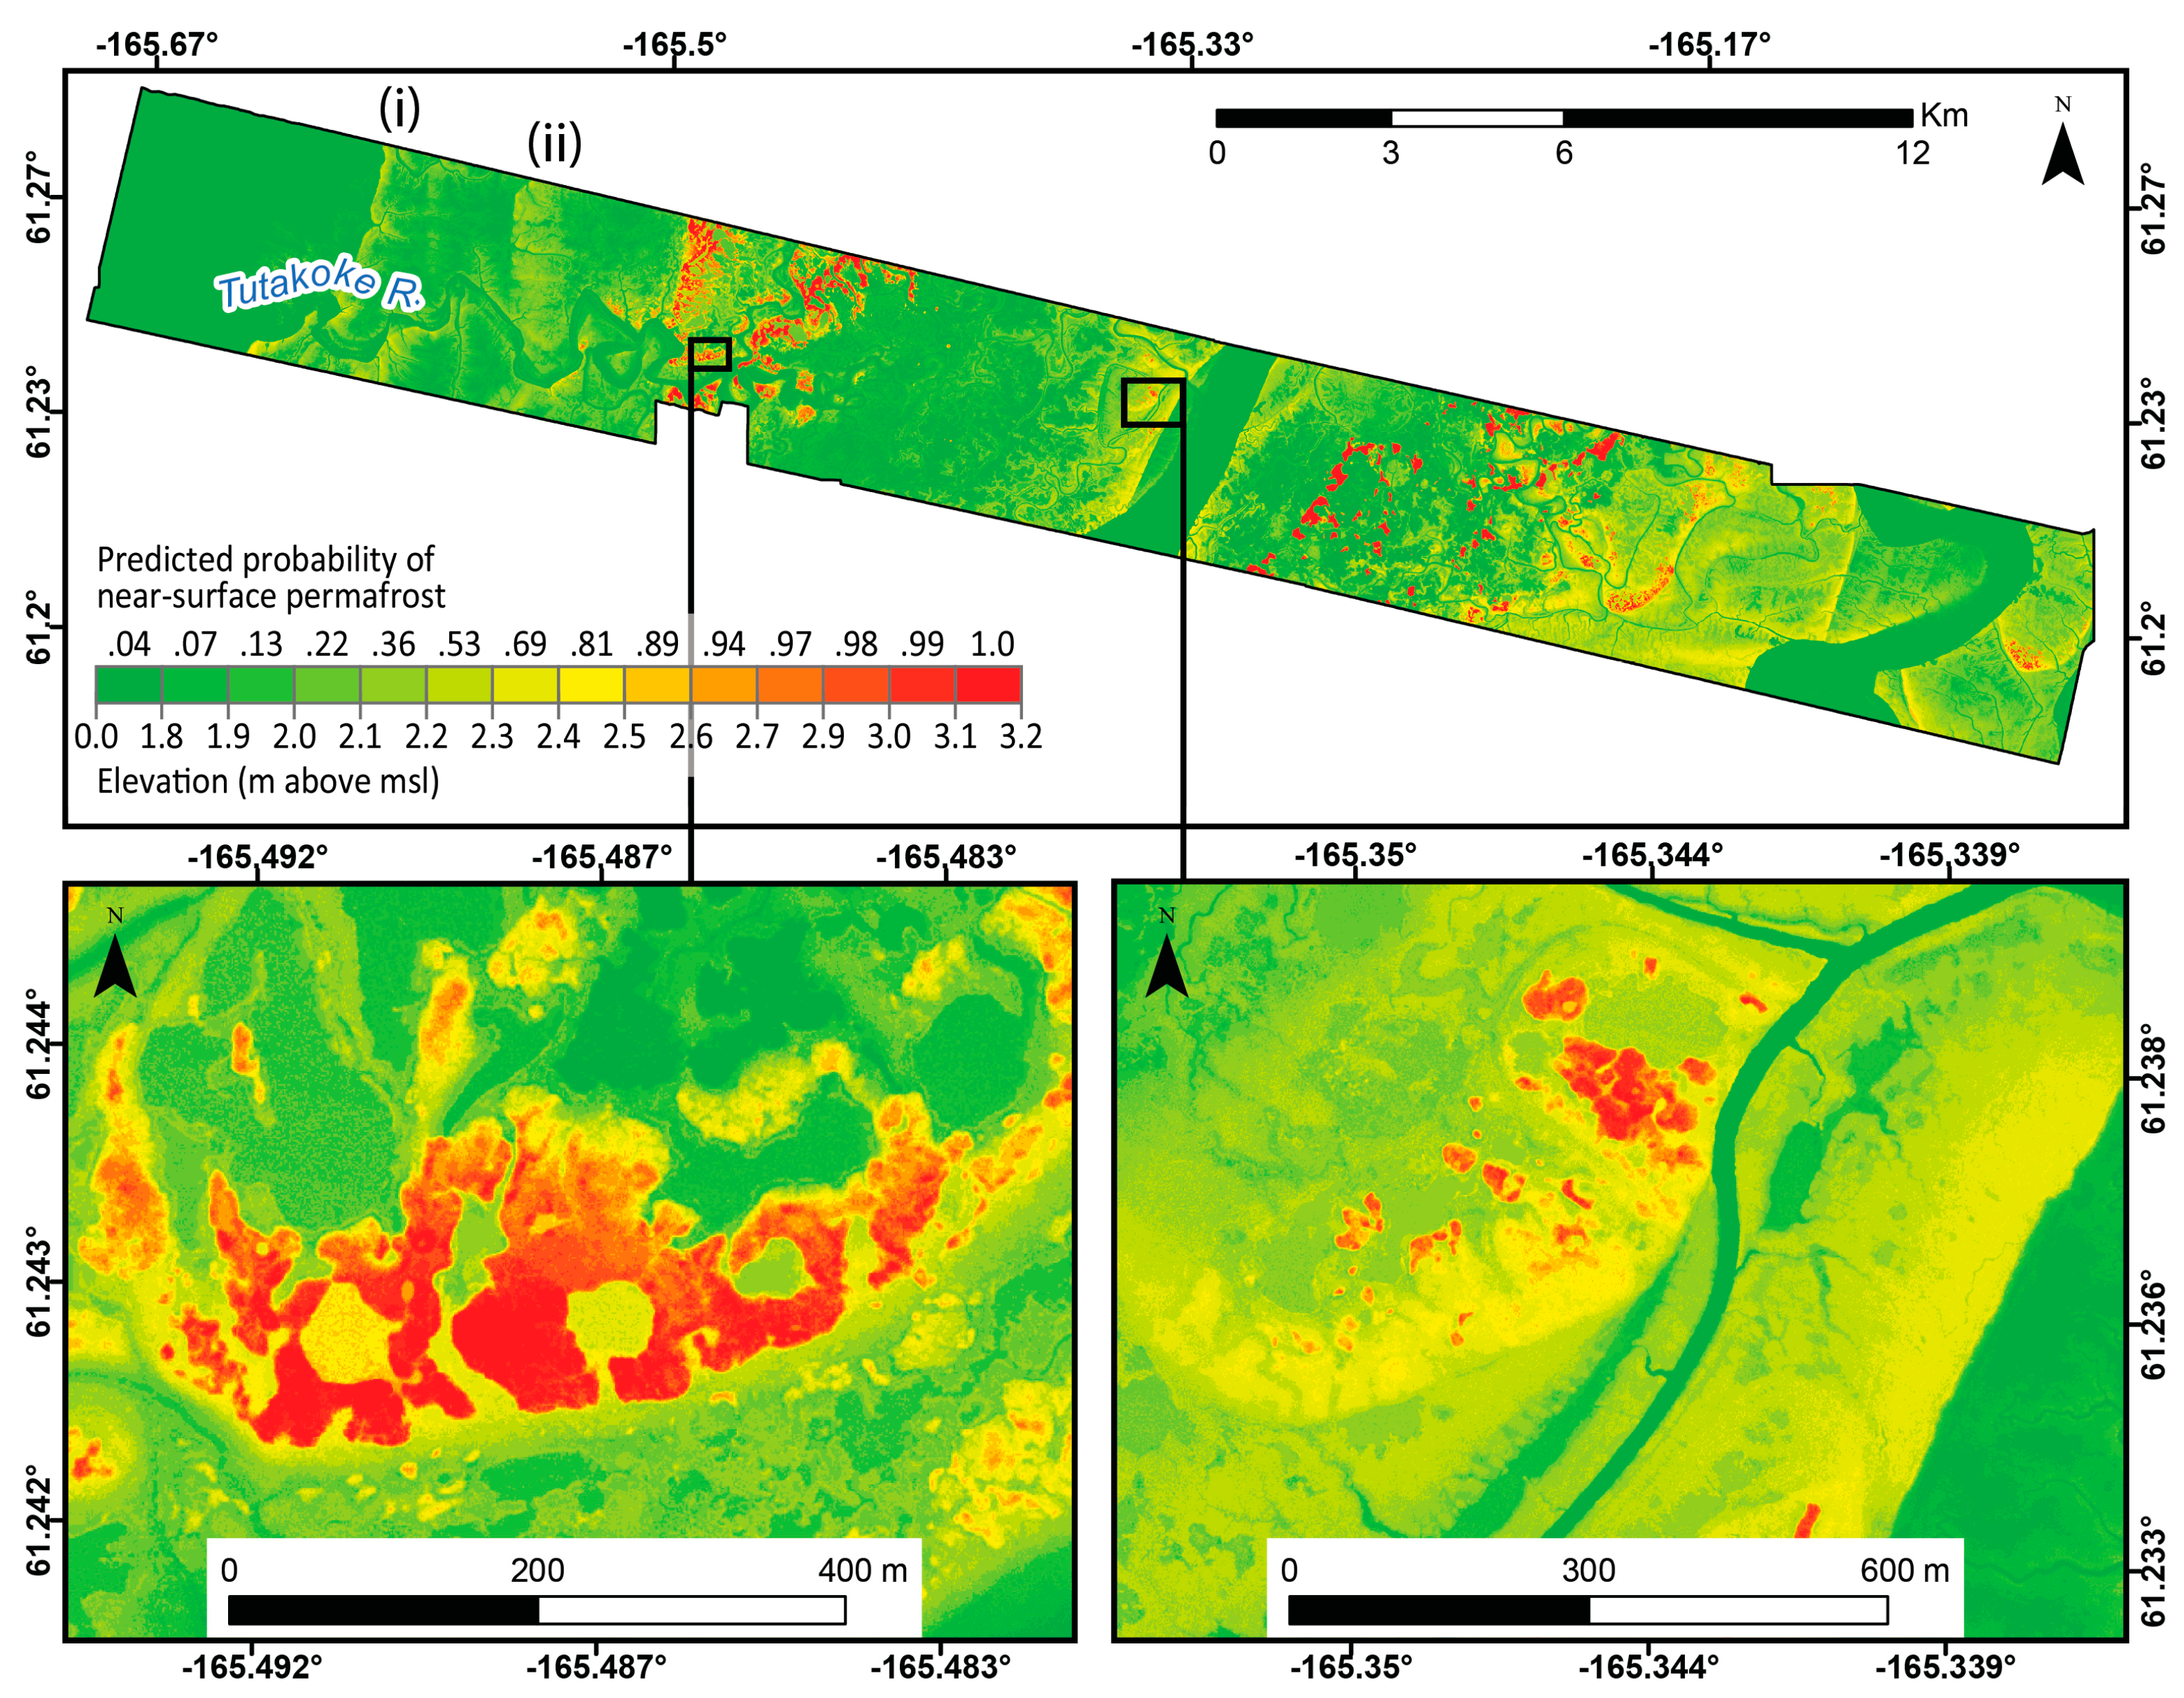
Figure 5. Map of predicted near-surface permafrost probability calculated by 0.1 m elevation bins for the entire 2009 LiDAR swath. The insets show detail for areas of relative high elevation (left) and relative low elevation (right) (Whitley et al., 2018).
Data Access
These data are available through the Oak Ridge National Laboratory (ORNL) Distributed Active Archive Center (DAAC).
ABoVE: Permafrost Measurements and Distribution Across the Y-K Delta, Alaska, 2016
Contact for Data Center Access Information:
- E-mail: uso@daac.ornl.gov
- Telephone: +1 (865) 241-3952
References
Airborne Imaging. Final LiDAR processing & vertical accuracy report: Prepared for the U.S. Fish and Wildlife Service. In LiDAR Imagery & DEM Model for Yukon Delta National Wildlife Refuge—Near Angyaravak Bay, Alaska; Airborne Imaging: Calgary, AB, Canada, 2011; p. 28.
Whitley, M. A., G. V. Frost, M. T. Jorgenson, M. J. Macander, C. V. Maio, and S. G. Winder. 2018. Assessment of LiDAR and spectral techniques for high-resolution mapping of sporadic permafrost on the Yukon-Kuskokwim Delta, Alaska. Remote Sensing 10(2), 258. https://doi.org/10.3390/rs10020258