Documentation Revision Date: 2020-07-20
Dataset Version: 1
Summary
There are six data files in comma separated value (*.csv) format provided with this dataset: two files with soil characterization data for five sites and four files with active layer thickness data for four sites.

Figure 1. Site sampling plan used for characterizing active layer soils (left). Axes are in meters. At Imnavait Creek, active layer thickness (ALT) was measured on transects intersecting a central soil pit. Soil dielectric properties, in situ moisture and temperature profiles were measured, and soil samples were collected for analyses from the soil pit (right).
Citation
Bakian-Dogaheh, K., R.H. Chen, M. Moghaddam, Y. Yi, and A. Tabatabaeenejad. 2020. ABoVE: Active Layer Soil Characterization of Permafrost Sites, Northern Alaska, 2018. ORNL DAAC, Oak Ridge, Tennessee, USA. https://doi.org/10.3334/ORNLDAAC/1759
Table of Contents
- Dataset Overview
- Data Characteristics
- Application and Derivation
- Quality Assessment
- Data Acquisition, Materials, and Methods
- Data Access
- References
Dataset Overview
This dataset provides in situ soil measurements including soil dielectric properties, temperature, and moisture profiles, active layer thickness (ALT), and measurements of soil organic matter, bulk density, porosity, texture, and coarse root biomass. Samples were collected from the surface to permafrost table in soil pits at selected sites along the Dalton Highway in Northern Alaska. From North to South, the study sites include Franklin Bluffs, Sagwon, Happy Valley, Ice Cut, and Imnavait Creek. Measurements were made from August 22 to August 26, 2018. The purpose of the field campaign was to characterize the dielectric properties of permafrost active layer soils in support of the NASA Arctic and Boreal Vulnerability Experiment (ABoVE) Airborne Campaign.
Project: Arctic-Boreal Vulnerability Experiment
The Arctic-Boreal Vulnerability Experiment (ABoVE) is a NASA Terrestrial Ecology Program field campaign based in Alaska and western Canada between 2016 and 2021. Research for ABoVE links field-based, process-level studies with geospatial data products derived from airborne and satellite sensors, providing a foundation for improving the analysis and modeling capabilities needed to understand and predict ecosystem responses and societal implications.
Related Datasets
Additional Hydrology and Permafrost ABoVE datasets archived at the ORNL DAAC provide similar observations at other sites.
Acknowledgments
Funding was provided by Terrestrial Ecology Grant NNX17AC65A and NASA Earth and Space Science Fellowship Grant 80NSSC18K1410.
Data Characteristics
Spatial Coverage: Five sites in Northern Alaska along the Dalton Highway: Franklin Bluffs, Sagwon, Happy Valley, Ice Cut, and Imnaviat Creek.
ABoVE Reference Locations
Domain: Core
State/Territory: Alaska
Grid cells: Ah01Av00.Bh08Bv03.Ch48Cv21, Ah01Av00.Bh08Bv03.Ch50Cv20, Ah01Av00.Bh08Bv03.Ch51Cv19, Ah01Av00.Bh08Bv03.Ch52Cv18
Spatial Resolution: Point locations
Temporal Coverage: 2018-08-22 to 2018-08-26
Temporal Resolution: Daily one time measurements
Study Area: Latitude and longitude are given in decimal degrees.
| Site | Westernmost Longitude | Easternmost Longitude | Northernmost Latitude | Southernmost Latitude |
|---|---|---|---|---|
| Northern Alaska, USA | -149.5 | -148.4 | 69.9 | 68.5 |
| Franklin Bluffs | -148.766 | -148.766 | 69.81237 | 69.81237 |
| Sagwon | -148.564 | -148.564 | 69.47958 | 69.47958 |
| Happy Valley | -148.509 | -148.509 | 69.18333 | 69.18333 |
| Ice Cut | -148.827 | -148.825 | 69.04193 | 69.04189 |
| Imnavait Creek | -149.306 | -149.306 | 68.60497 | 68.60497 |
Data File Information
There are six data files in comma-separated value (*.csv) format provided with this dataset: two files with soil characterization data for five sites and four files with active layer thickness data for four sites. The companion file Data_Descriptions_with_Equations.pdf provides data descriptions and equations used to derive the soil physical and dielectric properties.
Table 1. File names and descriptions
| File Name | Description |
|---|---|
| soil_physical_properties.csv | This file provides soil characterization data for 102 samples collected from eight soil pits at five study sites. |
| soil_dielectric_profiles.csv | This file provides 144 soil electric conductivity, temperature, and dielectric permittivity measurements made at eight soil pits in five study sites. |
active layer thickness (ALT)
|
These files provide active layer thickness measured along transects at four sites. See site-specific plans in Section 5. No ALT measurements were collected at Happy Valley. |
Table 2. Variables in the file soil_physical_properties.csv. Equations used to derive the soil physical properties are included in the companion file Data_Descriptions_with_Equations.pdf.
| Column Name | Units | Description |
|---|---|---|
| soil_pit_number |
Soil pit number, where the soil sample was collected. Includes Site abbreviation: FB = Franklin Bluffs, SGW = Sagwon, HV = Happy Valley, ICC = Ice Cut, and IMN = Imnaviat Creek |
|
| pit_sample_id | Samples were collected adjacent together at each depth. Sample ID denotes two adjacent samples. | |
| sampling_date | YYYY-MM-DD | Date samples were collected |
| latitude | decimal degrees | Latitude in decimal degrees of the site |
| longitude | decimal degrees | Longitude in decimal degrees of the site |
| min_depth | cm | Minimum sampling depth |
| max_depth | cm | Maximum sampling depth |
| field_wet_mass | g | Weight of the wet soil samples in the field |
| dry_mass | g | Weight of the soil sample after 48 hours of oven-drying at 65 °C |
| moisture_mass | g | Difference of Field_Wet_Mass and Dry_Mass |
| sample_volume | cm3 | Volume of the sampling container |
| sample_volumetric_water_content | cm3/ cm3 | Volumetric water content of the soil sample |
| field_bulk_density | g/ cm3 | Bulk density of the soil sample in the field |
| porosity | cm3/ cm3 | Porosity of the soil sample |
| saturation_water_fraction | Fraction of saturation of the sample | |
| coarse_root_biomass_fraction | g/g (%) | Gravimetric fraction of the sample with dimension > 2mm over the entire dry sample |
| fine_organic_mineral _fraction | g/g (%) | Gravimetric fraction of the sample with 0.15mm < dimension < 2 mm over the entire dry sample |
| soil_fraction | g/g (%) | Gravimetric Fraction of the sample with 0.15mm > dimension over the entire dry sample |
| soil_organic_matter_fraction | g/g (%) | Soil organic matter content, loss on ignition over the samples < 2mm |
| total_organic_matter_fraction | g/g (%) | Total organic matter content |
| gravel | g/g (%) | Gravel fraction (>2mm) |
| sand | g/g (%) | Sand fraction, analyzed through hydrometer method |
| silt | g/g (%) | Silt fraction, analyzed through hydrometer method |
| clay | g/g (%) | Clay fraction, analyzed through hydrometer method |
| soil_type | Type of mineral soil according to soil classification |
Table 3. Variables in the file soil_dielectric_profiles.csv. Equations used to derive the soil dielectric properties are included in the companion file Data_Descriptions_with_Equations.pdf.
| Column Name | Units | Description |
|---|---|---|
| soil_pit_number | Soil pit number, where the soil sample was collected. Includes Site abbreviation: FB = Franklin Bluffs, SGW = Sagwon, HV = Happy Valley, ICC = Ice Cut, and IMN = Imnaviat Creek | |
| sampling_date | YYYY-MM-DD | Date samples were collected |
| latitude | decimal degrees | Latitude in decimal degrees of the site |
| longitude | decimal degrees | Longitude in decimal degrees of the site |
| sampling_depth | cm | Sampling depth |
| adc_count | The analog-to-digital converter (ADC) count to measure the permittivity as provided by the (ProCheck) data logger. Sometimes referred to as Raw ADC count. Manual included as a companion file. | |
| electrical conductivity | mS/cm | Electrical Conductivity measured using the (TEROS 12) sensor and (ProCheck) data logger |
| temperature | Deg C | Temperature as measure by the (TEROS 12) sensor |
| permittivity_70 mhz |
Dielectric permittivity as derived by equation 8 from the TEROS11-12 manual to transfer Raw ADC count to dielectric permittivity. Equation 8: ε = (2.887 × 10⁻⁹× RAW3−2.080 × 10⁻⁵× RAW2+5.276 × 10⁻²× RAW−43.39)2 where RAW = raw senor output. The TEROS11-12 manual is included as a companion file. |
|
| loss_70mhz | Effective loss factor at 70MHz |
Table 4. Variables in the site active layer thickness data files: franklin_bluffs_alt.csv, ice_cut_alt.csv, imnavait_creek_alt.csv, and sagwon_alt.csv. See the site plan figures in Section 5 to visualize how the transects and soil pits intersect at a given site. No ALT measurements were collected at Happy Valley.
| Column Name | Units | Description |
|---|---|---|
| site | Measurement Site. Abbreviations: FB = Franklin Bluffs, SGW = Sagwon, ICC = Ice Cut, and IMN = Imnaviat Creek | |
| sample_date | YYYY-MM-DD | Date samples were collected |
| latitude | decimal degrees | Latitude in decimal degrees of the site and measurement points. Mostly the same value because site is small. |
| longitude | decimal degrees | Longitude in decimal degrees of the site and measurement points. Mostly the same value because site is small. |
| transect | Transect as defined for each site, e.g., N-S, E-W, NE-SW, NW-SE, etc. See site-specific figures in Section 5. | |
| measurement_traverse | Direction taken by investigator along a transect to make measurements, e.g., N to S, E to W, NE to SW, NW to SE, etc. See site-specific figures in Section 5. | |
| measurement_order | Sequential measurement number along each transect. See site-specific figures in Section 5. | |
| measurement_purpose | Purpose of each measurement, either general plot characterization or for characterizing a soil pit (soil pit focus, i.e., at six measurement locations along a transect closest to a soil pit). See site-specific figures in Section 5. | |
| alt | cm | Active layer thickness. Note that ALT values for site soil pits are repeated. That is, the ALT measurement for a given soil pit is repeated when a transect intersects the soil pit. See site-specific figures in Section 5. |
| alt_fl | Identifies the locations that are soil pit measurements or may have been covered by water (e.g., Soil pit FB-1 or water). See site-specific figures in Section 5. |
Application and Derivation
Soil dielectric properties, soil moisture, organic matter content, root biomass, and other soil physical properties, along with active layer thickness (ALT), are key variables for understanding the dynamics of the permafrost active layer under the regional warming trends in the Arctic area. Remote sensing modeling initially starts and is developed based on field (in situ) observations. This dataset provides a unique and comprehensive characterization of soil properties that can be utilized in support of NASA Arctic and Boreal Vulnerability Experiment (ABoVE) Airborne Campaign (AAC). The site locations were carefully selected to capture different landscapes within two benchmarks AAC legacy flight lines known as Deadhorse and Toolik. Furthermore, the parameters from Franklin Bluffs were concurrent with an August 2018 ABoVE L-band flight and can be used for calibration activities.
Quality Assessment
Two adjacent samples (Fig. 3, a and b) were collected at each horizon to make sure the measurement procedures were reliable. This is based on the assumption that two separate samples collected at the same horizon will have similar properties.
Field instruments were calibrated according to manufacturers' recommendations. Soil texture analysis and soil organic matter measurement followed standard methods for the characterization of soils (Ward Laboratories). Other soil physical properties have been measured according to well-established procedures with necessary modifications for some variables. A journal article is under preparation for further analysis of the measured data and quality assessment.
Data Acquisition, Materials, and Methods
Geo-physical characterization of northern Alaska arctic permafrost active layer soils was conducted at site locations in August of 2018. Measurements included in situ profiles of soil moisture and temperature parameters and lab analyses of soil samples for organic matter content, bulk density, and other physical soil characteristics. Selected sites are along the Dalton Highway in Northern Alaska. From North to South, the study sites included Franklin Bluffs, Sagwon, Happy Valley, Ice Cut, and Imnavait Creek. The parameters from Franklin Bluffs were concurrent with an August 2018 ABoVE L-band flight.
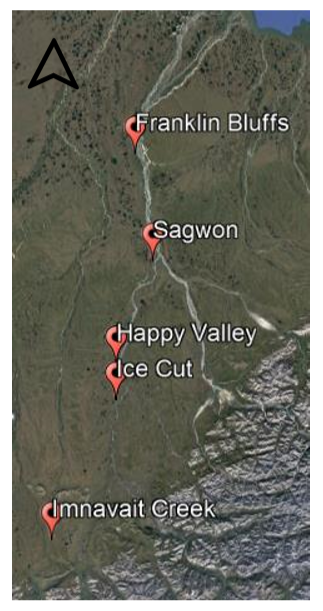
Figure 2. Map of sites along the Dalton Highway.
Table 5. Site sampling and measurement details.
| Site Name | Number of Soil Pits | Date of Sampling | Latitude | Longitude | Pit Sample ID | Number of Samples per Pit | Active Layer Thaw Depth (cm) | ||
|---|---|---|---|---|---|---|---|---|---|
| Franklin Bluffs (FB) | 1 | 2018-08-26 | 69.812372 | -148.76648 | a | b | 8 | 8 | 58 |
| Sagwon (SGW) | 1 | 2018-08-22 | 69.479578 | -148.56442 | a | b | 6 | 6 | 51 |
| 2 | 2018-08-22 | 69.476578 | -148.56443 | >a | b | 8 | 8 | 54 | |
| Happy Valley (HV) | 1 | 2018-08-25 | 69.155356 | -148.83878 | a | b | 8 | 8 | 47 |
| 2 | 2018-08-25 | 69.155358 | -148.8418 | a | b | 5 | 5 | 36 | |
| Ice Cut (ICC) | 1 | 2018-08-23 | 69.041894 | -148.82703 | a | b | 6 | 6 | 55 |
| 2 | 2018-08-23 | 69.041928 | -148.82538 | a | b | 5 | 5 | 38 | |
| Imnavait Creek (IMN) | 1 | 2018-08-24 | 68.604972 | -149.30635 | a | >b | 5 | 5 | 57 |
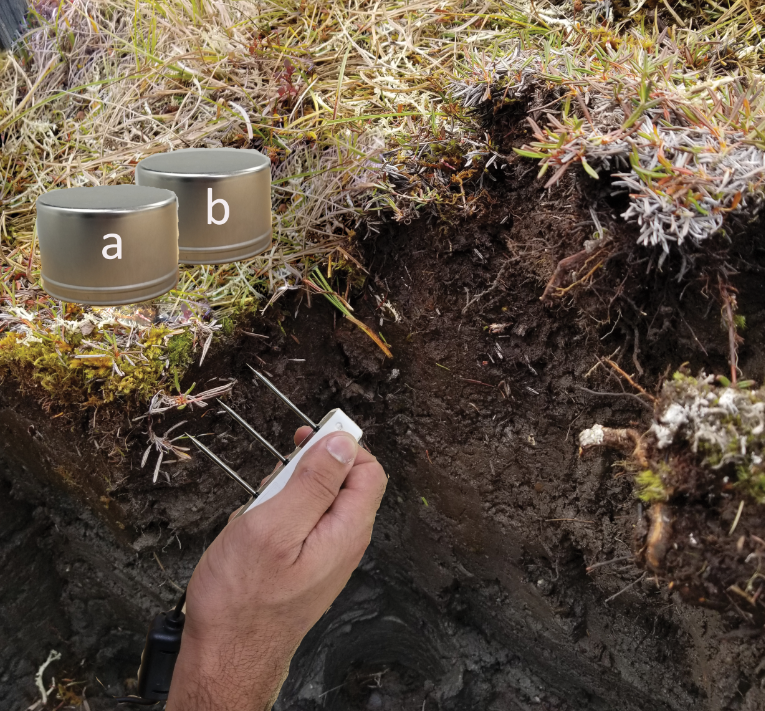
Figure 3. Two adjacent samples, a and b, were collected from each depth interval starting from the surface down to the permafrost table in each soil pit. A TEROS 12 dielectric probe was inserted horizontally into the side of the soil pit to measure a soil dielectric properties profile.
Site Sampling Protocol
The general site sampling protocol follows. Owing to each site's conditions and permitted areas, the length of each transect and the number of soil pits might differ (see site-specific plans below).
- ALT measurements were made along two long transects: north to south (N-S) and east to west (E-W). Priority was given to establishing the N-S transect.
- Soil pit locations were identified.
- ALT measurements were made along 4 short transects intersecting each soil pit: northeast to southwest (NE-SW), north to south (N-S), northwest to southeast (NW-SE), east to west (E-W).
- Dielectric profiles were measured from surface to the permafrost table in soil pits.
- Soil samples were collected from each soil pit using 8 oz tin containers. Two samples were collected from each selected depth to the permafrost table. The samples were then shipped to the University of Southern California for further texture and physical property analysis (Combs et al., 1998; Foth, 1978; Gee and Bauder, 1986). Figure 3 shows the two adjacent sample containers and horizontal soil dielectric probing.
Site Sampling Plan: Franklin Bluff
ALT was measured on four transects intersecting a central soil pit:
- N-S transect: 180 m with 5 m interval
- E-W transect: 180 m with 5 m interval
- Center: Soil pit #1 location
- NE-SW transect: 60 m with 5 m interval
- NW-SE transect: 60 m with 5 m interval
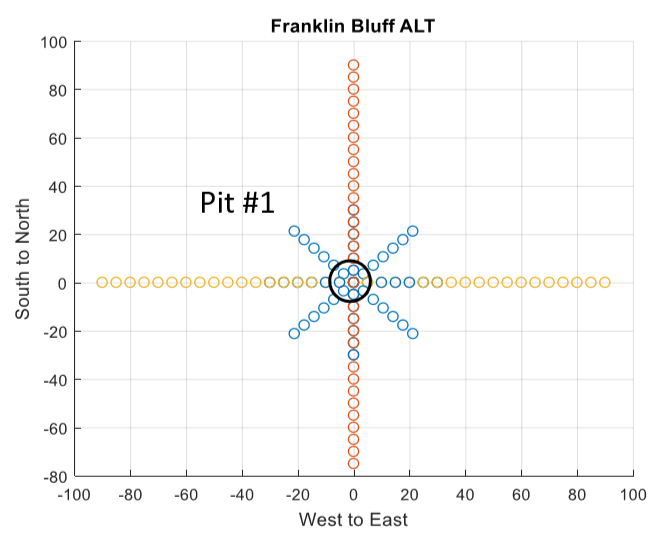
Figure 4. Site sampling plan used for characterizing ALT at the Franklin Bluff site. Axes are in meters.
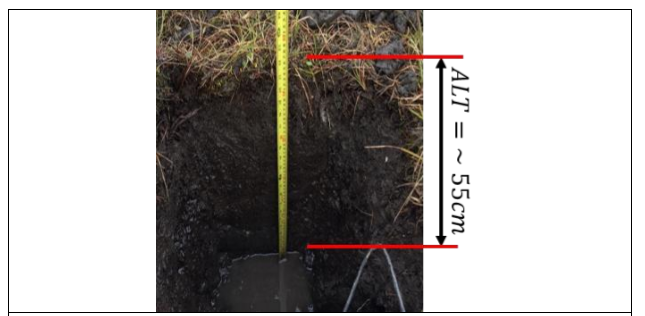
Figure 5. Physical and dielectric soil properties were measured in one soil pit at the Franklin Bluff site.
Site Sampling Plan: Sagwon
ALT was measured on seven transects intersecting two soil pits:
- N-S transect: 480 m with 5 m interval; no measurement at the missing points at approximately 125 m along the N-S axes due to surface water.
- Blue: Measurement across soil pit #1 location
- NE-SW transect: 60 m with 5 m interval
- NW-SE transect: 60 m with 5 m interval
- E-W transect: 60 m with 5 m interval
- Red: Measurement across soil pit #2 location
- NE-SW transect: 60 m with 5 m interval
- NW-SE transect: 60 m with 5 m interval
- E-W transect: 60 m with 5 m interval
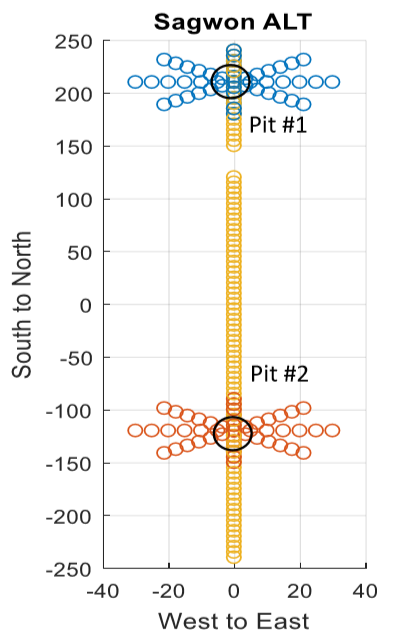
Figure 6. Site sampling plan used for characterizing ALT at the Sagwon site. Axes are in meters.
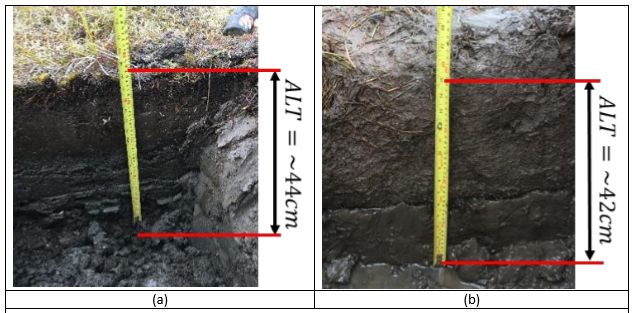
Figure 7. Physical and dielectric soil properties were measured in the Sagwon soil pit #1 (a) and Sagwon soil pit #2 (b).
Site Sampling Plan: Happy Valley
No transect ALT measurements were collected at the Happy Valley site.
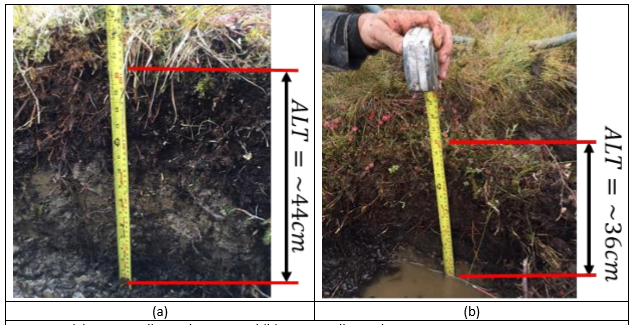
Figure 8. Physical and dielectric soil properties were measured in two soil pits, #1 (a) and #2 (b), at the Happy Valley site.
Site Sampling Plan: Ice Cut
ALT was measured on eight transects intersecting two soil pits:
- N-S transect: 180 m with 5 m interval
- E-W transect: 180 m with 5 m interval
- Blue: Measurement across soil pit #1 location
- NE-SW transect: 60 m with 5 m interval
- NW-SE transect: 60 m with 5 m interval
- E-W transect: 60 m with 5 m interval
- Red: Measurement across soil pit #2 location
- NE-SW transect: 60 m with 5 m interval
- NW-SE transect: 60 m with 5 m interval
- N-S transect: 60 m with 5 m interval
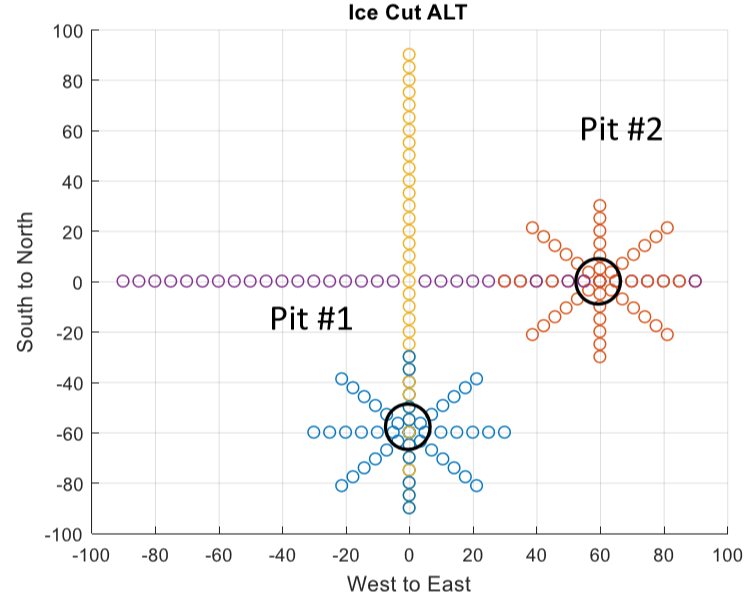
Figure 9. Site sampling plan used for characterizing ALT at the Ice Cut site. Axes are in meters.
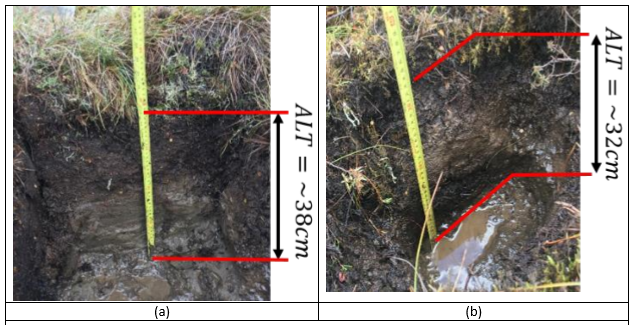
Figure 10. Physical and dielectric soil properties were measured in the Ice Cut soil pit #1 (a) and Ice Cut soil pit #2 (b).
Site Sampling Plan: Imnavait Creek
ALT was measured on four transects intersecting a central soil pit:
- N-S transect: 120 m with 5 m interval
- E-W transect: 120 m with 5 m interval
- Center: Soil pit #1 location
- NE-SW transect: 60 m with 5 m interval
- NW-SE transect: 60 m with 5 m interval
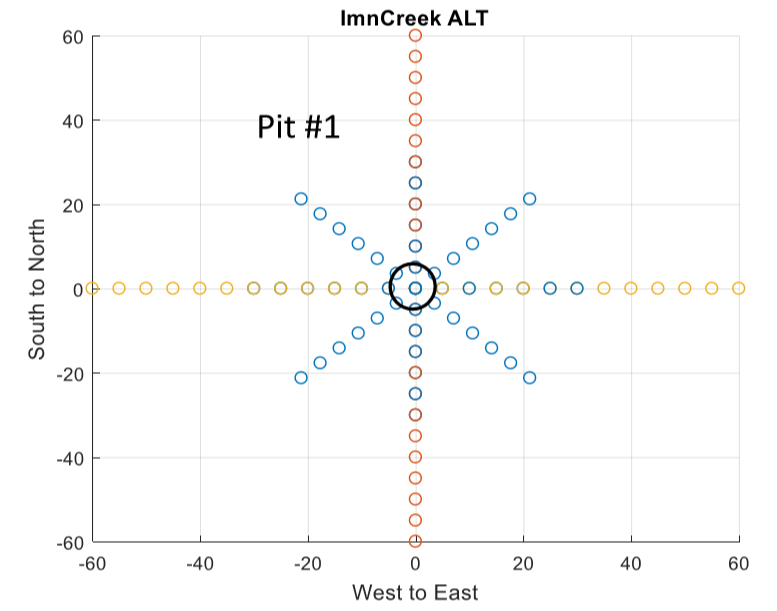
Figure 11. Site sampling plan used for characterizing ALT at the Imnavait Creek site. Axes are in meters.
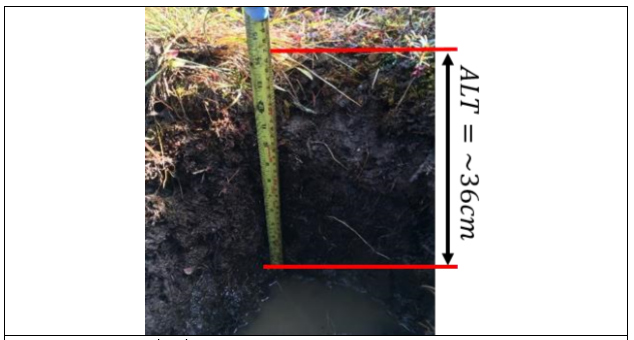
Figure 12. Physical and dielectric soil properties were measured in one soil pit at the Imnavait Creek site. Physical and dielectric soil properties were measured in one soil pit at the Imnavait Creek site.
Data Access
These data are available through the Oak Ridge National Laboratory (ORNL) Distributed Active Archive Center (DAAC).
ABoVE: Active Layer Soil Characterization of Permafrost Sites, Northern Alaska, 2018
Contact for Data Center Access Information:
- E-mail: uso@daac.ornl.gov
- Telephone: +1 (865) 241-3952
References
Combs, S. M. and M. V. Nathan. 1998. Soil Organic Matter. p. 53-58. In J. R. Brown (ed.) Recommended Chemical Soil Test Procedures for the North Central Region. North Central Regional Publication No. 221 (revised). University of Missouri Ag. Exp. Station, Columbia, MO 65211.
Foth, H.D. 1978. Fundamentals of Soil Science. John C. Wiley & Sons.
Gee, G. W. and J. W. Bauder. 1986. Particle-size Analysis (Hydrometer Method), p 404-408. In Arnold Klute (ed.) Methods of Soil Analysis Part 1, Physical and Mineralogical Methods, 2nd Edition. American Society of Agronomy, Inc, Madison, WI 53711.
Ward Laboratories, Inc. Standard Operating Procedures. SOP 1021 - Handling, Testing, and Disposal of Soil and Associated Material from a Regulated or Foreign Source.