Documentation Revision Date: 2025-04-16
Dataset Version: 1.0
Summary
There are 37 total data files in GeoTIFF (.tif) format. This includes 36 snowoff data files, one for every year within the period of record (1988-2023) and one file that provides a fractional water (FW) mask for the study area for the 1988-2016 period. No coastal mask was used for the 2017-2023 data. The full data are included, and data users should be aware that coastal values can be adversely affected by adjacent water bodies. The fractional water mask is included to help identify expected low quality data grid cells affected by surface water contamination.
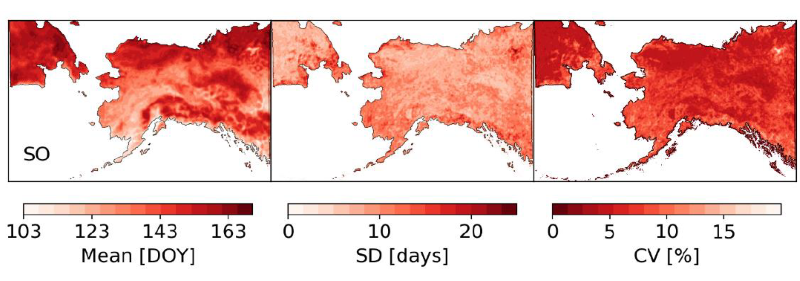
Figure 1. Summary statistics for the snowoff date from 1988-2016 across the study domain: mean (left), standard deviation (middle), and coefficient of variation (right). Dates expressed as day of year (DOY).
Citation
Pan, C.G., P.B. Kirchner, J. Du, and J.S. Kimball. 2020. Passive Microwave-derived Annual Snowoff Date Maps, 1988-2023. ORNL DAAC, Oak Ridge, Tennessee, USA. https://doi.org/10.3334/ORNLDAAC/1711
Table of Contents
- Dataset Overview
- Data Characteristics
- Application and Derivation
- Quality Assessment
- Data Acquisition, Materials, and Methods
- Data Access
- References
- Dataset Revisions
Dataset Overview
This dataset provides annual maps of the snowoff (SO) date from 1988-2023 across Alaska and parts of Far East Russia and northwest Canada at a resolution of 6.25 km. SO date is defined as the last day of persistent snow and was derived from the MEaSUREs Calibrated Enhanced-Resolution Passive Microwave (PMW) EASE-Grid Brightness Temperature (Tb) Earth System Data Record (ESDR) product. The spatial domain was intended to match MODIS Alaska Snow Metrics (Lindsay et.al. 2015) and extend its temporal fidelity beyond the MODIS era. SO date estimates were compared to snow depth measurements collected at SNOTEL stations across Alaska and to three SO datasets derived from MODIS, Landsat, and the Interactive Multisensor Snow and Ice Mapping System (IMS).
Project: Arctic-Boreal Vulnerability Experiment (ABoVE)
The Arctic-Boreal Vulnerability Experiment (ABoVE) is a NASA Terrestrial Ecology Program field campaign being conducted in Alaska and western Canada, for 8 to 10 years, starting in 2015. Research for ABoVE links field-based, process-level studies with geospatial data products derived from airborne and satellite sensors, providing a foundation for improving the analysis, and modeling capabilities needed to understand and predict ecosystem responses to, and societal implications of, climate change in the Arctic and Boreal regions.
Related Publication:
Pan, C.G., P.B. Kirchner, J.S. Kimball, and J. Du. 2020. A long-term passive microwave snowoff record for the Alaska region 1988-2016. Remote Sensing 12:153. https://doi.org/10.3390/rs12010153
Related Datasets:
Pan, C.G., P.B. Kirchner, J.S. Kimball, Y. Kim, and J. Du. 2018. ABoVE: Rain-on-Snow Frequency and Distribution during Cold Seasons, Alaska, 2003-2016. ORNL DAAC, Oak Ridge, Tennessee, USA. https://doi.org/10.3334/ORNLDAAC/1611
Acknowledgments:
This project received support from NASA’s Arctic Boreal Vulnerability Experiment (Grant NNX15AT74A; 80NSSC22K1238) and the National Park Service, Southwest Alaska Inventory and Monitoring Network (P23AC01622-00).
Data Characteristics
Spatial Coverage: Alaska, USA, Northwest Canada, and Far Eastern Russia
ABoVE Reference Locations
Domain: Core ABoVE
Grid cell: Ah000-001v000-001
Spatial Resolution: 6.25 km
Temporal Coverage: 1988-01-01 to 2023-12-31
Temporal Resolution: annual
Study Area: (all latitudes and longitudes given in decimal degrees)
|
Site |
Westernmost |
Easternmost |
Northernmost |
Southernmost |
|
Alaska, Canada, Russia |
-180 |
180 |
90 |
37.9787 |
Data File Information
There are 37 total data files in GeoTIFF (.tif) format. This includes 36 snowoff data files, one for every year within the period of record (1988-2023) and one file that provides a fractional water (FW) mask for the study area for the 1988-2016 period. No coastal mask was used for the 2017-2023 data. The full data are included, and data users should be aware that coastal values can be adversely affected by adjacent water bodies. A fractional water mask is included to help identify expected low quality data grid cells affected by surface water contamination.
Data File Naming Convention: ABoVE.snowoff.YYYYAh000-001v000-001.XXX.tif, where:
YYYY is the calendar year of the measurements, and XXX indicates the data product version format (xxx). All data are version *.001.
All data are provided in the ABoVE grid. The filename includes the ABoVE grid designation (Ah000-001v000-001).
A represents the reference grid name.
h000-001 indicates that the data cover the horizontal tiles from 0-1 in the A reference grid.
v000-001 indicates that the data cover the vertical tiles from 0-1 in the A reference grid.
Example file name: ABoVE.snowoff.1988Ah000-001v000-001.001.tif
Table 1. File names and descriptions
|
Filename |
Units |
Description |
|
ABoVE.snowoff.YYYYAh000-001v000-001.XXX.tif |
DOY |
Thirty-six files. Values represent the snowoff date reported in day of year (DOY). The no-data value is 0 for the years (files) 1988 - 2018. For the years 2019-2023 the no-data value is -9999. The projection is EPSG 102001 (Standard ABoVE, Canada_Albers_Equal_Area_Conic). There are 629 columns and 652 rows. |
|
FW_snowoff_mask.tif |
0-1000 |
One file. Values represent fractional water (FW) and was used as a mask during analyses for the period 1988-2016. The no-data value is -999. The projection is EPSG 102006 (Alaska_Albers_Equal_Area_Conic). There are 563 columns and 354 rows. |
Application and Derivation
Snowoff (SO) date is suitable for documenting the spatial-temporal impacts of SO variability in ecosystem services, wildlife movements, and hydrologic processes across the ABoVE domain.
Quality Assessment
PMW-derived SO estimates were compared to snow depth measurements collected at 31 SNOTEL stations across Alaska (https://wcc.sc.egov.usda.gov/reportGenerator/). The data were positively correlated (0.66-0.92) and the mean absolute error was between 2 and 10 days.
PMW-derived SO estimates were also compared to three SO datasets derived from MODIS (Lindsay et al., 2015), Landsat (Macander and Swingley 2017), and Interactive Multisensor Snow and Ice Mapping System. On average, 75% of the study area had residuals between -10 and 10 days. The PMW tended to overestimate SO at high elevations and across the North Slope and underestimated SO in the interior region and into southwest Alaska. +/- 11 days was chosen as the acceptable uncertainty of the PMW SO.
Data Acquisition, Materials, and Methods
Snowoff date was derived from the MEaSUREs Calibrated Enhanced-Resolution Passive Microwave (PMW) EASE-Grid Brightness Temperature (Tb) Earth System Data Record (ESDR) product (Brodzik et al., 2018) daily 19V (K-band) and 37V (Ka-band) channel frequencies (Brodzik et al., 2018). Tb observations were collected from both the SMM/I and SSMIS sensors. Before the launch of SSMIS in 2006, SSM/I was used then transitioned to SSMIS. Calibration comparisons between the two sensors have found comparable observations.
First, the average difference between Tb measured by the 19V and 37V channels during the month of June was calculated annually. The SO date was then identified as the day with the lowest Tb difference value following the start of snowmelt for the year, and a Tb difference value lower than the average observed in June. This approach could not be used to determine the SO date along shorelines, but shorelines cover between 2-3% of the study domain per year. For these areas, gradient ratio polarization (GRP) (Dolant et al., 2016, Pan et al., 2018) was used. The GRP detected the annual SO date as the day with the lowest 4-day running mean of GRP across the year.
Each annual grid was smoothed using a bilinear interpolation with a 3 x 3 moving window, and the grids were masked by FW (1988-2016 data only) to identify pixels that experience higher FW or high seasonal FW variability, which likely influences the SO date. The explicit spatial domain was intended to match the MODIS Alaska Snow Metrics (Lindsay et al., 2015) and extend its temporal fidelity beyond the MODIS era.
See Pan et al. (2020) for more details of this analysis.
Data Access
These data are available through the Oak Ridge National Laboratory (ORNL) Distributed Active Archive Center (DAAC).
Passive Microwave-derived Annual Snowoff Date Maps, 1988-2023
Contact for Data Center Access Information:
- E-mail: uso@daac.ornl.gov
- Telephone: +1 (865) 241-3952
References
Brodzik, M.J., D.G. Long, M.A. Hardman, A. Paget and R. Armstrong. 2018. MEaSUREs Calibrated Enhanced-Resolution Passive Microwave Daily EASE-Grid 2.0 Brightness Temperature ESDR, Version 1. Boulder, CO: NASA National Snow and Ice Data Center Distributed Active Archive Center. https://doi.org/10.5067/MEASURES/CRYOSPHERE/NSIDC-0630.001
Dolant, C., A. Langlois, B. Montpetit, L. Brucker, A. Roy and A. Royer. 2016. Development of a rain-on-snow detection algorithm using passive microwave radiometry. Hydrological Processes 30:3184-3196. http://doi.wiley.com/10.1002/hyp.10828
Lindsay, C., J. Zhu, A. Miller, P. Kirchner, and T. Wilson. 2015. Deriving Snow Cover Metrics for Alaska from MODIS. Remote Sensing 7:12961–12985. https://doi.org/10.3390/rs71012961
Macander, M.J., and C.S. Swingley. 2017. Landsat snow persistence and snow regime mapping for Alaska and lichen cover mapping for Yukon-Charley rivers national preserve. United States Geological Survey Alaska Science Center. Anchorage, Alaska. https://irma.nps.gov/DataStore/Reference/Profile/2238597
Pan, C.G., P.B. Kirchner, J.S. Kimball, Y. Kim, and J. Du. 2018. Rain-on-snow events in Alaska, their frequency and distribution from satellite observations. Environmental Research Letters 13:075004. https://doi.org/10.1088/1748-9326/aac9d3
Pan, C. G., P. B. Kirchner,, J. S. Kimball, and J. Du. 2020. A long-term passive microwave snowoff record for the Alaska region 1988-2016. Remote Sensing 12:153. https://doi.org/10.3390/rs12010153
Dataset Revisions
|
Product Version |
Release Date |
Revision Notes |
| 1.0 | 2025-04-15 | Added new files for the years 2019-2023. A coastal mask removing coastal pixels due to potential water contamination from coarse brightness temperature observations is not included for these years. The full data are provided, and it is recommended that data users be aware that coastal values can be adversely affected by adjacent water bodies |
|
1.0 |
2020-02-21 |
Data for 2017 and 2018 were added. A coastal mask removing coastal pixels due to potential water contamination from coarse brightness temperature observations is not included for these years. The full data are provided, and it is recommended that data users be aware that coastal values can be adversely affected by adjacent water bodies. |
|
1 |
2020-01-09 |
Data for 1988-2016 and includes a coastal mask removing coastal pixels due to potential water contamination from coarse brightness temperature observations |