Documentation Revision Date: 2018-12-31
Data Set Version: 1
Summary
The 29 plots assessed occur within 6 broad habitat types including: 1) willow shrub vegetation of riparian areas and warm habitats (4 plots), 2) wet nonacidic tundra (2 plots), 3) bog vegetation, acidic mires including tussock tundra (11 plots), 4) ruderal community on loamy soil (1 plot), 5) dry to moist dwarf-shrub heath and low shrub vegetation on acidic nutrient poor substrates (3 plots), and 6) dry and mesic dwarf-shrub and graminoid vegetation on non-acidic substrates (8 plots).
There are three data files in .csv format. Companion files include soil profile descriptions from soil pits and aerial color infrared images from selected sites.
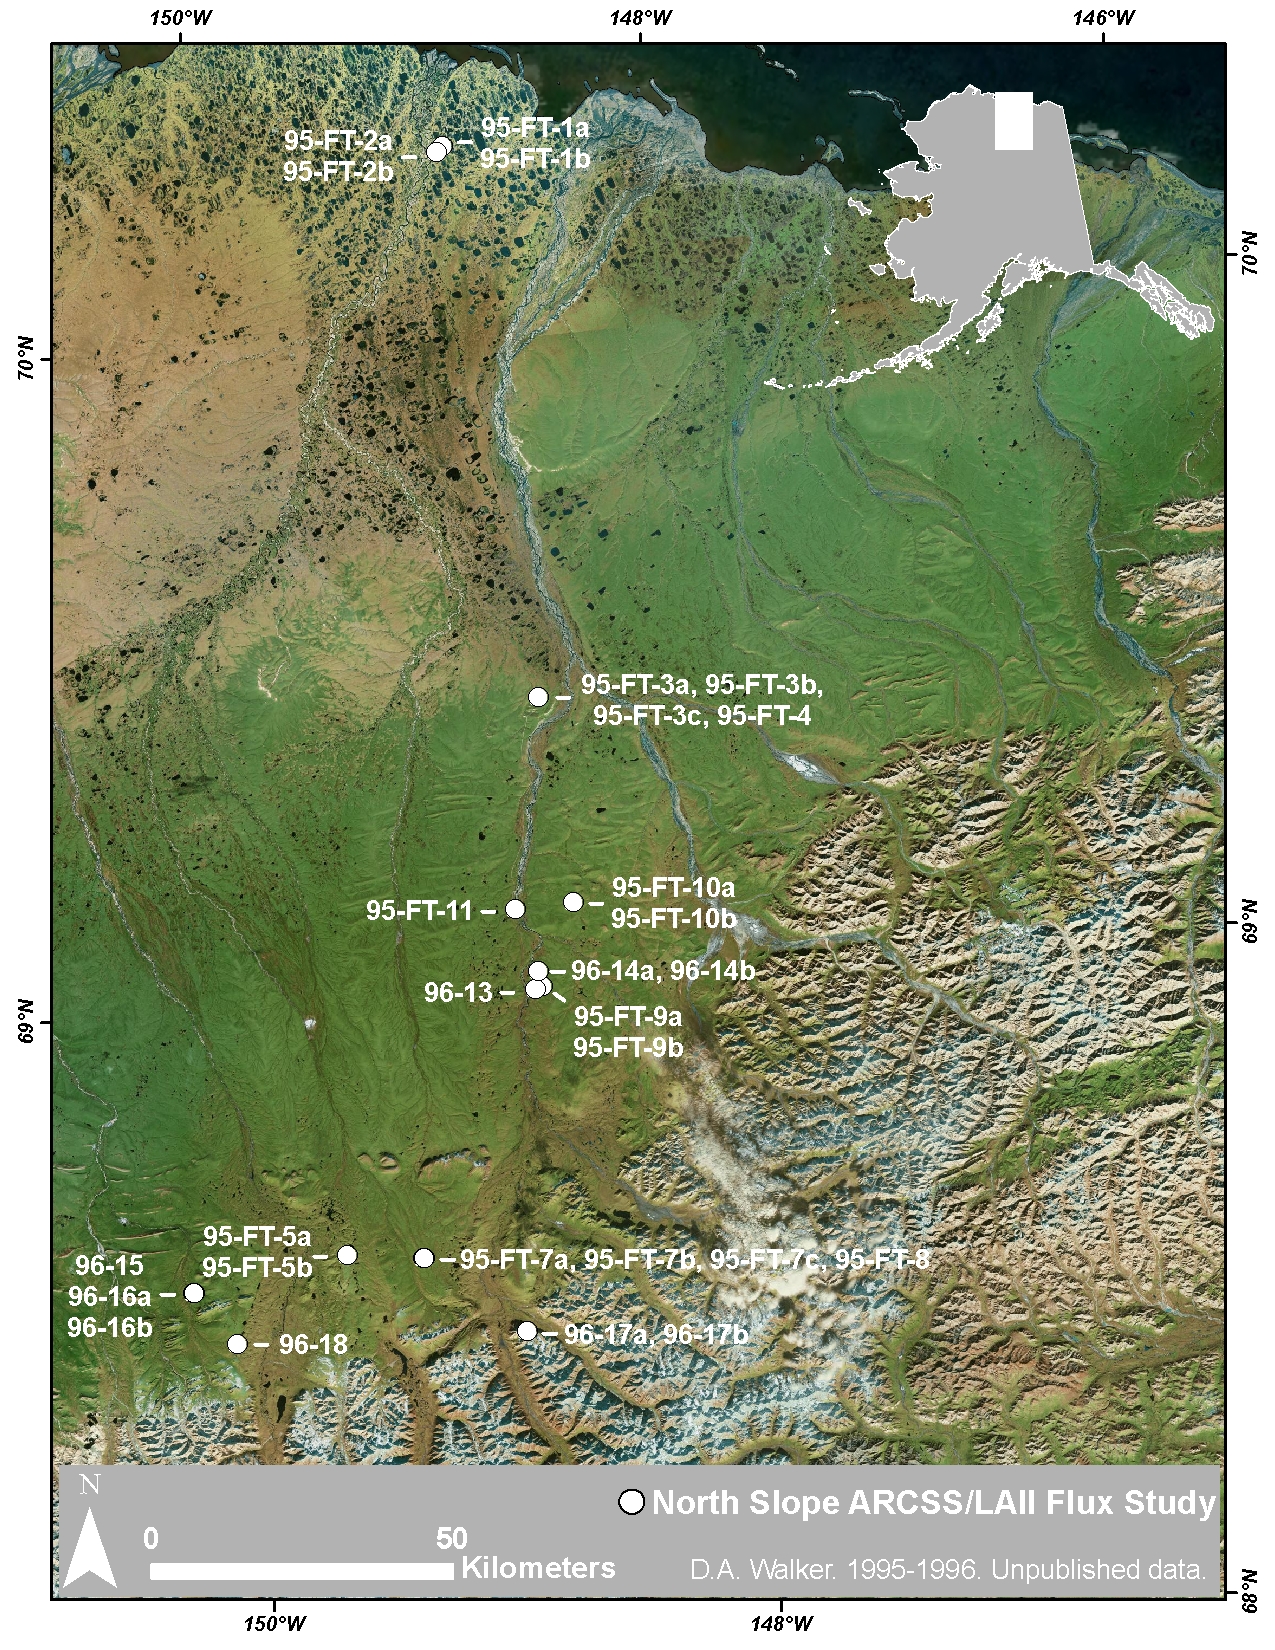
Figure 1. Locations of ARCSS/LAII vegetation plots. Plots were located at flux tower and other selected sites along a North-South transect from near Prudhoe Bay to the foothills of the Brooks Range.
Citation
Walker, D.A. 2018. Arctic Vegetation Plots at ARCSS/LAII Flux Sites, North Slope, Alaska, 1995-1996. ORNL DAAC, Oak Ridge, Tennessee, USA. https://doi.org/10.3334/ORNLDAAC/1536
Table of Contents
- Data Set Overview
- Data Characteristics
- Application and Derivation
- Quality Assessment
- Data Acquisition, Materials, and Methods
- Data Access
- References
Data Set Overview
This dataset provides vegetation cover and environmental plot and soil data collected at flux tower sites of the North Slope Arctic System Science/Land-Atmosphere-Ice Interactions (ARCSS/LAII) project in August of 1995 and 1996. The 19 ARCSS/LAII flux tower sites are located along a North-South transect from near Prudhoe Bay to the foothills of the Brooks Range on the North Slope of Alaska. At 17 of the flux tower sites, one or more vegetation plots (29 total) were established and measurements including (1) plant species cover for the major vegetation types using the Braun-Blanquet approach, (2) plot environmental data, and (3) soil profile descriptions were recorded. In addition, at all 19 sites, plant growth form composition and cover were surveyed using a point sampling technique along multiple transects within selected plots.
The 29 plots assessed occur within 6 broad habitat types including: 1) willow shrub vegetation of riparian areas and warm habitats (4 plots), 2) wet nonacidic tundra (2 plots), 3) bog vegetation, acidic mires including tussock tundra (11 plots), 4) ruderal community on loamy soil (1 plot), 5) dry to moist dwarf-shrub heath and low shrub vegetation on acidic nutrient poor substrates (3 plots), and 6) dry and mesic dwarf-shrub and graminoid vegetation on non-acidic substrates (8 plots).
The Pre-ABoVE vegetation plot datasets were curated to create the Alaska Arctic Vegetation Archive (AVA-AK; Walker et al. 2016b, Walker 2013). The AVA-AK is a regional database that is part of the larger Arctic Vegetation Archive (Walker 2016a, Walker et al. 2013, Walker and Raynolds 2011). The database contains vegetation plots from homogeneous plant communities with tables of cover or cover-abundance scores for all species and accompanying environmental site data. Field data were collected using Braun-Blanquet, US National Vegetation Classification protocols, or comparable methods.
Project: Arctic-Boreal Vulnerability Experiment (ABoVE)
The Arctic-Boreal Vulnerability Experiment (ABoVE) iis a NASA Terrestrial Ecology Program field campaign that will take place in Alaska and western Canada between 2016 and 2021. Climate change in the Arctic and Boreal region is unfolding faster than anywhere else on Earth. ABoVE seeks a better understanding of the vulnerability and resilience of ecosystems and society to this changing environment.
Related Publication:
Although the details of the vegetation studies were not published independently, the studies contributed to numerous papers published in a special section of the Journal of Geophysical Research (Kane and Reeburgh, 1998).
Kane, D. L., and W. S. Reeburgh (1998), Introduction to special section: Land-Air-Ice Interactions (LAII) Flux Study, J. Geophys. Res., 103(D22), 28913–28915, http://dx.doi.org/10.1029/1998JD200017
Acknowledgements:
This project was funded by a National Science Foundation, Office of Polar Programs grant, OPP-9318530.
These data files were edited by Donald A. Walker, Amy L. Breen and Lisa A. Druckenmiller at the University of Alaska Fairbanks' Alaska Geobotany Center and obtained via the Arctic Geoecological Atlas (http://arcticatlas.geobotany.org/), which provides access to existing Arctic vegetation plot and map data in support of the ABoVE campaign.
Data Characteristics
Spatial Coverage: Data were collected at flux tower sites on the North Slope of Alaska
ABoVE Site Designation:
Domain: Core ABoVE region
State/territory: Alaska
ABoVE Grid Location: Ah1v0.Bh2v3
Spatial Resolution: Point resolution.
Temporal Coverage: August of 1995 and 1996
Temporal Resolution: Each plot was sampled once.
Study Area (All latitude and longitude given in decimal degrees)
|
Site |
Westernmost Longitude |
Easternmost Longitude |
Northernmost Latitude |
Southernmost Latitude |
|---|---|---|---|---|
|
North Slope, Alaska |
-150.25 |
-148.59 |
70.2835 |
68.49 |
Data File Information:
There are three data files with this dataset in comma-separated (.csv) format. These data may also be found in the TURBOVEG database.
Missing data are represented as -9999.
Table 1. File names and descriptions
| Data File Names | Descriptions |
|---|---|
|
North_Slope_Veg_Plots_Species_Data.csv |
File contain species cover data for the North Slope ARCSS/LAII flux site vegetation plots. Species cover classes are the old Braun-Blanquet cover-abundance scale: r (rare), + (common, but less than 1 percent cover), 1 (1-5 percent), 2 (6 to 25 percent), 3 (26 to 50 percent), 4 (51 to 75 percent), and 5 (76 to 100 percent). |
| North_Slope_Veg_Plots_Environmental_Data.csv | Environmental data for the North Slope ARCSS/LAII flux site vegetation plots. |
| North_Slope_Veg_Plots_Growthforms_Data.csv |
The file summarizes the point-count data along transects within study plots by growth form. Cover values are given for both live and dead vegetation. |
| Companion Files | |
| North_Slope_Veg_Plots_Env_Codes_Scalars.pdf | Contains definitions for the codes and scalars used in the environmental data file. |
| North_Slope_Veg_Plots_1995_soil_description.pdf |
This file is a compilation of written data sheets that contain the field soil descriptions for the 1995 North Slope ARCSS/LAII Flux Study sites. |
| North_Slope_Veg_Plots_1995_field_summary.pdf |
This file is a summary dated 12 September 1995 detailing fieldwork completed during the period 12-26 August 1995. |
| North_Slope_Veg_Plots_1995_aerialphotolog.pdf |
This file contains aerial color infrared images (scale 1:3000) for many of the study sites. Sites 11, 12, 17, 18 and 19 were not photographed from the air. . The actual locations of vegetation plots are not marked on the aerial photograph images for a site. |
North_Slope_Veg_Plots_Species_Data.csv
The file contains species cover data for the North Slope ARCSS/LAII Flux plots.The source of these data, collected by D. A. Walker, are from unpublished datasheets.
Species cover classes are the old Braun-Blanquet cover-abundance scale: r (rare), + (common, but less than 1 percent cover), 1 (1-5 percent), 2 (6 to 25 percent), 3 (26 to 50 percent), 4 (51 to 75 percent), and 5 (76 to 100 percent). Both the author's determination and the current taxonomy according to the Panarctic Species List (PASL) are listed. Taxa are listed in alphabetical order according to the accepted PASL name. The plot numbers in the source data are the author's.
During this study, vegetation plots were not established at Tower Site 6 (Toolik Lake) or Site 12 (W. Oechel's flux-tower site at Betty Pingo), however, growthform transect data are available.
Table 2. This file contains species cover data for the vegetation plots. Taxa are listed in alphabetical order according to the accepted PASL name.
|
Column Numbers |
Column Name |
Units |
Description |
|---|---|---|---|
|
1 |
PASL_TAXON_SCIENTIFIC_NAME_NO_AUTHORS |
|
Current Taxonomy according to the Panarctic Species List (PASL) without authors names |
|
2 |
PASL_TAXON_SCIENTIFIC_NAME_WITH_AUTHOR(S) |
|
Current Taxonomy according to the Panarctic Species List (PASL) |
|
3 |
DATASET_TAXON |
|
Dataset taxonomy |
|
4 to 29 |
29 Plots over Sites 1-5, 7-11, 13-19 |
|
Column headings are for 29 plots. See Plot to Site crosswalk table. Species cover data are given as percentage. |
North_Slope_Veg_Plots_Environmental_Data.csv
The codes used in this file are in the companion file: North_Slope_Veg_Plots_Env_Codes_Scalars.pdf
Table 3. The file contains environmental data for the North Slope ARCSS/LAII flux site vegetation plots. The source of these data are unpublished data records by D.A. Walker. The plot numbers are the authors'.
|
Column Name |
Units / Format | Description |
|---|---|---|
| RELEVE NUMBER | Plot number | |
| SITE_NUMBER | ||
| DATE | YYYYMMDD | Survey date |
| STUDY_AREA_DESCRIPTION | ||
| LATITUDE | Decimal degrees, WGS 84 | Latitude of plot |
| LONGITUDE | Decimal degrees, WGS 84 | Longitude of plot |
| ELEVATION | M | Elevation |
| OBSERVER | ||
| VEGETATION | Plant community description | |
| WEATHER | Weather observation at time of survey | |
| PH | pH measured at surface of mineral soil layer | |
| LANDFORMS | Code | Refer to the code defined in companion file North_Slope_Veg_Plots_Env_Codes_Scalars.pdf |
| SURFICIAL GEOLOGY | Code | Refer to the code defined in companion file North_Slope_Veg_Plots_Env_Codes_Scalars.pdf |
| SURFICIAL GEOMORPHOLOGY | Code and Location | Refer to the code defined in companion file North_Slope_Veg_Plots_Env_Codes_Scalars.pdf |
| SITE MOISTURE | Scaler | Refer to the scaler defined in companion file North_Slope_Veg_Plots_Env_Codes_Scalars.pdf |
| SOIL MOISTURE | Scaler | Refer to the scaler defined in companion file North_Slope_Veg_Plots_Env_Codes_Scalars.pdf |
| GLACIAL GEOLOGY | Code | Refer to the code defined in companion file North_Slope_Veg_Plots_Env_Codes_Scalars.pdf |
| TOPOGRAPHIC POSITION | Code | Refer to the code defined in companion file North_Slope_Veg_Plots_Env_Codes_Scalars.pdf |
| ESTIMATED SNOW DURATION | Scaler | Refer to the scaler defined in companion file North_Slope_Veg_Plots_Env_Codes_Scalars.pdf |
| STABILITY | Scaler | Refer to the scaler defined in companion file North_Slope_Veg_Plots_Env_Codes_Scalars.pdf |
| EXPOSURE SCALE | Scaler | Refer to the scaler defined in companion file North_Slope_Veg_Plots_Env_Codes_Scalars.pdf |
| ASPECT | Degrees | Aspect of plot area in degrees |
| SLOPE | Degrees | Slope of plot area in degrees |
| DECIDUOUS SHRUB COVER | % | Percent of plot cover that is deciduous shrubs |
| EVERGREEN SHRUB COVER | % | Percent of plot cover that is evergreen shrubs |
| FORB COVER | % | Percent of plot cover that is forbs |
| GRAMINOID COVER | % | Percent of plot cover that is graminoids |
| MOSS COVER | % | Percent of plot cover that is moss |
| LICHEN COVER | % | Percent of plot cover that is lichen |
| ROCK COVER | % | Percent of plot cover that is forbs |
| BARE SOIL COVER | % | Percent of plot cover that is bare soil |
| WATER COVER | % | Percent of plot cover that is water |
| MEAN MAXIMUM SHRUB HEIGHT | CM | Mean maximum vegetation height in centimeters |
North_Slope_Veg_Plots_Growthforms_Data.csv
Species (growth form) occurrence was sampled at the top and bottom of the plant canopy with a Buckner optical point sampling device at 1-meter intervals along transect lines across each site. Each site consists of a 100x100-meter square with 6 transects (4 - 50-meter and 2 - 70-meter transects) radiating from the center. Nominally, 340 points were sampled in each plot. Not observed species (growth forms) are reported as '-9999'.
Table 4. The .csv file contains a pair of summary tables (observations at top and bottom of the plant canopy respectively) for each of the 19 sites.
| SITE (1-19) (n=XXX) |
Field site and number of points sampled along transect lines. |
|
|
Column 1: Top species or Bottom species |
Columns 2-7: Name / Reported Parameters |
Parameter Description |
| Low evergreen shrubs | LIVE FREQUENCY | Occurrence of living plant growth forms (with foliar cover) along transects as observed using point sampling technique. |
| Low deciduous shrubs | LIVE PERCENT | Calculations of percent live vegetation cover are based on total number of points measured at a site (n). Since some points include bare soil, water, etc., the total vegetation cover is less than 100 percent. |
| Prostrate evergreen shrubs | DEAD FREQUENCY | Occurrence of dead plant growth forms (woody and standing dead) along transects as observed using point sampling technique. |
| Prostrate deciduous shrubs | DEAD PERCENT | Calculations of percent dead vegetation cover are based on total number of points measured at a site (n). Since some points include bare soil, water, etc., the total vegetation cover is less than 100 percent. |
| Dwarf evergreen shrubs | TOTAL FREQUENCY | Total of live and dead frequency |
| Dwarf deciduous shrubs | TOTAL PERCENT | Total of live and dead percent cover |
| Tussock graminoids | ||
| Non-tussock graminoids | ||
| Forbs/horsetail/clubmoss | ||
| Bryophytes | ||
| Lichens |
Application and Derivation
These data are useful to climate change studies.
Quality Assessment
While no specific quality assessment information was provided the data products were reviewed and curated by the GINA repository.
Data Acquisition, Materials, and Methods
The vegetation and soils at the North Slope Arctic System Science/Land-Atmosphere-Ice Interactions (ARCSS/LAII) Flux tower sites of F. S. Chapin and W. Oechel on the North Slope of Alaska were described by D. A. Walker, J. Bockheim, and C. L. Ping in 1995 and 1996. The primary source documents for this dataset are a collection of unpublished data for 29 plots by D. A. Walker. The provided data products have been compiled and curated by the GINA Staff.
Site Description:
The 19 ARCSS/LAII flux tower sites were located along a North-South transect from near Prudhoe Bay to the foothills of the Brooks Range on the North Slope of Alaska.
At 17 of the flux tower sites, one or more vegetation plots (29 total) were established and measurements including (1) plant species cover were recorded for the major vegetation types using the Braun-Blanquet approach and (2) plot environmental data.
The 29 plots assessed occur within 6 broad habitat types including: 1) willow shrub vegetation of riparian areas and warm habitats (4 plots), 2) wet nonacidic tundra (2 plots), 3) bog vegetation, acidic mires including tussock tundra (11 plots), 4) ruderal community on loamy soil (1 plot), 5) dry to moist dwarf-shrub heath and low shrub vegetation on acidic nutrient poor substrates (3 plots), and 6) dry and mesic dwarf-shrub and graminoid vegetation on non-acidic substrates (8 plots).
Methods:
Sites were 100 x 100-meter square, marked in the field with air photo panels and 4-foot lath. At most of the flux tower sites, one or more plots, including plant species cover and environmental data, were recorded for the major vegetation types using the Braun-Blanquet approach. During this study, vegetation plots were not established at Tower Site 6 (Toolik Lake) or Site 12 (W. Oechel's flux-tower site at Betty Pingo), however, growth form data transect growth form data is available. GPS coordinates were obtained for most of the plots.
The characteristics of slope, aspect, stability, exposure, parent material and geomorphology were noted at each site. Site and soil moisture and snow duration were categorized on scales of 1 to 10.
At each study site, one to four 1 x 1 x 1-meter soil pits were excavated, and detailed soil descriptions were made. See companion file North_Slope_Veg_Plots_1995_soil_description.pdf.
At all 19 sites, plant growth form composition and cover were surveyed using a point sampling technique along multiple transects within each plot. Six transects (four 50-meter and two 70-meter transects) that radiated from the center point of the plot were marked with wire flags spaced at 5-meter intervals. Plant species composition and vegetation height were sampled with a Buckner optical device along the six transects at 1-meter intervals.
This dataset was edited and processed by Dr. Amy Breen and Lisa Druckenmiller and provided by the GINA repository at http://geobotanical.portal.gina.alaska.edu/catalogs/11487-alaska-arctic-vegetation-archive-north-slope-f. For additional background information on this dataset please refer to http://www.arcticatlas.org/support/tldatareport/index.
Data Access
These data are available through the Oak Ridge National Laboratory (ORNL) Distributed Active Archive Center (DAAC).
Arctic Vegetation Plots at ARCSS/LAII Flux Sites, North Slope, Alaska, 1995-1996
Contact for Data Center Access Information:
- E-mail: uso@daac.ornl.gov
- Telephone: +1 (865) 241-3952
References
Although the details of the vegetation studies were not published independently, the studies contributed to numerous papers published in a special section of the Journal of Geophysical Research (Kane and Reeburgh, 1998).
Kane, D. L., and W. S. Reeburgh (1998), Introduction to special section: Land-Air-Ice Interactions (LAII) Flux Study, J. Geophys. Res., 103(D22), 28913–28915, http://dx.doi.org/10.1029/1998JD200017