Documentation Revision Date: 2018-12-31
Data Set Version: 1
Summary
At each site, permanent 10 x 10 m grids were established for repeated long-term measurements. Snow depth and thaw depth measurements started at selected Alaska sites in 2000, NWT sites in 2003, and continued at selected sites at varying intervals through 2006. In 2006, vegetation cover was mapped at the Alaska sites. In 2012, spectral measurements were acquired at the Alaska sites and NDVI was calculated. A table of study sites, that displays when the different measurements were collected, is included.
There are 50 data files with this dataset. This includes 21 shapefiles (compressed in .zip format) with vegetation and NDVI data, and 29 files with snow and thaw depth data in comma-separated (.csv) format.
Figure 1. Locations of the study sites. Note that seven locations are indicated along Dalton Highway as there were two for Sagwon for acidic and nonacidic tundra areas (Walker et al., 2008).
Citation
Walker, D.A., and M.K. Raynolds. 2018. Maps of Vegetation, NDVI, Snow and Thaw Depths: North Slope, Alaska and NWT, Canada. ORNL DAAC, Oak Ridge, Tennessee, USA. https://doi.org/10.3334/ORNLDAAC/1386
Table of Contents
- Data Set Overview
- Data Characteristics
- Application and Derivation
- Quality Assessment
- Data Acquisition, Materials, and Methods
- Data Access
- References
Data Set Overview
This dataset provides measurements obtained as part of a biocomplexity project on the North Slope of Alaska and the NWT, Canada. In Alaska, seven sites are located along the Dalton Highway and in the Prudhoe Bay Oilfield area, forming a transect across the climate gradient of the North Slope. From South to North, the sites are Happy Valley, Sagwon (an acidic and nonacidic site), Franklin Bluffs, Deadhorse, West Dock and Howe Island. Four sites are in the NWT, forming a latitudinal gradient from South to North; the sites include Inuvik, Green Cabin, Mould Bay, and Isachsen.
At each site, one to three permanent 10 x 10 m grids were established for repeated long-term measurements. Snow depth and thaw depth measurements started at selected Alaska sites in 2000, NWT sites in 2003, and continued at selected sites at varying intervals through 2006. In 2006, vegetation cover was mapped at the Alaska sites. In 2012, spectral measurements were acquired at the Alaska sites and NDVI was calculated. A table of study sites, that displays when the different measurements were collected, is included.
Project: Arctic-Boreal Vulnerability Experiment (ABoVE)
The Arctic-Boreal Vulnerability Experiment (ABoVE) is a NASA Terrestrial Ecology Program field campaign based in Alaska and western Canada between 2016 and 2021. Climate change in the Arctic and Boreal region is unfolding faster than anywhere else on Earth. ABoVE seeks a better understanding of the vulnerability and resilience of ecosystems and society to this changing environment.
Acknowledgements:
These data were obtained from the Alaska Arctic Geoecological Atlas (http://agc.portal.gina.alaska.edu), which provides access to existing Arctic vegetation plot and map data in support of the ABoVE campaign.
Related publications:
Barreda, J.E., J. Knudson, D.A. Walker, M. K. Raynolds, A. Kade, and C. Munger. 2006. Biocomplexity of Patterned Ground Data Report Dalton Highway, 2001-2005.
Buchhorn, M., D. A. Walker, B. Heim, M. K. Raynolds, H. E. Epstein, and M. Schwieder. 2013. Ground-based hyperspectral characterization of Alaska tundra vegetation along environmental gradients. Remote Sensing 5:3971-4005.
Kade, A. N., D. A. Walker, and M. K. Raynolds. 2005. Plant communities and soils in cryoturbated tundra along a climate gradient in the Low Arctic, Alaska. Phytocoenologia 35:761–820.
Raynolds, M. K., D. A. Walker, C. A. Munger, C. M. Vonlanthen, and A. N. Kade. 2008. A map analysis of patterned-ground along a North American Arctic transect. Journal of Geophysical Research 113:G03S03, doi:10.1029/2007JG000512.
Vonlanthen, C. M., D. A. Walker, M. K. Raynolds, A. N. Kade, H. P. Kuss, F. J. A. Daniels, and N. V. Matveyeva. 2008. Patterned-ground plant communities along a bioclimate gradient in the High Arctic, Canada. Phytocoenologia 38:23-63.
Walker, D. A., H. E. Epstein, V. E. Romanovsky, C.-L. Ping, G. J. Michaelsen, R. P. Daanen, Y. Shur, R. A. Peterson, W. B. Krantz, M. K. Raynolds, W. A. Gould, G. Gonzalez, D. J. Nicolsky, C. M. Vonlanthen, A. N. Kade, H. P. Kuss, A. M. Kelley, C. A. Munger, C. T. Tarnocai, N. V. Matveeva, and F. J. A. Daniels. 2008. Arctic patterned-ground ecosystems: A synthesis of studies along a North American Arctic Transect. Journal of Geophysical Research - Biogeosciences 113:G03S01. doi:10.1029/2007JG000504
Data Characteristics
Spatial Coverage: Seven sites on the North Slope of Alaska along the Dalton Highway and in the Prudhoe Bay Oilfield area and four sites in the NWT, Canada. See Figure 2.
ABoVE Grid Locations:
Domain: Core ABoVE
State/territory: Alaska and NWT, Canada
Grid cells: Ah1Av0Bh2Bv2; Ah1Av0Bh4Bv5; Ah2Av0Bh3Bv2; Ah2Av0Bh3Bv4; Ah2Av0Bh5Bv1
Region: Northern Alaska and the NWT
Spatial Resolution: 10 x 10 m plots and point measurements
Temporal Coverage: Snow depth and thaw depth measurements started at selected Alaska sites in 2000, NWT sites in 2003, and continued at selected sites at varying intervals through 2006. In 2006, vegetation cover was mapped at the Alaska sites. In 2012, spectral measurements were acquired at the Alaska sites and NDVI was calculated
Temporal Resolution: Varied
Study Area (These coordinates are the approximate locations of the study sites and may not match the extents of data files. All latitude and longitude given in decimal degrees.)
| Site | Westernmost Longitude | Easternmost Longitude | Northernmost Latitude | Southernmost Latitude |
|---|---|---|---|---|
| Seven sites along the Dalton Highway, North Slope, Alaska | -148.85222 | -147.99336 | 70.37475 | 69.14678 |
| Four sites in the NWT, Canada | -133.73056 | -103.55078 | 78.78565 | 68.36167 |
Data file information
This dataset provides 21 compressed shapefiles (.zip) with vegetation and NDVI data for seven sites in Alaska, and 29 comma-separated files (.csv) with snow and thaw depth data for those seven sites as well as four sites in the NWT. Measurements were made on one to three grids established at each site.
All vegetation and NDVI shapefile data are also provided as a companion files in .kmz format for viewing in Google Earth.
Table 1. List of study sites and year range when each measurement type was collected or ‘Not collected’.
| Snow Depth | Thaw Depth | Vegetation Mapping | NDVI | |
|---|---|---|---|---|
| Alaska | ||||
| Happy Valley | 2002-2006 | 2001-2002, 2006 | 2006 | 2012 |
| Sagwon - acidic | 2001-2005 | 2000-2002 | 2006 | 2012 |
| Sagwon - nonacidic | 2001-2005 | 2001-2002, 2006 | 2006 | 2012 |
| Franklin Bluffs | 2001-2006 | 2001-2002, 2006 | 2006 | 2012 |
| Deadhorse | 2001-2005 | 2000-2006 | 2006 | 2012 |
| West Dock | 2000-2005 | 2000-2006 | 2006 | 2012 |
| Howe Island | 2003-2005 | 2001-2006 | 2006 | 2012 |
| Northwest Territories | ||||
| Inuvik | Not collected | 2004, 2006 | Not collected | Not collected |
| Green Cabin | Not collected | 2003, 2006 | Not collected | Not collected |
| Mould Bay | 2006 | 2004, 2006 | Not collected | Not collected |
| Isachsen | 2006 | 2005-2006 | Not collected | Not collected |
Table 2: Data file names and descriptions.
From South to North, the sites are Happy Valley, Sagwon (two sites), Franklin Bluffs, Deadhorse, West Dock, Howe Island, Inuvik (NWT), Green Cabin (NWT), Mould Bay ( NWT), and Isachsen (NWT).
| Vegetation and NDVI Data Files | Descriptions |
|---|---|
| happy_valley_X_vegetation.shp | There are three vegetation maps for Happy Valley in shapefile (.shp) format provided in compressed (*.zip) files. There were three 10 x 10 m grids along a hill-slope where X denotes the location of the grid on the slope: hillcrest-on the crest of the hill ( grid G3-dry), midslope-on the mid-slope (grid G2-mesic), and toeslope-on the toe slope (grid G1-wet) (three individual files) |
| happy_valley_X_ndvi.shp | There are three NDVI maps for Happy Valley in shapefile (.shp) format provided in compressed (*.zip) files. There were three 10 x 10 m grids along a hill-slope where X in the file names denotes the location of the grid on the slope: hillcrest-on the crest of the hill ( grid G3-dry), midslope-on the mid-slope (grid G2-mesic), and toeslope-on the toe slope (grid G1-wet) (three individual files) |
| sagwon_X_vegetation.shp | There are two vegetation maps for Sagwon in shapefile (.shp) format provided in compressed (*.zip) files; one file for an acidic tundra site and one file for a nonacidic site tundra site (two individual files). There was one grid at the acidic site and two grids at the nonacidic site |
| sagwon_X_ndvi.shp | There are two NDVI maps for Sagwon in shapefile (.shp) format provided in compressed (*.zip) files; one file for an acidic tundra site and one file for a nonacidic site tundra site (two individual files). There was one grid established at the acidic site and two grids at the nonacidic site |
| franklin_bluffs_X_vegetation.shp | There are three vegetation maps for Franklin Bluffs in shapefile (.shp) format provided in compressed (*.zip) files. There were three 10 x 10 m grids established where X in the file names denotes dry, moist, and wet (three individual files) |
| franklin_bluffs_X_ndvi.shp | There are three NDVI maps for Franklin Bluffs in shapefile (.shp) format provided in compressed (*.zip) files. There were three 10 x 10 m grids established where X in the file names denotes dry (grid 3), moist (grid 2), and wet (grid 1); three individual files for each area |
| deadhorse_vegetation.shp | A vegetation map in shapefile (.shp) format provided in a compressed (*.zip) file. There was only one grid established at Deadhorse |
| deadhorse_ndvi.shp | NDVI data in shapefile (.shp) format provided in a compressed (*.zip) file. There was only one grid established at Deadhorse |
| west_dock_vegetation.shp | A vegetation map in shapefile (.shp) format provided in a compressed (*.zip) file |
| howe_island_vegetation.shp | A vegetation map in shapefile (.shp) format provided in a compressed (*.zip) file. |
| Snow and Thaw Depth Files | Descriptions |
| Site_snowdepth_gridG#_Xm_YYYYDDMM | Snow depth measured at each site for each established grid. There were 1-3 grids per site (gridG#). Measurements were made every meter. YYYYDDMM is the sampling date or sampling date range YYYYMMDD-YYYYMMDD |
| Site_thawdepth_gridG#_Xm_YYYYDDMM | Thaw depth measured at each site for each established grid. There were 1-3 grids per site (gridG#). Measurements were made every meter or half meter (Xm=1m or half meter). YYYYDDMM is the sampling date or sampling date range YYYYMMDD-YYYYMMDD |
Properties of the shapefiles
Table 3: Attributes of the shapefiles.
| File Name | Attribute |
|---|---|
| All shapefiles with “ndvi” in the file name | NDVI: NOTE: The NDVI remote data using band widths of 2-7 were not data from the remote sources listed, but were calculated based on the PSII data as though they were the band widths of the remote sources for comparative purposes only Tabelle1_1: NDVI from PSII field spectrometer Tabelle1_2: NDVI from GeoEye Tabelle1_3: NDVI from AVHRR Tabelle1_4: NDVI from Landsat 5 Tabelle1_5: NDVI from Landsat 7 Tabelle1_6: NDVI from MERIS Tabelle1_7: NDVI from MODIS |
| happy_valley_hillcrest_vegetation.shp | VEGTYPE: 1 B1b - Barren 2 P1a – Prostrate dwarf-shrub, herb tundra with thin organic layer 3 P1b – Prostrate dwarf-shrub, herb tundra with thick moss and organic layer 7 G4 – Tussock-sedge, dwarf-shrub, moss tundra (acidic) 8 S1 – Erect dwarf-shrub tundra |
| happy_valley_midslope_vegetation.shp | VEGTYPE: 1 B1b - Barren 2 P1a – Prostrate dwarf-shrub, herb tundra with thin organic layer 3 P1b – Prostrate dwarf-shrub, herb tundra with thick moss and organic layer 7 G4 – Tussock-sedge, dwarf-shrub, moss tundra (acidic) 8 S1 – Erect dwarf-shrub tundra |
| happy_valley_midslope_vegetation.shp | VEGTYPE: 1 B1b - Barren 2 P1a – Prostrate dwarf-shrub, herb tundra with thin organic layer 3 P1b – Prostrate dwarf-shrub, herb tundra with thick moss and organic layer 7 G4 – Tussock-sedge, dwarf-shrub, moss tundra (acidic) 8 S1 – Erect dwarf-shrub tundra |
| sagwon_nonacidic2_vegetation.shp (*.lyr file included) | VEGTYPE: 1 B1b - Barren 3 P1b – Prostrate dwarf-shrub, herb tundra with thick moss and organic layer 5 W2 – Sedge, moss, dwarf-shrub wetland 7 G3 – Nontussock sedge, dwarf-shrub, moss tundra (nonacidic) |
| sagwon_nonacidic1_vegetation.shp (*.lyr file included) | VEGTYPE: 1 B1b - Barren 2 P1 –Prostrate dwarf-shrub, herb tundra with thin organic layer 7 G3 – Nontussock sedge, dwarf-shrub, moss tundra (nonacidic) 9 P1b –Prostrate dwarf-shrub, herb tundra with thick moss and organic layer |
| sagwon_acidic_vegetation.shp (*.lyr file included) | VEGTYPE: 1 B1b - Barren 2 P1 – Prostrate dwarf-shrub, herb tundra 4 S1 – Erect dwarf-shrub tundra 7 G4 – Tussock-sedge, dwarf-shrub, moss tundra (acidic) |
| franklin_bluffs_wet_vegetation.shp (*.lyr file included) | VEGTYPE: 1 B1b - Barren 3 P1a – Prostrate dwarf-shrub, herb tundra with thin organic layer 7 W2 – Sedge, moss, dwarf-shrub wetland within non-sorted circle 10 W2 – Sedge, moss, dwarf-shrub wetland between non-sorted circles 11 G3 – Nontussock sedge, dwarf-shrub, moss tundra (nonacidic) |
| franklin_bluffs_moist_vegetation.shp (*.lyr file included) | VEGTYPE: 1 B1b - Barren 3 P1a – Prostrate dwarf-shrub, herb tundra with thin organic layer 7 W2 – Sedge, moss, dwarf-shrub wetland within non-sorted circle 10 W2 – Sedge, moss, dwarf-shrub wetland between non-sorted circles 11 G3 – Nontussock sedge, dwarf-shrub, moss tundra (nonacidic) |
| franklin_bluffs_dry_vegetation.shp (*.lyr file included) | VEGTYPE: 1 B1b - Barren 2 P1a – Prostrate dwarf-shrub, herb tundra with thin organic layer 7 G3 – Nontussock sedge, dwarf-shrub, moss tundra (nonacidic) |
| deadhorse_vegetation.shp (*.lyr file included) | VEGTYPE: 1 B1b - Barren 2 P1a – Prostrate dwarf-shrub, herb tundra with thin organic layer 3 P1b – Prostrate dwarf-shrub, herb tundra with thick moss and organic layer 4 G3 – Nontussock sedge, dwarf-shrub, moss tundra (nonacidic) on circle rim 5 W2 – Sedge, moss, dwarf-shrub wetland 7 G3 – Nontussock sedge, dwarf-shrub, moss tundra (nonacidic) between non-sorted circles |
| west_dock_vegetation.shp (*.lyr file included)) |
VEGTYPE: |
| howe_island_vegetation.shp (*.lyr file included) | VEGTYPE: 1 B1a - Barren 5 B1b – Barren with cryptogamic crust 6 P1 – Prostrate dwarf shrub, herb tundra |
Table 4: Coordinates for the individual 10 x 10 m sampling grids at each Alaskan site. These are the extents of the vegetation and NDVI shapefile data..
| File Name | Grid | North | South | East | West |
|---|---|---|---|---|---|
| happy_valley_hillcrest_ndvi.shp | G3 | 69.146846 | 69.146752 | -148.851952 | -148.852217 |
| happy_valley_hillcrest_vegetation.shp | G3 | 69.146851 | 69.146747 | -148.851939 | -148.852229 |
| happy_valley_midslope_ndvi.shp | G2 | 69.14684 | 69.146757 | -148.848126 | -148.84836 |
| happy_valley_midslope_vegetation.shp | G2 | 69.146844 | 69.146753 | -148.848116 | -148.84837 |
| happy_valley_toeslope_ndvi.shp | G1 | 69.147069 | 69.146978 | -148.84682 | -148.847076 |
| happy_valley_toeslope_vegetation.shp | G1 | 69.147074 | 69.146974 | -148.846809 | -148.847088 |
| sagwon_acidic_ndvi.shp | G1 | 69.425502 | 69.425409 | -148.695726 | -148.695991 |
| sagwon_acidic_vegetation.shp | G1 | 69.425506 | 69.425404 | -148.695714 | -148.696003 |
| sagwon_nonacidic1_vegetation.shp | G1 | 69.433423 | 69.433295 | -148.669909 | -148.670272 |
| sagwon_nonacidic2_ndvi.shp | G2 | 69.433554 | 69.433458 | -148.671571 | -148.671846 |
| sagwon_nonacidic2_vegetation.shp | G2 | 69.43356 | 69.433453 | -148.671556 | -148.671857 |
| franklin_bluff_dry_ndvi.shp | G3 | 69.67479 | 69.674684 | -148.720751 | -148.721057 |
| franklin_bluff_moist_ndvi.shp | G2 | 69.674581 | 69.674474 | -148.720995 | -148.721304 |
| franklin_bluff_wet_ndvi.shp | G1 | 69.674194 | 69.674087 | -148.716946 | -148.717254 |
| franklin_bluffs_dry_vegetation.shp | G3 | 69.674795 | 69.674679 | -148.720737 | -148.721071 |
| franklin_bluffs_moist_vegetation.shp | G2 | 69.674586 | 69.674468 | -148.720981 | -148.721319 |
| franklin_bluffs_wet_vegetation.shp | G1 | 69.674198 | 69.674082 | -148.716933 | -148.717269 |
| deadhorse_vegetation.shp | G1 | 70.161485 | 70.161384 | -148.466644 | -148.46694 |
| deadhorse_ndvi.shp | G1 | 70.161481 | 70.161389 | -148.466656 | -148.466928 |
| west_dock_vegetation.shp | G1 | 70.374752 | 70.374636 | -148.552269 | -148.552615 |
| howe_island_vegetation.shp | G1 | 70.315169 | 70.315052 | -147.99336 | -147.993707 |
Snow and thaw depth data files
There are 29 files in comma-separated (.csv) format which provide snow depth (9 sites) and thaw depth (active layer, 11 sites) measurements in cm made at the established grids. Snow depth measurements were only made every meter. Thaw depth measurements were made every half meter or meter. There were 1-3 grids per site.
The files are named by Site, variable, grid# (s), meter or half meter (1m or halfmeter) and YYYYDDMM for the sampling date or sampling date range YYYYMMDD-YYYYMMDD: Site_snowdepth_gridG#_1m_YYYYDDMM
Example file names and descriptions:
Inuvik_thawdepth_gridG1_halfmeter_20040714.csv: Provides thaw depth measurements in cm taken every half meter at the one established grid at the Inuvik NWT site on 2004-07-14.
HappyValley_snowdepth_gridsG1-G3_1m_20020425-20060418.csv: Provides snow depth measurements in cm taken every one meter at the Happy Valley Site at all three established grids during the date range of 2002-04-25 to 2006-04-18.
Variables
All files have the same column header names.
The 1-m files for snow depth and thaw depth have measurements recorded at 11 grid points x 11 grid points as shown in Figure 5. The top row/column names are column_point_1 to column_point_11. The half meter thaw depth files have measurements recorded at 22 gridpoints x 22 gridpoints, every half meter. The number of measurements made at each site varied. The data can be sorted by by grid, date, and row_point.
Table 5. Variable descriptions in the snow and thaw depth data files (.csv).
| Variable | Description |
|---|---|
| site | Study site: seven sites in Alaska and four sites in the NWT, Canada |
| date | Date of measurement |
| grid | Grid number where measurement was taken. Sites had 1-3 grids |
| row_point_a through row_point_k | Grid point where measurement was taken on the grid when associated with the column_point below. The one meter grids had 11 x 11 points established; 11 rows (points) x 11 points (column_points). The half meter grids had 22 x 22 points established; 22 rows (points) x 22 points (column_points). In the half meter files, the column_points are named to reflect half meter increments-1, 1_5, 2, 2_5, etc. The row_points are named a, ab, b, bc through k to provide 22 rows |
| column_points_1 through 11 | Grid point where measurement was taken on the grid when associated with the row_point above. The one meter grids had 11 x 11 points established; 11 rows (points) x 11 points (column_points). The half meter grids had 22 x 22 points established; 22 rows (points) x 22 points (column_points). In the half meter files, the column_points are named to reflect half meter increments-1, 1_5, 2, 2_5, etc. The row_points are named a, ab, b, bc through k to provide 22 rows |
Table 6. Example snow depth 1m data file (showing only 7/15 columns and 3 rows of data):
| site | date | grid | row_point | column_point_1 | column_point_2 | column_point_3 |
|---|---|---|---|---|---|---|
| Franklin Bluffs | 2001-04-20 | G1 | row_point_a | 18 | 25 | 20 |
| Franklin Bluffs | 2001-04-20 | G1 | row_point_b | 22 | 21 | 15 |
| Franklin Bluffs | 2001-04-20 | G1 | row_point_c | 10 | 11 | 9 |
Table 7. Example thaw depth half meter data file (showing only 8/26 columns and 5 rows of data).
In the half meter files, the column_points are named to reflect half meter increments-1, 1_5, 2, 2_5, etc. The row_points are named a, ab, b, bc through k to provide 22 rows.
| site | date | grid | row_point | column_point_1 | column_point_1_5 | column_point_2 | column_point_2_5 |
|---|---|---|---|---|---|---|---|
| Franklin Bluffs | 2001-08-23 | G2 | row_point_a | 51 | 52 | 55 | 52 |
| Franklin Bluffs | 2001-08-23 | G2 | row_point_ab | 50 | 49 | 53 | 53 |
| Franklin Bluffs | 2001-08-23 | G2 | row_point_b | 53 | 48 | 51 | 53 |
| Franklin Bluffs | 2001-08-23 | G2 | row_point_bc | 60 | 54 | 62 | 54 |
| Franklin Bluffs | 2001-08-23 | G2 | row_point_c | 50 | 55 | 60 | 52 |
Extents of the .csv data files
Table 8. Extents for the snow and thaw depth comma-separated data files for all sites and grid locations.
| File Name | North | South | East | West |
|---|---|---|---|---|
| Deadhorse_thawdepth_gridG1_halfmeter_20000801-20060903.csv | 70.161481 | 70.161389 | -148.467 | -148.47 |
| Deadhorse_snowdepth_gridG1_1m_20010420-20050413.csv | 70.161481 | 70.161389 | -148.467 | -148.47 |
| FanklinBluffs_thawdepth_gridsG1-G3_halfmeter_20000801-20020809.csv | 69.67479 | 69.67453 | -148.721306 | -148.721306 |
| FanklinBluffs_thawdepth_gridsG1-G3_1m_20060903.csv | 69.67479 | 69.67453 | -148.721306 | -148.721306 |
| FanklinBluffs_snowdepth_gridsG1-G3_1m_20010420-20060416.csv | 69.67479 | 69.67453 | -148.721306 | -148.721306 |
| GreenCabin_thawdepth_gridsG1-G3_halfmeter_20030709 | 73.224472 | 73.218833 | -119.555694 | -119.555694 |
| GreenCabin_thawdepth_gridsG1-G3_1m_20060824 | 73.224472 | 73.218833 | -119.555694 | -119.55925 |
| HappyValley_thawdepth_gridsG1-G3_halfmeter_20010709-20020810.csv | 69.147 | 69.146778 | -148.847028 | -148.85222 |
| HappyValley_thawdepth_gridsG1-G3_1m_20060905.csv | 69.147 | 69.146778 | -148.847028 | -148.85222 |
| HappyValley_snowdepth_gridsG1-G3_1m_20020425-20060418.csv | 69.147 | 69.146778 | -148.847028 | -148.85222 |
| HoweIsland_ snowdepth_gridG1_1m_20030412-20050415.csv | 70.315169 | 70.315052 | -147.99336 | -147.993707 |
| HoweIsland thawdepth_gridG1_1m_20010824-20060904.csv | 70.315169 | 70.315052 | -147.99336 | -147.993707 |
| HoweIsland thawdepth_gridG1_halfmeter_20020816.csv | 70.315169 | 70.315052 | -147.99336 | -147.993707 |
| Inuvik_thawdepth_gridG1_1m_20060824.csv | 68.36166667 | 68.36166667 | -133.73055556 | -133.73055556 |
| Inuvik_thawdepth_gridG1_halfmeter_20040714.csv | 68.36166667 | 68.36166667 | -133.73055556 | -133.73055556 |
| Isachsen_snowdepth_gridsG1-G3_1m_20060512.csv | 78.78565 | 78.7851 | -103.55078 | -103.551517 |
| Isachsen_thawdepth_gridsG1-G3_1m_20050725-20060823.csv | 78.78565 | 78.7851 | -103.55078 | -103.551517 |
| Isachsen_thawdepth_gridsG1-G3_halfmeter_20050725-20050728.csv | 78.785317 | 78.7851 | -103.55078 | -103.551517 |
| MouldBay_snowdepth_gridsG1-G2_1m_20060512.csv | 76.228139 | 76.225889 | -119.292222 | -119.296806 |
| MouldBay_thawdepth_gridsG1-G2_1m_20060823.csv | 76.228139 | 76.225889 | -119.292222 | -119.296806 |
| MouldBay_thawdepth_gridsG1-G2_halfmeter_20040718-20040719.csv | 76.228139 | 76.225889 | -119.292222 | -119.296806 |
| SagwonAcidic_snowdepth_gridG1_1m_20010420-20050414.csv | 69.4255 | 69.4255 | -148.695972 | -148.695972 |
| SagwonAcidic_thawdepth_gridG1_halfmeter_20000801-20020806.csv | 69.4255 | 69.4255 | -148.695972 | -148.695972 |
| SagwonNonacidic_snowdepth_gridsG1-G2_1m_20010420-20050415.csv | 69.433583 | 69.433361 | -148.671833 | -148.673306 |
| SagwonNonacidic_thawdepth_gridsG1-G2_1m_20060905.csv | 69.433583 | 69.433361 | -148.671833 | -148.673306 |
| SagwonNonacidic_thawdepth_gridsG1-G2_halfmeter_20000801-20020806.csv | 69.433583 | 69.433361 | -148.671833 | -148.673306 |
| WestDock_thawdepth_gridG1_halfmeter_20010628-20020809.csv | 70.374752 | 70.374636 | -148.552269 | -148.552615 |
| WestDock_thawdepth_gridG1_1m_20000801-20060903.csv | 70.374752 | 70.374636 | -148.552269 | -148.552615 |
| WestDock_snowdepth_gridG1_1m_20010420-20050414.csv | 70.374752 | 70.374636 | -148.552269 | -148.552615 |
Table 9. Coordinates for the individual 10 x 10 m sampling grids at each NWT site.
| Site | North | South | East | West |
|---|---|---|---|---|
| Green Cabin | ||||
| Grid 1 | 73.2195 | 73.2195 | -119.55925 | -119.55925 |
| Grid 2 | 73.218833 | 73.218833 | -119.555694 | -119.555694 |
| Grid 3 | 73.224472 | 73.224472 | -119.558806 | -119.558806 |
| Mould Bay | ||||
| Grid 1 | 76.228139 | 76.228139 | -119.296806 | -119.296806 |
| Grid 2 | 76.225889 | 76.225889 | -119.292222 | -119.292222 |
| Isachsen | ||||
| Grid 1 | 78.785317 | 78.785317 | -103.550783 | -103.550783 |
| Grid 2 | 78.78565 | 78.78565 | -103.55135 | -103.55135 |
| Grid 3 | 78.7851 | 78.7851 | -103.551517 | -103.551517 |
| Inuvik | ||||
| Grid 1 | 68.110917 | 68.110917 | -133.477278 | -133.477278 |
Application and Derivation
These data could be useful to climatic change and climate impact studies.
Quality Assessment
Refer to the related publications.
Data Acquisition, Materials, and Methods
This dataset provides measurements obtained as part of a biocomplexity project on the North Slope of Alaska and the NWT, Canada. Seven sites were on the North Slope of Alaska located along the Dalton Highway and in the Prudhoe Bay Oilfield area, forming a north-south transect across the climate gradient of the North Slope. Vegetation and NDVI were mapped for the seven sites which included, from South to North, Happy Valley, Sagwon (two sites), Franklin Bluffs, Deadhorse, West Dock and Howe Island. Snow depth and thaw depth measurements were also made at the seven sites as well as four additional sites in the Northwest Territories (NWT), Canada. From South to North, these sites include Inuvik, Green Cabin, Mould Bay, and Isachsen.
At each site, permanent 10 x 10 m grids were established for repeated long-term measurements. Thaw depth, snow depth, and NDVI were sampled on the grids, usually every meter. The 10 x 10 m grids were mapped to characterize the heterogeneity of vegetation in the patterned ground ecosystems created by soils, climate and vegetation interactions. The vegetation maps were hand-drawn in the field, and later digitized as shapefiles.
Descriptions of Alaskan Sites
The Happy Valley biocomplexity sites are located in the warmest part of the Arctic, in the foothills of the Brooks Range, located just west of the Dalton Highway in the foothills of the Arctic Slope approximately 82 km (52 mi) north of Toolik Lake, Alaska at an elevation of about 320 m. Three 10 x 10 m grids were established along a hill-slope, one on the crest of the hill (dry), one on the mid-slope (mesic), and one on the toe slope (wet). Vegetation at all three included tussock-sedge, erect dwarf-shrub, moss vegetation.
The Sagwon biocomplexity sites are located at the northern edge of the rolling foothills, at the boundary with the flatter coastal plain, northwest of the Dalton Highway at an elevation of 300 m. This is also the boundary between Subzones E and D, and between the acidic tundra to the south and the nonacidic tundra to the north. Three 10 x 10 m grids were established, one with acidic tussock-sedge, erect dwarf-shrub, moss vegetation, and two grids in the nonacidic nontussock-sedge, prostrate dwarf-shrub, moss tundra.
The Franklin Bluffs biocomplexity sites are located in Subzone D, on the coastal plain of the Alaska North Slope, just west of the Sagavanirktok River. Three 10 x 10 m grids were established: one near the rim of an abandoned river terrace (dry), one on the same terrace, but further back from the edge and a little lower in elevation (mesic), and one on the lower abandoned river terrace below the first two (wet). A complex of vegetation types were at all three created by non-sorted circles, with sparser vegetation in the circles and more continuous vegetation between the circles.
The Deadhorse biocomplexity site is located near the industrial center of Deadhorse, AK, within 15-km of the Beaufort Sea coast, at an elevation of 15 m. One 10 x 10 m grid was established, with a complex of vegetation types created by non-sorted circles, with sparser vegetation in the circles and more continuous vegetation between the circles.
The West Dock biocomplexity site is located near the water pumping facility at West Dock in the Prudhoe Bay oilfield, AK, within 1-km of the Beaufort Sea coast, at an elevation of 1.5 m. One 10 x 10 m grid was established with non-tussock sedge, prostrate dwarf-shrub, moss tundra on sandy soils.
The Howe Island biocomplexity site is located on a 1.5 x 0.5-km island off the delta of the Sagavanirktok River, west of the Endicott Causeway in the Prudhoe Bay oilfield, AK, at sea level. One 10 x 10 m grid was established with a complex of vegetation types created by 10 to 30-m polygonal cracking due to permafrost ice-wedges, smaller 1 to 3-m non-sorted circles, and small 10-20 cm surficial desiccation cracking. There is sparse vegetation on the sorted circles and more continuous vegetation between the sorted circles and in the troughs between the polygons (Barreda et al., 2006).
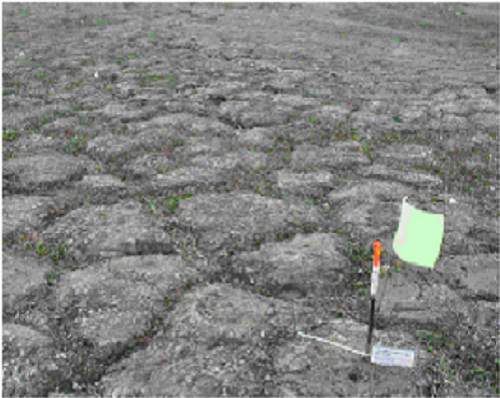
Figure 2. Small non-sorted polygons at Howe Island, AK.
Vegetation Mapping
For the seven sites in Alaska; there are no vegetation maps for the four sites in the NWT.
In 2006, maps of the vegetation types within each grid were created. Following identification of the vegetation communities, their location within the marked 10 x 10 m grid was mapped by hand on a 15-cm paper grid (1:66.7 scale). Maps of grid vegetation were hand digitized. Example maps for Howe Island are provided in Figure 4 (Barreda et al., 2006).
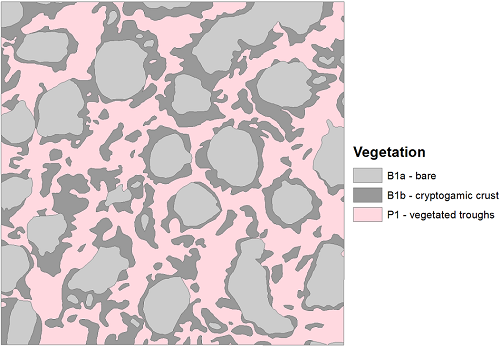
Figure 3. Vegetation map for the Howe Island site.
Snow and Thaw Depth Measurements
Beginning in August of 2000 and continuing a various sites and intervals through September 2006, thaw depth and snow depth measurements were taken by hand using a probe at each grid point located every meter (snow depth only) and sometimes at half meter on the 10 x 10 m grids.
Data were collected at flags spaced every meter along the edges and within the 10 x 10 m grid, for a total of 121 points (11 for each row and column).
See Figure 5, where: sampling point A1 is the SW corner; A11 is the SE corner; K1 is the NW corner; and K11 is the NE corner. Compass directions are approximate.
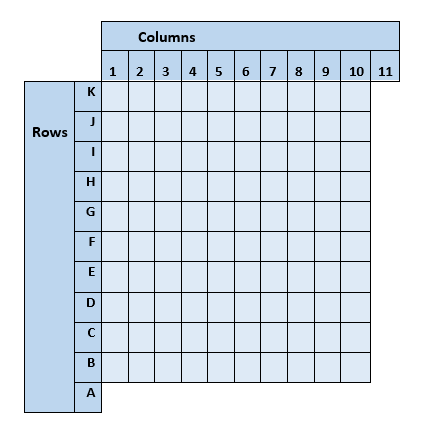
Figure 4: Sampling layout for 10 x 10 m grid plot, where sampling point A1 is the SW corner; A11 is the SE corner; K1 is the NW corner; and K11 is the NE corner. Compass directions are approximate.
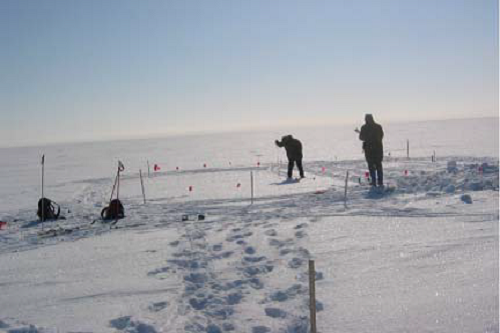
Figure 5. Snow depth measurements being taken at a site (Barreda et al., 2006).
NDVI Measurements
In 2012, measurements of NDVI were made with an Analytical Spectral Devices field spectrometer (PSII) on the same grids at all 121 points at the seven Alaskan sites. The NDVI remote data provided in the shapefiles were not data from the remote sources listed (from Geoeye, MODIS, Landsat, AVHRR, and MERIS), but were calculated based on the PSII data as though they were from those sources for comparative purposes only.
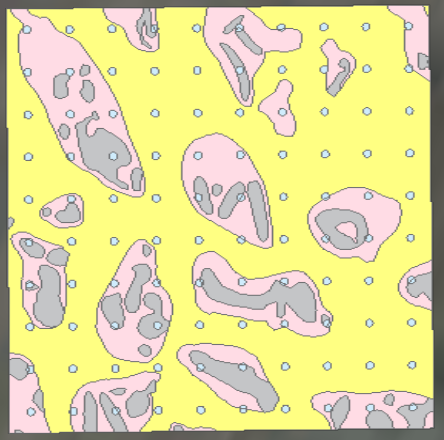
Figure 6. Franklin Bluffs dry vegetation NDVI overlay. NDVI measurements are shown as circles at each gridpoint.
Data Access
These data are available through the Oak Ridge National Laboratory (ORNL) Distributed Active Archive Center (DAAC).
Maps of Vegetation, NDVI, Snow and Thaw Depths: North Slope, Alaska and NWT, Canada
Contact for Data Center Access Information:
- E-mail: uso@daac.ornl.gov
- Telephone: +1 (865) 241-3952
References
Barreda, J.E., J. Knudson, D.A. Walker, M. K. Raynolds, A. Kade, and C. Munger. 2006. Biocomplexity of Patterned Ground Data Report Dalton Highway, 2001-2005.
Walker, D. A., H. E. Epstein, V. E. Romanovsky, C.-L. Ping, G. J. Michaelsen, R. P. Daanen, Y. Shur, R. A. Peterson, W. B. Krantz, M. K. Raynolds, W. A. Gould, G. Gonzalez, D. J. Nicolsky, C. M. Vonlanthen, A. N. Kade, H. P. Kuss, A. M. Kelley, C. A. Munger, C. T. Tarnocai, N. V. Matveeva, and F. J. A. Daniels. 2008. Arctic patterned-ground ecosystems: A synthesis of studies along a North American Arctic Transect. Journal of Geophysical Research - Biogeosciences 113:G03S01. doi:10.1029/2007JG000504