Documentation Revision Date: 2022-03-17
Dataset Version: 1
Summary
To simulate CO2 fluxes for tundra ecosystems at 30 km by 30 km and hourly resolution, eddy flux tower observations were scaled up using a variety of temperature and light response behaviors and environmental drivers. The ensemble of CO2 fluxes were evaluated using aircraft and tower measurements of CO2 concentration to determine which of these behaviors and drivers best represent the North Slope. In TVPRM, the simulated hourly CO2 fluxes are primarily controlled by light and heat: GPP is controlled by air temperature (Ta) and photosynthetically active radiation (PAR), with SIF used to define the seasonal cycle of photosynthetic capacity; plant respiration is controlled by air temperature (Ta); and soil respiration is controlled by near-surface soil temperature (Ts). NEE is the sum of these fluxes.
There are 2,890 data files in NetCDF version 4 (*.nc4) format included in this dataset and a companion file in R script (*.R) format.
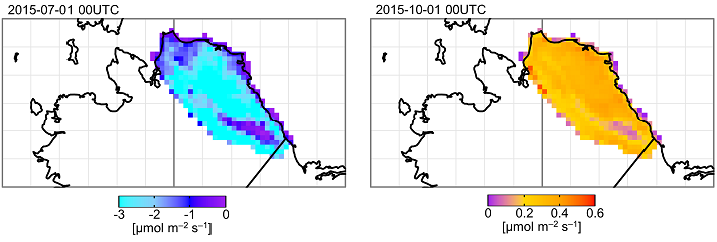
Figure 1. TVPRM net ecosystem exchange: Surface upward mass flux of carbon dioxide expressed as carbon due to emissions from natural sources for 2015-07-01 (left) and 2015-10-01 (right). The data were derived from the TVPRM model for 2015 that used "IVO" as the inland site, Barrow "CMDL" as the coastal site, "RasterCAVM" as the vegetation map, "NARR" as the meteorological product, and "GOME2" as the SIF product (as described by the source file name). Source: TVPRM_IVO_CMDL_RasterCAVM_NARR_GOME2_2015.nc4
Citation
Schiferl, L., and R. Commane. 2022. ABoVE: TVPRM Simulated Net Ecosystem Exchange, Alaskan North Slope, 2008-2017. ORNL DAAC, Oak Ridge, Tennessee, USA. https://doi.org/10.3334/ORNLDAAC/1920
Table of Contents
- Dataset Overview
- Data Characteristics
- Application and Derivation
- Quality Assessment
- Data Acquisition, Materials, and Methods
- Data Access
- References
Dataset Overview
This dataset includes hourly net ecosystem exchange (NEE) simulated by the Tundra Vegetation Photosynthesis and Respiration Model (TVPRM) at 30 km horizontal resolution for the Alaskan North Slope for 2008–2017. TVPRM calculates tundra NEE from air temperature, soil temperature, photosynthetically active radiation (PAR), and solar-induced chlorophyll fluorescence (SIF) using functional relationships derived from eddy covariance tower measurements. These relationships were then scaled over the region using gridded meteorology and a vegetation map. The site-level CO2 fluxes fell into two distinct ecosystem groups: inland tundra (ICS, ICT, ICH, IVO) and coastal tundra (ATQ, BES, BEO, CMDL). The expanded modeling framework allowed for the easy substitution of ecological behaviors and environmental drivers, including the choice of representative inland tundra site, coastal tundra site, vegetation map (CAVM, RasterCAVM, or ABoVE-LC), meteorological reanalysis product (NARR or ERA5), and SIF product (GOME2, GOSIF, or CSIF). Using all of these variations generated an ensemble of 288 different TVPRM simulations of regional CO2 flux and one additional simulation option with added aquatic and zero curtain fluxes (AqZC).
To simulate CO2 fluxes for tundra ecosystems at 30 km by 30 km and hourly resolution, eddy flux tower observations were scaled up using a variety of temperature and light response behaviors and environmental drivers. The ensemble of CO2 fluxes were evaluated using aircraft and tower measurements of CO2 concentration to determine which of these behaviors and drivers best represent the North Slope. In TVPRM, the simulated hourly CO2 fluxes are primarily controlled by light and heat: GPP is controlled by air temperature (Ta) and photosynthetically active radiation (PAR), with SIF used to define the seasonal cycle of photosynthetic capacity; plant respiration is controlled by air temperature (Ta); and soil respiration is controlled by near-surface soil temperature (Ts). NEE is the sum of these fluxes.
Project: Arctic-Boreal Vulnerability Experiment
The Arctic-Boreal Vulnerability Experiment (ABoVE) is a NASA Terrestrial Ecology Program field campaign being conducted in Alaska and western Canada, for 8 to 10 years, starting in 2015. Research for ABoVE links field-based, process-level studies with geospatial data products derived from airborne and satellite sensors, providing a foundation for improving the analysis, and modeling capabilities needed to understand and predict ecosystem responses to, and societal implications of, climate change in the Arctic and Boreal regions.
Related Publication
Schiferl, L. D., J. D. Watts, E. J. L. Larson, K. A. Arndt, S. C. Biraud, E. S. Euskirchen, J. M. Henderson, K. McKain, M. E. Mountain, J. W. Munger, W. C. Oechel, C. Sweeney, Y. Yi, D. Zona, and R. Commane. 2022. Multi-scale observations indicate unfrozen soils and inland waters drive dormant season carbon dioxide losses across the Alaska North Slope. In process.
Acknowledgments
This work was funded by NASA's ABoVE program (grant NNX17AC61A).
Data Characteristics
Spatial Coverage: Alaska's North Slope, U.S.
ABoVE Reference Locations
Domain: Core
State/Territory: Alaska
Grid cells: Ah000v000 and Ah001v00
Spatial Resolution: 30 km
Temporal Coverage: 2008-01-01 to 2017-12-31
Temporal Resolution: Hourly
Site Boundaries: Latitude and longitude are given in decimal degrees.
|
Site |
Westernmost Longitude |
Easternmost Longitude |
Northernmost Latitude |
Southernmost Latitude |
|---|---|---|---|---|
|
Alaska's North Slope |
-177.4690 |
-128.5915 |
77.2626 |
56.0894 |
Data File Information
There are 2,890 data files in NetCDF version 4 (*.nc4) format included in this dataset; one file per year for the period 2008–2017 containing hourly NEE data. Also included is the companion file TVPRM_NEE_read_plot.R, which is an R script describing how to read and plot the data from the data files. The data files are an ensemble of ecological behaviors and environmental drivers, including the choice of representative inland tundra site, coastal tundra site, meteorological reanalysis product (NARR or ERA5), vegetation map (CAVM, RasterCAVM, or ABoVE-LC), and SIF product (GOME2, GOSIF, or CSIF), which generated 288 different TVPRM simulations of regional CO2 flux. An additional simulation option using aquatic and zero curtain fluxes (AqZC) was also provided.
2,880 data files are named TVPRM_<inlandsite>_<coastalsite>_<vegmap>_<met>_<SIF>_YYYY.nc4 and 10 data files are named TVPRM_IVO_CMDL_ABoVE-LC_NARR_CSIF_AqZC_YYYY.nc4, where
- <inlandsite> is the inland site: ICS, ICT, ICH, IVO (Table 2),
- <coastalsite> is the coastal site: ATQ, BES, BEO, CMDL (Table 2),
- <vegmap> is the vegetation map: CAVM, RasterCAVM, ABoVE-LC (Table 3),
- <met> is the meteorological product: NARR, ERA5 (Table 4),
- <SIF> is the SIF products: GOME2, GOSIF, CSIF (Table 5), and
- YYYY is the year: 2008-2017.
Data File Details
Missing values are represented by -9999. The Coordinate Reference System is “Canada Albers Equal Area Conic” (ESRI:102001). The proj.4 string is "+proj=aea +lat_1=50 +lat_2=70 +lat_0=40 +lon_0=-96 +x_0=0 +y_0=0 +ellps=GRS80 +units=m +no_defs".
Table 1. Variable names and descriptions.
| Variable | Units | Description |
|---|---|---|
| NEE | umol m-2 s-1 | net ecosystem exchange; surface upward mass flux of carbon dioxide expressed as carbon due to emission from natural sources |
| lat | degrees_north | latitude |
| lon | degrees_east | longitude |
| time_bnds | hours since 2008-01-01 00:00:00 | time bounds; start and end time for each timestamp |
| time | hours since 2008-01-01 00:00:00 | middle of each hour |
| crs | coordinate reference system or projection; albers conical equal area | |
| x | m | x coordinate of projection |
| y | m | y coordinate of projection |
Table 2. Site names and descriptions.
| Site ID | Name | Ecosystem | TVPRM Group | Vegetation |
|---|---|---|---|---|
| ATQ | Atqasuk | Wet polygonized tundra | coastal | Water sedge, dwarf shrub |
| BES | Barrow Biocomplexity Experiment, South | Wetland tundra | coastal | Sedge, moss |
| BEO | Barrow Environmental Observatory | Wet polygonized tundra | coastal | Graminoid grass, sedge |
| CMDL | Barrow Climate Monitoring and Diagnostics Laboratory | Moist tundra | coastal | Graminoid grass, lichen |
| IVO | Ivotuk | Tussock tundra | inland | Tussock-forming sedge, moss |
| ICS | Imnavait Creek Wet Sedge | Wet sedge tundra | inland | Water sedge, dwarf deciduous shrub, moss |
| ICH | Imnavait Creek Heath Tundra | Dry heath tundra | inland | Dwarf evergreen shrub, deciduous shrub, lichen |
| ICT | Imnavait Creek Tussock Tundra | Moist acidic tussock tundra | inland | Tussock-forming sedge, deciduous dwarf shrub, evergreen dwarf shrub |
Table 3. Vegetation map names and descriptions.
| Vegetation Map ID | Map Name | Map Resolution | Year | Map Classification Details |
|---|---|---|---|---|
| CAVM | Circumpolar Arctic Vegetation Map | 14 km polygons, 8 km linear features | satellite data from 1993 and 1995, developed in 2003 | 15 classification units based on plant growth forms, roughly separated by summer temperature and soil moisture. Polygon classification from a combination of satellite, vegetation, temperature, topographic, and geologic data. |
| RasterCAVM | Raster version of CAVM | 1 km spatial | satellite data as in CAVM, additional data from 2000–2009 | Classification as in CAVM, redistributed at a higher resolution based on unsupervised classification using satellite and elevation data. |
| ABoVE-LC | Landsat-derived Annual Dominant Land Cover across ABoVE Core Domain | 30 m spatial | 2014 | 15 classification units based on semi-supervised classification using satellite, climate, and topographic data. |
Table 4. Meteorology product and descriptions.
| Met ID | Product Name | Product Resolution | Product Variable used in TVPRM | ||
|---|---|---|---|---|---|
| Air Temperature (Ta) | Near-surface Soil Temp. (Ts) | PAR | |||
| NARR | NOAA North American Regional Reanalysis | ~30 km spatial, 3 hourly temporal |
air.2m | tsoil (10 cm) | dswrf |
| ERA5 | ECMWF Reanalysis, fifth generation | ~31 km spatial, hourly temporal |
t2m | stl2 (7–28 cm) | ssrd |
Table 5. SIF product names and descriptions.
| SIF ID | Product Name | Product Resolution | Product Details |
|---|---|---|---|
| GOME-2 | Interpolated GOME-2 SIF (created for this study) [GOME-2: Global Ozone Monitoring Experiment- 2] |
0.01° latitudinal, daily temporal | Discrete GOME-2 SIF v27 retrievals, normalized by solar zenith angle, averaged by center point into overlapping 0.5° latitudinal bins across the North Slope domain. Temporal interpolation within each bin and latitudinal interpolation across bins are applied using loess fit smoothing. |
| GOSIF | Global ‘OCO-2’ SIF [OCO-2: Orbiting Carbon Observatory-2] |
0.05° spatial, 8 day temporal |
Aggregated OCO-2 soundings combined with MODIS enhanced vegetation index and MERRA-2 PAR, vapor pressure deficit, and air temperature to create a higher resolution gridded SIF product using multivariate linear regression. |
| CSIF | Contiguous SIF | 0.05° spatial, 4 day temporal |
Aggregated OCO-2 soundings combined with MODIS surface reflectance to create a higher resolution gridded SIF product using a neural network. |
Application and Derivation
Each TVPRM configuration is a combination of tundra ecosystem behaviors and scaling drivers with the potential to represent the spatially and temporally varying Alaskan North Slope NEE. This dataset presents results from all configuration options given the assumption that tundra ecosystems behave as observed at a particular eddy flux site and can be extrapolated in space and time using particular scaling drivers.
Quality Assessment
The multiple configuration options available represent the uncertainty and variability in quantifying the North Slope NEE based on various ecological function relationships and scaling assumptions.
Data Acquisition, Materials, and Methods
The Tundra Vegetation Photosynthesis and Respiration Model (TVPRM) was developed to simulate CO2 fluxes in the Alaskan North Slope tundra. In TVPRM, the simulated hourly CO2 fluxes are primarily controlled by light and heat: Gross primary production (GPP) is controlled by air temperature (Ta) and photosynthetically active radiation (PAR), with solar-induced fluorescence (SIF) used to define the seasonal cycle of photosynthetic capacity; plant respiration is controlled by air temperature (Ta); and soil respiration is controlled by near-surface soil temperature (Ts). Net ecosystem exchange (NEE) is the sum of these fluxes. Parameter values (αs, βs, αa, βa, λ, PAR0) for the relationships used by TVPRM are determined using year-round eddy covariance flux tower observations of CO2 flux from eight sites in various tundra ecosystems throughout the North Slope.
The site-level CO2 fluxes fell into two distinct ecosystem groups: inland tundra (ICS, ICT, ICH, IVO) and coastal tundra (ATQ, BES, BEO, CMDL; Table 2). The expanded modeling framework allowed for the easy substitution of ecological behaviors and environmental drivers, including the choice of representative inland tundra site, coastal tundra site, vegetation map (CAVM, RasterCAVM, or ABoVE-LC; Table 3), meteorological reanalysis product (NARR or ERA5; Table 4), and SIF product (GOME2, GOSIF, or CSIF; Table 5). Notable changes since the CARVE Polar Vegetation Photosynthesis and Respiration Model (PVPRM) include the use of additional site-years of CO2 flux observations (with increased data coverage over winter), more inclusive data filtering methods, and much higher temporal and spatial resolution SIF datasets.
Determining Variable Parameters Using Observed NEE
The variable parameters (αs, βs, αa, βa, λ, PAR0) were calculated for each 365-day period using a moving window (i.e., day 1=365, day 2=366, day 3=367, etc.) The moving window method accounted for variability in both day-to-day data availability and year-to-year ecosystem response to environmental drivers. The NEE in the dataset used one set of parameters for each "met+SIF" combination. The median value for each variable parameter from the set of valid 365-day periods was used in the site-level NEE evaluation and regional scaling as follows:
- Linear regression of observed NEE against Ts to determine αs and βs and calculate Rsoil.
- Linear regression of observed NEE against Ta to determine αa and βa and calculate Rplant.
- Nonlinear fitting of observed NEE against PAR, SIF, and Ta to determine λ and PAR0 and calculate GPP.
Each 365-day period must have had valid data (i.e., observed NEE, reanalyzed Ta, Ts, and PAR, and derived SIF) for 70% of potential growing days and 50% of potential non-growing days in order to calculate variable parameters. This requirement most often failed because of gaps in observed NEE. To mitigate unrealistic observed non-growing season uptake outside of noise prior to Step 1, non-growing season half-hourly observed NEE values during 24-hour periods were removed when 50% of half-hours have observed NEE and both 50% and the mean of those observed NEE values were negative. For each step, data were removed when NEE values were outside of three standard deviations of the mean.
The eddy flux data used to determine the parameters was available only for 2013–2017. It was assumed that the data were constant for the time period of 2008–2017.
Table 6. Sources of flux observations, meteorology, SIF data, and vegetation maps.
| Data Type | Source |
|---|---|
| ICS, ICT, and ICH eddy flux tower observations | http://aon.iab.uaf.edu/data |
| IVO, ATQ, BES, BEO, and CMDL eddy flux tower observations | https://doi.org/10.18739/A2X34MS1B |
| NARR meteorology | https://psl.noaa.gov/data/gridded/data.narr.html |
| ERA5 meteorology | https://www.ecmwf.int/en/forecasts/dataset/ecmwf-reanalysis-v5 |
| GOME-2 SIF | https://avdc.gsfc.nasa.gov/pub/data/satellite/MetOp/GOME_F/ |
| GOSIF | https://globalecology.unh.edu/data/GOSIF.html |
| CSIF | https://figshare.com/articles/dataset/CSIF/6387494 |
| CAVM vegetation map | https://www.geobotany.uaf.edu/cavm/ |
| RasterCAVM vegetation map | https://doi.org/10.17632/c4xj5rv6kv.1 |
| ABoVE-LC vegetation map | https://doi.org/10.3334/ORNLDAAC/1691 |
Data Access
These data are available through the Oak Ridge National Laboratory (ORNL) Distributed Active Archive Center (DAAC).
ABoVE: TVPRM Simulated Net Ecosystem Exchange, Alaskan North Slope, 2008-2017
Contact for Data Center Access Information:
- E-mail: uso@daac.ornl.gov
- Telephone: +1 (865) 241-3952
References
Schiferl, L. D., J. D. Watts, E. J. L. Larson, K. A. Arndt, S. C. Biraud, E. S. Euskirchen, J. M. Henderson, K. McKain, M. E. Mountain, J. W. Munger, W. C. Oechel, C. Sweeney, Y. Yi, D. Zona, and R. Commane. 2022. Multi-scale observations indicate unfrozen soils and inland waters drive dormant season carbon dioxide losses across the Alaska North Slope. In process.