Documentation Revision Date: 2021-08-04
Dataset Version: 1
Summary
These CO2 flux and model driver data were used to create gridded estimates of CO2 emissions by applying a Boosted Regression Tree (BRT) machine learning approach. The gridded estimates are provided in a related dataset.
There is one data file in comma-separated format (.csv) with this dataset.
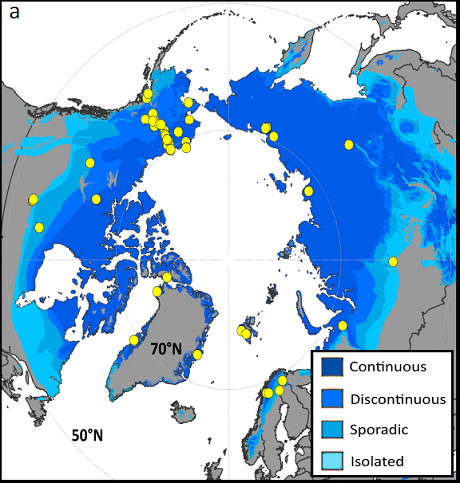
Figure 1. Locations of in situ winter CO2 flux data (yellow circles) in this synthesis, which included upland and wetland sites in boreal and tundra biomes located within the Northern permafrost region. Occurrence of permafrost is displayed. (From Natali et al., 2019).
Citation
Natali, S., J.D. Watts, S. Potter, B.M. Rogers, S. Ludwig, A. Selbmann, P. Sullivan, B. Abbott, K. Arndt, A.A. Bloom, G. Celis, T. Christensen, C. Christiansen, R. Commane, E. Cooper, P.M. Crill, C.I. Czimczik, S. Davydov, J. Du, J. Egan, B. Elberling, S.E. Euskirchen, T. Friborg, H. Genet, J. Goodrich, P. Grogan, M. Helbig, E. Jafarov, J. Jastrow, A. Kalhori, Y. Kim, J.S. Kimball, L. Kutzbach, M. Lara, K. Larsen, B. Lee, Z. Liu, M.M. Loranty, M. Lund, M. Lupascu, N. Madani, A. Malhotra, R. Matamala, J. McFarland, A. McGuire, A. Michelsen, C. Minions, W. Oechel, D. Olefeldt, F. Parmentier, N. Pirk, B. Poulter, W. Quinton, F. Rezanezhad, D. Risk, T. Sachs, K. Schaefer, N. Schmidt, E.A.G. Schuur, P. Semenchuk, G. Shaver, O. Sonnentag, G. Starr, C. Treat, M. Waldrop, Y. Wang, J. Welker, C. Wille, X. Xu, Z. Zhang, Q. Zhuang, and D. Zona. 2019. Synthesis of Winter In Situ Soil CO2 Flux in pan-Arctic and Boreal Regions, 1989-2017. ORNL DAAC, Oak Ridge, Tennessee, USA. https://doi.org/10.3334/ORNLDAAC/1692
Table of Contents
- Dataset Overview
- Data Characteristics
- Application and Derivation
- Quality Assessment
- Data Acquisition, Materials, and Methods
- Data Access
- References
Dataset Overview
This dataset provides a synthesis of winter (September-April) in situ soil CO2 flux measurement data from locations across pan-Arctic and Boreal permafrost regions. The in situ data were compiled from 66 published and 21 unpublished studies conducted from 1989-2017. The data sources (publication references) are provided. Sampling sites spanned pan-Arctic Boreal and tundra regions (>53 Deg N) in continuous, discontinuous, and isolated/sporadic permafrost zones. The CO2 flux measurements were aggregated at the monthly level, or seasonally when monthly data were not available, and are reported as the daily average (g C m-2 day-1) over the interval. Soil moisture and temperature data plus environmental and ecological model driver data (e.g., vegetation type and productivity, soil substrate availability) are also included based on gridded satellite remote sensing and reanalysis sources.
These CO2 flux and model driver data were used to create gridded estimates of CO2 emissions by applying a Boosted Regression Tree (BRT) machine learning approach. The gridded estimates are provided in a related dataset listed below.
Project: Arctic-Boreal Vulnerability Experiment
The Arctic-Boreal Vulnerability Experiment (ABoVE) is a NASA Terrestrial Ecology Program field campaign conducted in Alaska and western Canada between 2016 and 2021. Research for ABoVE links field-based, process-level studies with geospatial data products derived from airborne and satellite sensors, providing a foundation for improving the analysis, and modeling capabilities needed to understand and predict ecosystem responses to, and societal implications of, climate change in the Arctic and Boreal regions.
Related Publication:
Natali, S. J.D. Watts, S. Potter, B.M. Rogers, and S.M. Ludwig et al., 2019. Large loss of CO2 in winter observed across pan-Arctic permafrost region. Nature Climate Change
Related Dataset:
Watts, J., S. Natali, S. Potter, and B.M. Rogers. 2019. Gridded Winter Soil CO2 Flux Estimates for pan-Arctic and Boreal Regions, 2003-2100. ORNL DAAC, Oak Ridge, Tennessee, USA. https://doi.org/10.3334/ORNLDAAC/1683
Acknowledgements:
This research was funded as part of NASA's Arctic Boreal Vulnerability Experiment under grant number NNX15AT81A.
Data Characteristics
Spatial Coverage: pan-Arctic boreal and tundra regions (>53 Deg N)
ABoVE reference locations:
Domain: Core ABoVE (Alaska and Canada only)
Ah0Av0.Bh5Bv5.Ch035Cv003
Ah0Av1.Bh1Bv9.Ch08Cv58, Ah0Av1.Bh1Bv9.Ch08Cv59, Ah0Av1.Bh4Bv6.Ch28Cv40, Ah0Av1.Bh4Bv6.Ch29Cv41, Ah0Av1.Bh5Bv6.Ch30Cv41, Ah0Av1.Bh4Bv7.Ch28Cv42, Ah0Av1.Bh2Bv9.Ch15Cv55
Ah1Av0.Bh6Bv1.Ch036Cv06, Ah1Av0.Bh6Bv1.Ch37Cv07, Ah1Av0.Bh6Bv5.Ch36Cv31, Ah1Av0.Bh6Bv5.Ch037Cv31, Ah1Av0.Bh6Bv5.Ch36Cv33, Ah1Av0.Bh6Bv2.Ch41Cv12, Ah1Av0.Bh6Bv4.Ch41Cv27, Ah1Av0.Bh6Bv4.Ch41Cv28, Ah1Av0.Bh6Bv4.Ch40Cv29, Ah1Av0.Bh6Bv5.Ch38Cv30, Ah1Av0.Bh6Bv5.Ch38Cv31, Ah1Av0.Bh6Bv5.Ch39Cv32, Ah1Av0.Bh6Bv5.Ch38Cv33, Ah1Av0.Bh6Bv5.Ch39Cv33, Ah1Av0.Bh6Bv5.Ch39Cv34, Ah1Av0.Bh7Bv4.Ch45Cv24, Ah1Av0.Bh7Bv4.Ch44Cv25, Ah1Av0.Bh7Bv4.Ch46Cv05, Ah1Av0.Bh7Bv4.Ch42Cv27, Ah1Av0.Bh7Bv3.Ch47Cv19, Ah1Av0.Bh7Bv3.Ch7Cv21, Ah1Av0.Bh7Bv3.Ch47Cv22, Ah1Av0.Bh7Bv3.Ch46Cv23, Ah1Av0.Bh7Bv2.Ch042Cv13, Ah1Av0.Bh7Bv2.Ch43Cv14, Ah1Av0.Bh7Bv0.Ch45Cv00, Ah1Av0.Bh7Bv0.Ch46Cv02, Ah1Av0.Bh7Bv1.Ch46Cv08, Ah1Av0.Bh11Bv0.Ch69Cv00, Ah1Av0.Bh10Bv0.Ch64Cv05, Ah1Av0.Bh10Bv1.Ch064Cv06, Ah1Av0.Bh9Bv1.Ch58Cv11, Ah1Av0.Bh9Bv2.Ch54Cv17, Ah1Av0.Bh8Bv3.Ch52Cv18, Ah1Av0.Bh8Bv3.Ch52Cv18, Ah1Av0.Bh8Bv3.Ch52Cv18, Ah1Av0.Bh8Bv3.Ch052Cv18, Ah1Av0.Bh8Bv3.Ch052Cv18, Ah1Av0.Bh8Bv3.Ch052Cv18, Ah1Av0.Bh8Bv3.Ch052Cv18, Ah1Av0.Bh8Bv3.Ch048Cv19, Ah1Av0.Bh8Bv3.Ch050Cv19, Ah1Av0.Bh8Bv3.Ch052Cv19, Ah1Av0.Bh8Bv3.Ch048Cv20, Ah1Av0.Bh8Bv3.Ch049Cv20, Ah1Av0.Bh8Bv3.Ch051Cv20, Ah1Av0.Bh8Bv3.Ch048Cv21, Ah1Av0.Bh8Bv3.Ch049Cv21, Ah1Av0.Bh8Bv3.Ch050Cv21, Ah1Av0.Bh8Bv3.Ch051Cv19, Ah1Av0.Bh8Bv3.Ch049Cv22, Ah1Av0.Bh8Bv3.Ch049Cv23, Ah1Av0.Bh8Bv2.Ch053Cv16, Ah1Av0.Bh8Bv2.Ch052Cv17, Ah1Av0.Bh8Bv1.Ch049Cv06
Ah1Av1.Bh6Bv6.Ch41Cv36
Ah2Av1.Bh13Bv6.Ch79Cv41, Ah2Av1.Bh16Bv7.Ch101Cv47, Ah2Av1.Bh19Bv6.Ch09Cv74, Ah2Av1.Bh15Bv7.Ch92Cv45
Ah3Av1.Bh23Bv7.Ch140Cv44, Ah3Av1.Bh16Bv18.Ch110Cv48
Ah4Av0.Bh27Bv5.Ch166Cv30
Ah4Av1.Bh24Bv6.Ch149Cv40
Spatial Resolution: multiple points
Temporal Resolution: monthly during the winter non-growing season (September – April) of each year
Temporal Coverage: 1989-09-01 to 2017-04-30
Study Area: (all latitudes and longitudes given in decimal degrees)
| Site (Region) | Westernmost Longitude | Easternmost Longitude | Northernmost Latitude | Southernmost Latitude |
|---|---|---|---|---|
| Circumpolar Arctic | -163.711 | 161.992 | 78.917 | 53.876 |
Data File Information
There is one data file in comma-separated format (.csv) - nongrowing_season_CO2_flux.csv - and one companion file with the data sources (publication references) - Sources_nongrowing_season_CO2_flux.pdf.
Table 1. Variables in nongrowing_season_CO2_flux.csv. Missing data are represented by -9999'.
|
Column name |
Units |
Description |
|
author |
|
1st author of paper, last name |
|
pub_yr |
Year |
Publication year |
|
title |
|
Publication title |
|
journal |
|
Publication journal |
|
latitude |
Decimal degrees |
Latitude North |
|
longitude |
Decimal degrees |
Longitude East |
|
loc |
|
Location description from publication (e.g., city, state, field station) |
|
site |
|
Sites (e.g., different veg types) within a location |
|
country |
|
Country |
|
biome |
|
Boreal or tundra |
|
tsoil |
°C |
Soil temperature during the measurement interval; 10 cm average depth |
|
permafrost_reported |
|
Reported permafrost (Y=yes; N=no; na= not mentioned/known) |
|
meas_method |
|
Measurement method. ch (chamber on soil); ch_snow (chamber placed on top of snow pack); diff (diffusion through snow pack); ECC (eddy covariance closed path); ECO (eddy covariance open path); SL (soda lime) |
|
meas_mo_start |
|
1st measurement month for flux data in this row |
|
meas_yr_start |
|
1st measurement year for flux data in this row |
|
meas_mo_end |
|
Last measurement month for flux data in this row |
|
meas_yr_end |
|
Last measurement year for flux data in this row |
|
meas_mo_start_2 |
|
If >1 data interval; same as above |
|
meas_yr_start_2 |
|
If >1 data interval; same as above |
|
meas_mo_end_2 |
|
If >1 data interval; same as above |
|
meas_yr_end_2 |
|
If >1 data interval; same as above |
|
season |
|
Sub-season during the winter when data were collected. E (early)=Aug-Nov; M (mid)=Dec-Feb; L(late)=Mar-Jun; NGS=spans > 1 season |
|
spatial_replicates |
|
Number of spatial replicates (within the source) |
|
temporal_replicates |
|
Number of temporal replicates (within the source); eddy towers all reported as >100 |
|
winter_flux |
g C m-2 day-1 |
Monthly aggregated winter flux |
|
se_flux |
g C m-2 day-1 |
Flux standard error |
|
gpp_meas |
g C m-2 yr-1 |
Annual GPP from previous growing season |
|
landcover * |
|
Vegetation classification. CAVM (Walker et al. 2005) for tundra regions, ESA CCI Land Cover (ESA 2014) for non-tundra; corrected based on site descriptions. See table 2 for classes. |
|
evi_meanband * |
|
MODIS; mean EVI from previous growing season |
|
perm_zone * |
|
Permafrost zone; Brown et al. (2002) |
|
pzi * |
|
Permafrost zonation index (Gruber 2013) |
|
soc * |
% |
SOC density (% by weight) in top 30 cm, SoilGrids (Hengl et al. 2017) |
|
sand * |
% |
Soil Sand % in top 30 cm, SoilGrids (Carroll et al. 2017) |
|
silt * |
% |
Soil Silt % in top 30 cm, SoilGrids (Carroll et al. 2017) |
|
modis_treecover * |
% |
Tree cover (%), MODIS 205m C6 (Hansen et al. 2003), year of measurement start (or 2000 for pre-2000 measurements) |
|
smap_gpp * |
g C m-2 yr-1 |
9-km SMAP L4C Nature Run 4.1 (Jones et al. 2017) |
|
modis_lai * |
m2 m-2 |
Max leaf area index (LAI) (Myneni et al. 2015) within July 10 through Aug 20 window |
|
amsr_vsm * |
cm3 cm-3 |
Mean microwave AMSR soil/litter surface non-frozen moisture for month of flux observation. 25 km res. 0 = frozen state. Note: 2002-16 climatology for years prior to 2002, (Du et al. 2017) |
|
amsr_vsm_sum * |
cm3 cm-3 |
Mean microwave AMSR soil/litter surface non-frozen moisture for summer (June, July) prior to flux observation. 0 = frozen state. 25 km res. Note: 2002-16 climatology for years prior to 2002, (Du et al. 2017) |
|
tair_ra * |
K |
Air Temp at 2 m height (K), NASA MERRA 2, (Reichle et al. 2017) |
|
tsoil_ra1 * |
K |
Soil Temp (K) in first soil layer from surface, NASA MERRA 2, Reichle et al. 2017) |
|
soil_moisture_ra |
|
Soil moisture |
User Notes:
- Data extracted from gridded datasets are marked with an asterisk; otherwise in situ measured data are from publications or unpublished datasets.
- Columns author, pub_yr, and title are the index fields to cross reference to the publication references companion file -- Sources_nongrowing_season_CO2_flux.pdf.
- Unpublished data are denoted with values for author and pub_yr, where pub_yr provides a code for the source, e.g., unpub5 and unpub6.
Table 2. Land cover classes extracted from the Circumpolar Arctic Vegetation Map (CAVM) (Walker et al. 2005) for tundra regions, ESA CCI Land Cover (ESA 2014) for non-tundra.
| Source | Code | Land Cover Description |
|---|---|---|
| CAVM | P2 | Prostrate dwarf shrub and forb tundra |
| CAVM | S1 | Erect dwarf shrub tundra |
| CAVM | S2 | Erect low shrub tundra |
| CAVM | G1-G4 | Graminoid tussock and non-tussock (sedge, moss, minimal shrub) |
| CAVM | W1 | Wet sedge, grass and moss tundra |
| CAVM | W2 | Wet sedge, shrub and moss tundra |
| CAVM | NMC | Noncarbonate mountain complex (barren; minimal plant cover) |
| CAVM | CMC | Carbonate mountain complex (barren; minimal plant cover) |
| CCI | SBV | Sparse boreal vegetation (tree, shrub, herb) |
| CCI | BDF | Deciduous broadleaved forest, closed to open canopy |
| CCI | DNF | Deciduous needle leaf forest, closed to open canopy |
| CCI | ENLF | Evergreen needle leaf forest, closed to open canopy |
| CCI | BSW | Shrub or herb cover, flooded |
Application and Derivation
This study provides a critical constraint on carbon budgets for the Arctic during a period of greatest uncertainty and provides further insight into the drivers, magnitudes, and variability of CO2 released during the winter season.
Quality Assessment
The standard error of CO2 flux is included in the dataset.
Data Acquisition, Materials, and Methods
In situ winter season (Sept-April) CO2 emissions and potential driving variables were compiled from sites within the northern permafrost zone. The data included 66 published studies and 21 unpublished studies conducted at 104 sites (i.e., sample areas with unique geographic coordinates) and in 152 sampling locations (i.e., different locations within a site as distinguished by vegetation type, landscape position, etc.). Sites spanned boreal and tundra landcover classes (Table 2) in continuous permafrost (n=69), discontinuous (n=24), and isolated/sporadic (n=11) permafrost zones (Fig. 1). Data were aggregated at the monthly level; however, the number of measurements per month varied among studies. The dataset included more than 1000 site-month flux measurements (Natali et al., 2019).
Data were collected using several measurement methods:
1. Chamber: chamber placed over the ground after digging a snow pit or placed underneath the snowpack prior to snow accumulation, and gas flux measured as a change in gas concentration in the chamber over time;
2. Chamber-snow: chamber placed on top of the snow pack, and flux measured as a change in gas concentration in the chamber over time;
3. Diffusion: Gas concentrations measured at two or more locations through the snow pack, and gas flux calculated based on gas diffusion rate through the snowpack;
4. Eddy covariance: Gas flux calculated based on covariance of gas concentration and vertical wind velocity; separated into closed path (air is drawn in through a sampling tube to an infrared gas analyzer) and open path (air passes freely between infrared source and detector) systems;
5. Soda lime: Seasonal release of CO2 from soils determined from CO2 adsorption onto soda lime placed in a closed chamber on top of the soil.
Fluxes of net ecosystem exchange (NEE) were used for eddy covariance data, or when fluxes were partitioned, ecosystem respiration, which were essentially the same during the winter. When a monthly winter flux was negative (i.e., signifying CO2 uptake), that month was excluded from the dataset. For experimental sites, only control or unmanipulated plots were included.
Regional gridded geospatial products
Data were extracted from regional gridded geospatial products including climatological data, soil temperature and moisture, snow water equivalent, soil carbon stocks and texture, permafrost status, vegetation cover, proxies of vegetation growth and productivity (e.g.,enhanced vegetation index, EVI; leaf area index, LAI; gross primary productivity, GPP) (Natali et al., 2019, in process).
Data Access
These data are available through the Oak Ridge National Laboratory (ORNL) Distributed Active Archive Center (DAAC).
Synthesis of Winter In Situ Soil CO2 Flux in pan-Arctic and Boreal Regions, 1989-2017
Contact for Data Center Access Information:
- E-mail: uso@daac.ornl.gov
- Telephone: +1 (865) 241-3952
References
Brown, J., Ferrians, O., Heginbottom, J. and Melnikov, E. Circum-Arctic map of permafrost and ground-ice conditions, version 2. (2002).
Du, J., J.S. Kimball, L.A. Jones, Y. Kim, J. Glassy, and J.D. Watts. 2017. A global satellite environmental data record derived from AMSR-E and AMSR2 microwave Earth observations. Earth Syst. Sci. Data, 9, 791–808, 2017. https://doi.org/10.5194/essd-9-791-2017.
ESA-European Space Agency, 2014. CCI Land Cover Product User Guide version 2.4, 448ESA CCI LC project.
Gruber, Stephan & National Center for Atmospheric Research Staff (Eds). Last modified 08 Oct 2013. The Climate Data Guide: Global Permafrost Zonation Index Map. Retrieved from https://climatedataguide.ucar.edu/climate-data/global-permafrost-zonation-index-map.
Hansen, M.C., R.S. DeFries, J.R.G. Townshend, M. Carroll, C. Dimiceli, and R.A. Sohlberg. Global Percent Tree Cover at a Spatial Resolution of 500 Meters: First Results of the MODIS Vegetation Continuous Fields Algorithm. Earth Interactions Volume 7 (2003). https://doi.org/10.1175/1087-3562(2003)007<0001:GPTCAA>2.0.CO;2
Hengl, T., J. Mendes de Jesus, G. B.M. Heuvelink, M. Ruiperez Gonzalez, M. Kilibarda et al. (2017) SoilGrids250m: global gridded soil information based on Machine Learning. PLoS ONE 12(2): e0169748. https://doi.org/10.1371/journal.pone.0169748.
Jones, L.A., J.S. Kimball, R.H. Reichle, N. Madani, J. Glassy, J.V. Ardizzone et al. 2017. The SMAP Level 4 Carbon Product for Monitoring Ecosystem Land–Atmosphere CO2Exchange. IEEE Transactions on Geoscience and Remote Sensing. 55: 11, https://doi.org/10.1109/TGRS.2017.2729343
Myneni, R., Knyazikhin, Y., Park, T. (2015). MOD15A2H MODIS Leaf Area Index/FPAR 8-Day L4 Global 500m SIN Grid V006. NASA EOSDIS Land Processes DAAC. http://doi.org/10.5067/MODIS/MOD15A2H.006 (Terra), http://doi.org/10.5067/MODIS/MYD15A2H.006 (Aqua)
Natali, S., J.D. Watts, S. Potter, B.M. Rogers, and S.M. Ludwig, A.-K. Selbmann, P.F. Sullivan, B.W. Abbott, K.A. Arndt, L.Birch, M.P Björkman, A.A. Bloom, G. Celis, T.R. Christensen, C.T. Christiansen, R. Commane, E.J. Cooper, P. Crill, C. Czimczik, S. Davydov, J. Du, J.E. Egan, B. Elberling, E.S. Euskirchen, T. Friborg, H. Genet, M. Göckede, J.P. Goodrich, P. Grogan, M. Helbig, E.E. Jafarov, J.D. Jastrow, A.A.M. Kalhori, Y. Kim, J. Kimball, L. Kutzbach, M.J. Lara, K.S. Larsen, Z. Liu, M.M. Loranty, M. Lund, M. Lupascu, N. Madani, R. Matamala, A. Malhotra, J. McFarland, A.D. McGuire, A. Michelsen, C. Minions, W.C. Oechel,, D. Olefeldt, F.-J.W. Parmentier, N. Pirk, B. Poulter, W. Quinton, F. Rezanezhad, D. Risk, T. Sachs, K. Schaefer, N.M. Schmidt, E.A.G. Schuur, P.R. Semenchuk, G. Shaver, O. Sonnentag, G. Starr, C.C. Treat, M.P. Waldrop, Y. Wang, J. Welker, C. Wille, X. Xu, Z. Zhang, Q. Zhuang, and D. Zona. Large loss of CO2 in winter observed across pan-arctic permafrost region. Nature Climate Change.
Reichle, R.H., Q. Liu, R.D. Koster, C.S. Draper, and S.P.P. Mahanama, G.S. Partyka. 2017. Land Surface Precipitation in MERRA-2. J. Clim, 30, 5, 1643-1664. https://doi.org/10.1175/JCLI-D-16-0570.1.
Walker, D.A., Raynolds, M.K., Daniëls, F.J., Einarsson, E., Elvebakk, A., Gould, W.A., Katenin, A.E., Kholod, S.S., Markon, C.J., Melnikov, E.S. and Moskalenko, N.G., 2005. The circumpolar Arctic vegetation map. Journal of Vegetation Science, 16(3), pp.267-282. http://dx.doi.org/10.1111/j.1654-1103.2005.tb02365.x