Documentation Revision Date: 2020-02-17
Dataset Version: 1
Summary
There are four data files in GeoTIFF (.tif) format and one data file in comma-separated (.csv) with this dataset. The .csv provides the field surface site burn severity values with paired remote sensing values.
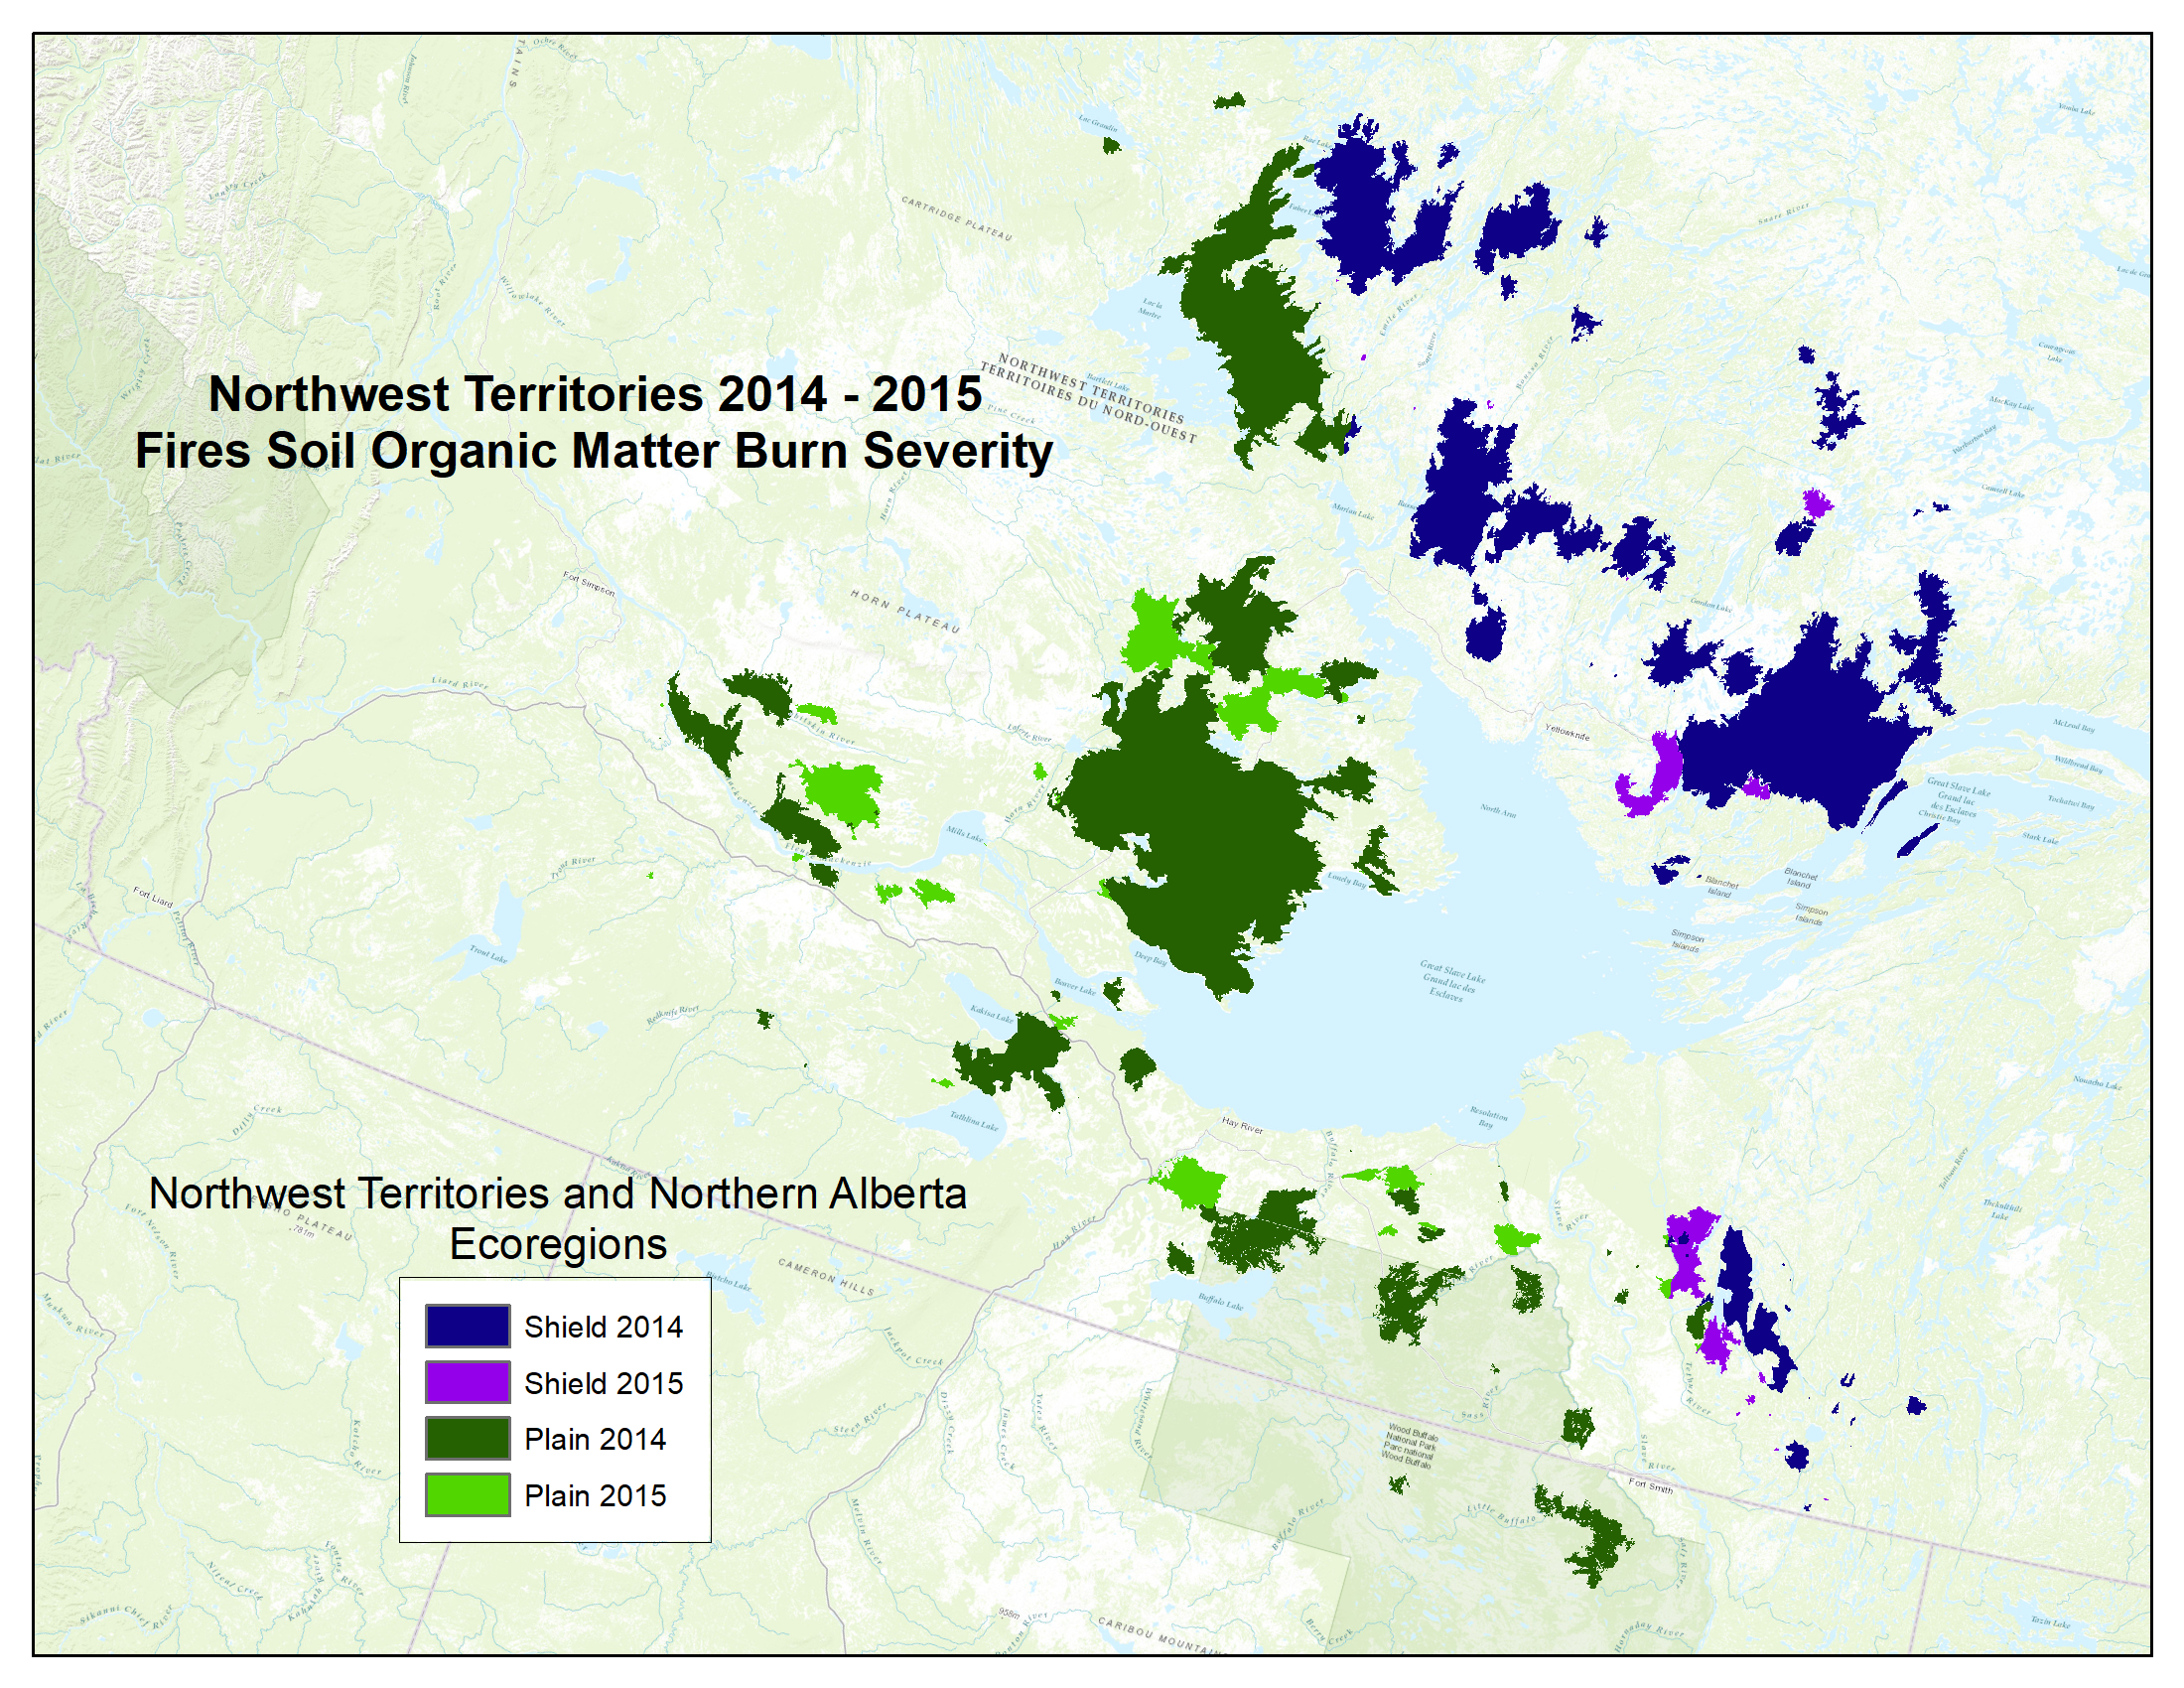
Figure 1. Study area included sites burned in 2014 and 2015 in the southeastern portion of the Northwest Territories and northern Alberta of Canada. The study area includes all 2014 and 2015 fires within a radius of approximately 300 km from Great Slave Lake.
Citation
French, N.H.F., J.A. Graham, L.L. Bourgeau-Chavez, S. Grelick, and E. Whitman. 2020. ABoVE: Burn Severity of Soil Organic Matter, Northwest Territories, Canada, 2014-2015. ORNL DAAC, Oak Ridge, Tennessee, USA. https://doi.org/10.3334/ORNLDAAC/1694
Table of Contents
- Dataset Overview
- Data Characteristics
- Application and Derivation
- Quality Assessment
- Data Acquisition, Materials, and Methods
- Data Access
- References
Dataset Overview
This dataset provides maps at 30-m resolution of landscape surface burn severity (surface litter and soil organic layers) from the 2014-2015 fires in the Northwest Territories and Northern Alberta, Canada. The maps were derived from Landsat 8 Operational Land Imager/Thermal Infrared Sensor (OLI/TIRS) imagery and two separate multiple linear regression models trained with field data; one for the Plains and a second for the Shield ecoregion. Field observations were used to estimate area burned in each of five severity classes (unburned, singed, light, moderate, severely burned) in six stratified randomly selected plots of 10 x 10-m in size across a 1-ha site. Using this five class scale a burn severity index (BSI) for each 1-ha site was calculated using multiple weighted and averaged field parameters. Pre- and post-fire phenologically paired Landsat 8 images were used to model the five discrete severity classes using midpoints as breaks.
Project: Arctic-Boreal Vulnerability Experiment (ABoVE)
The Arctic-Boreal Vulnerability Experiment is a NASA Terrestrial Ecology Program field campaign taking place in Alaska and western Canada between 2016 and 2021. Climate change in the Arctic and Boreal region is unfolding faster than anywhere else on Earth, resulting in reduced Arctic sea ice, thawing of permafrost soils, decomposition of long-frozen organic matter, widespread changes to lakes, rivers, coastlines, and alterations of ecosystem structure and function. ABoVE seeks a better understanding of the vulnerability and resilience of ecosystems and society to this changing environment.
Related Publication:
French, N.H.F., J.A. Graham, E. Whitman, and L.L. Bourgeau-Chavez. (in review). Quantifying Severity of the 2014 and 2015 Fires in the Great Slave Lake Area of Canada. Submitted to: International Journal of Wildland Fire.
Related Dataset:
Bourgeau-Chavez, L.L., S. Endres, L. Jenkins, M. Battaglia, E. Serocki, and M. Billmire. 2017. ABoVE: Burn Severity, Fire Progression, and Field Data, NWT, Canada, 2015-2016. ORNL DAAC, Oak Ridge, Tennessee, USA. https://doi.org/10.3334/ORNLDAAC/1548
In addition to the dataset referenced above in this study, the are several datasets related to the 2014-2015 wildfires archived at the ORNL DAAC.
Acknowledgement:
This study was supported by the NASA Terrestrial Ecology ABoVE program through grant NNX15AT83A.
Data Characteristics
Spatial Coverage: Northwest Territories and Northern Alberta, Canada
ABoVE Reference Locations:
Domain: Core ABoVE
State/territory: Canada
Grid cells: Ah001v001, Ah002v002, Ah002v001, Bh012v009, Bh013v009, Bh014v009, Bh013v011, Bh014v011, Bh011v010, Bh012v010, Bh013v010, Bh014v010, Bh011v011, Bh011v012, Bh012v012, Bh013v012, Bh014v012, Bh013v013, Bh014v013
Spatial Resolution: 30 m
Temporal Coverage: 2014-05-01 to 2015-10-01
Temporal Resolution: one time
Study Areas (All latitude and longitude given in decimal degrees)
|
Site |
Westernmost Longitude |
Easternmost Longitude |
Northernmost Latitude |
Southernmost Latitude |
|---|---|---|---|---|
|
Northwest Territories and Northern Alberta, Canada |
-124.03 |
-108.83 |
65.55 |
58.29 |
Data File Information
The dataset includes four surface burn severity files in GeoTiff (.tif) format and one file in comma-separated (.csv) format.
Table 1. File names and descriptions
|
File Name |
Description |
|---|---|
| shield2014_burnclass.tif and shield2015_burnclass.tif | These files provide surface burn severity data for the Shield fires in 2014 or 2015. |
|
plain2014_burnclass.tif and plain2015_burnclass.tif |
These files (two files) provide surface burn severity data for the Plains fires in 2014 or 2015. |
|
nwt_burn_severity_training_data.csv |
This file provides the burned site ID, plot burn severity index (BSI), the Normalized Burn Ratio (NBR), and the Difference Normalized Burn Ratio (dNBR) |
Properties of the GeoTIFF Files
Type: Projected
Geographic Coordinate Reference: GCS_North_American_1983
Projection: Canada_Albers_Equal_Area_Conic
Unit: m
Number of Bands: 1
No Data Value: 128
Raster values range from 1 – 9:
1=Unburned
2=Singed
3=Light
4=Moderate
5=Severe
8=Water
9=Sparsely Vegetated
Table 2. Burn site, burn severity index, and Landsat data in the file nwt_burn_severity_training_data.csv
| Variable | Units/format | Description |
|---|---|---|
| id | Burn site ID | |
| latitude | Decimal degrees | Latitude of the study site |
| longitude | Decimal degrees | Longitude of the study site |
| type | Categorical | Upland or Wetland |
| region | Categorical | Shield or Plain |
| plot_bsi | 05-Jan | Plot burn severity index |
| dband5 | ||
| preNBR | Pre-fire NBR | |
| postNBR | Post-fire NBR | |
| dNBR | Normalized difference NBR | |
| preNBR2 | Pre-fire NBR | |
| postNBR2 | Post-fire NBR | |
| dNBR2 | Normalized difference NBR | |
| rdNBR | Relative differenced Normalized Burn Ratio (RdNBR) | |
| RBR | Relativized burn ratio (RBR) |
Application and Derivation
The maps would be useful in the investigation of the impacts and consequences of the 2014 and 2015 fires in Northwest Territories.
Quality Assessment
The multiple linear regression models were cross-validated using k-folds validation with 100 repeats. In the Shield where n=25, k=3 and in the Plains where n=95, k=10. For the Shield model the cross-validated root mean square error=0.30, R2=0.73, and mean absolute error=0.25. For the Plains model the cross-validated root mean square error=0.55, R2=0.67, and mean absolute error=0.44.
It was noted that the northern edge of lakes was frequently classified as severe. This was determined to be an artifact of changing lake levels and shadowing. To correct the result of multiple majority filter passes on the classified output was applied to pixels surrounding water bodies. This resulted in <0.5% change of any of the severity classes and water classification by +1.1%, -0.6%, +2.5%, and +1.1% on the 2014 Plains, 2015 Plains, 2014 Shield, and 2015 Shield maps, respectively. The marginal increase in the water class was deemed to be more conservative than mis-classified severity.
See French, et al., 2020 (in review) for details.
Data Acquisition, Materials, and Methods
The study area included sites burned in 2014 and 2015 in the southeastern portion of the Northwest Territories and northern Alberta of Canada. The extent of the study area is all 2014 and 2015 fires within a radius of approximately 300 km from Great Slave Lake. This extent contained 142 fires covering 33,075.5 km2 within the fire perimeters. The study area contains the Boreal Plains, Taiga Plains, and Taiga Shield ecoregions.
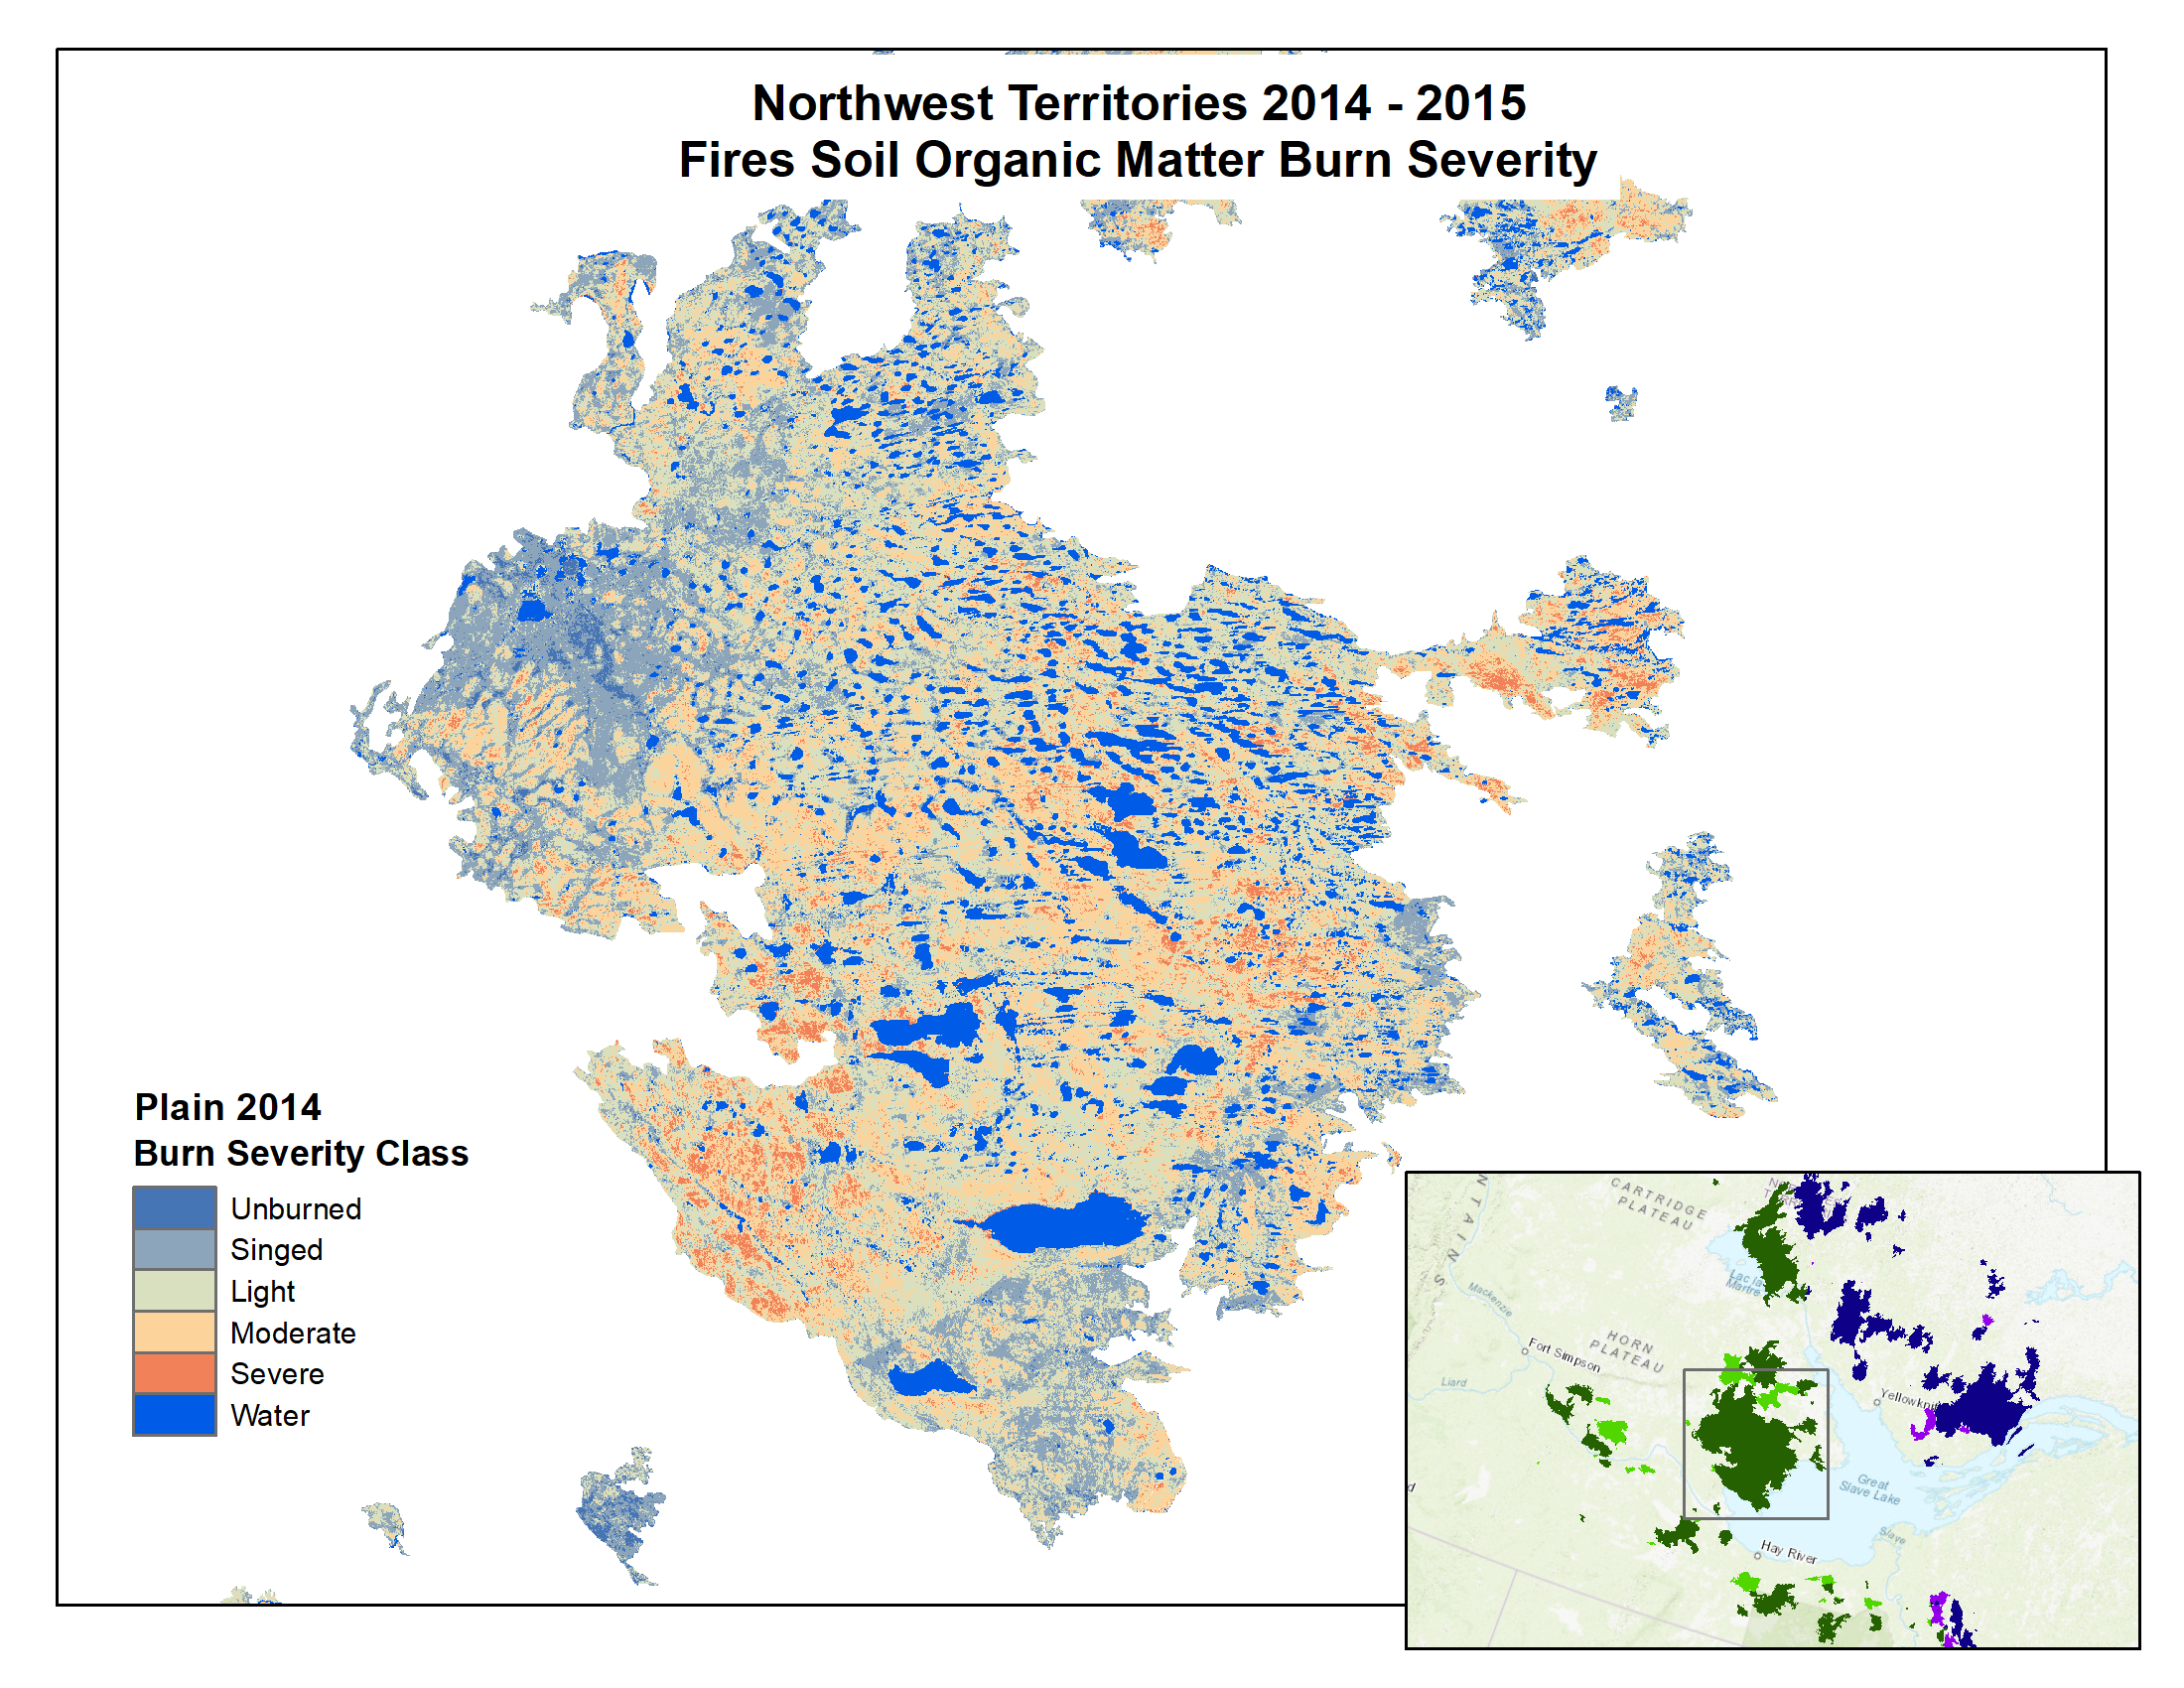
Figure 2. Surface burn severity from 2014 fires in the Taiga Plains. The image in the lower right corner is Figure 1.
Model development
The surface burn severity maps were derived from multiple linear regression models developed to predict BSI obtained from field observations. Tested models included Landsat 8 reflectance and TIR data, burn date, latitude, longitude, slope, elevation, solar-radiation aspect index (Roberts and Cooper 1989), heat load index (McCune and Keon 2002), and 300, 600, 900, and 1200-m topographical elevation indices (Weiss 2001). Due to physiographic differences between the Plains and Shield (soil depth, topography, vegetation), models were created for each ecozone. Final model parameters were differenced NIR and post-fire NBR2 for the Plains, and differenced NIR and differenced NBR2 in the Shield.
Field data
Severity sampling for 2014 and 2015 burns was carried out the year following fire and followed a protocol described in previous studies (Loboda et al., 2013). Sites of at least 1 ha (nominally 100 X 100-m2) were chosen from high resolution imagery for pre-fire ecosystem homogeneity and accessibility. Severity was sampled at six 10 X 10-m plots randomly located along two transects within the 1 ha area within the homogeneous site. Of the 90 sites sampled, 52 were collected in peatlands and 38 in uplands.
The Burn Severity Index (BSI) was the primary metric used to quantify fire severity. The metric was developed from methods of Dyrness and Norum (1983) for quantifying the severity to the organic surface layer in black spruce forests of Alaska and modified for peatlands. The percent area of each severity class within the plot was ocularly assessed for the ground layer to sum to 100% (Viereck et al., 1979).
The BSI and burn depth estimates for each 10 x 10-m plot were averaged to generate one severity estimate to represent the site. Using the GPS coordinates of the six plots, an approximate 1 ha bounding box for each field site was selected for pairing the severity estimate, based on site-level BSI, with remote sensing data. A more comprehensive write-up of the methods can be found in (French et al., 2020 in review).
Landsat data
Landsat 8 Operational Land Imager/Thermal Infrared Sensor (OLI/TIRS) scenes that cover the locations of the field sites were obtained from US Geological Survey (https://earthexplorer.usgs.gov). Only images with less than 40% cloud cover were selected and special care was given to avoid clouds obscuring or shadowing the sites. Selection of Landsat 8 scenes prioritized phenological matching of before and post-fire scenes. The date of the best post-fire scene, which in most instances was in the following calendar year, determined the selection of the pre-fire scene selection. To match seasonal plant phenology pre-fire scenes were selected as close to the anniversary day of the post-fire scene going back up to three years if necessary. When unique combinations of pre- and post-fire scenes were available, they were used and treated as replicates for modeling severity. Within the Shield ecoregion considerable land area consists of barren outcroppings of which do not burn. As the model is designed to be applied to areas known to have burned, it was considered best to mask these barren areas and not include their areal extent in burned area calculations. Water bodies were also masked.
Mean reflectance values of each Landsat band were calculated for both pre- and post-fire images using pixels located within the digitized site polygons. All remote sensing analysis were done using the Canada Albers Equal Area Conic projection.
Pre- and post-fire layers were compiled on a per fire basis to prioritize continuity and phenological matching before mosaicking together for each year and ecoregion. A total of 83 Landsat 8 scenes were used to make the pre- and post-fire mosaics upon which the models were applied.
For additional details, refer to French et al., 2020 (in review).
Data Access
These data are available through the Oak Ridge National Laboratory (ORNL) Distributed Active Archive Center (DAAC).
ABoVE: Burn Severity of Soil Organic Matter, Northwest Territories, Canada, 2014-2015
Contact for Data Center Access Information:
- E-mail: uso@daac.ornl.gov
- Telephone: +1 (865) 241-3952
References
Bourgeau-Chavez, L.L., S. Endres, L. Jenkins, M. Battaglia, E. Serocki, and M. Billmire. 2017. ABoVE: Burn Severity, Fire Progression, and Field Data, NWT, Canada, 2015-2016. ORNL DAAC, Oak Ridge, Tennessee, USA. https://doi.org/10.3334/ORNLDAAC/1548
Dyrness, C.T., and R.A. Norum (1983). The effects of experimental fires on black spruce forest floors in interior Alaska. Canadian Journal of Forest Research, 13(5), 879-893. https://doi.org/10.1139/x83-118
French, N.H.F., J.A. Graham, E. Whitman, and L.L. Bourgeau-Chavez. (in review). Quantifying Severity of the 2014 and 2015 Fires in the Great Slave Lake Area of Canada. Submitted to: International Journal of Wildland Fire.
Loboda, T.V., N.H. French, C. Hight-Harf, L. Jenkins, and M.E. Miller. (2013). Mapping fire extent and burn severity in Alaskan tussock tundra: An analysis of the spectral response of tundra vegetation to wildland fire. Remote Sensing of Environment, 134, 194-209. https://doi.org/10.1016/j.rse.2013.03.003
McCune, B., and D. Keon. (2002). Equations for potential annual direct incident radiation and heat load. Journal of vegetation science, 13(4), 603-606. https://doi.org/10.1111/j.1654-1103.2002.tb02087.x
Roberts, D.W., and S.V. Cooper. (1989). Concepts and techniques of vegetation mapping. General Technical Report INT-US Department of Agriculture, Forest Service, Intermountain Research Station (USA).
Viereck, L.A. (1979). Characteristics of treeline plant communities in Alaska. Ecography, 2(4), 228-238. https://doi.org/10.1111/j.1600-0587.1979.tb01294.x
Weiss, A. (2001, July). Topographic position and landforms analysis. In Poster presentation, ESRI user conference, San Diego, CA (Vol. 200).