Documentation Revision Date: 2021-03-18
Dataset Version: 1
Summary
There are 15 shapefiles bundles in compressed (*.zip) format provided in this dataset.
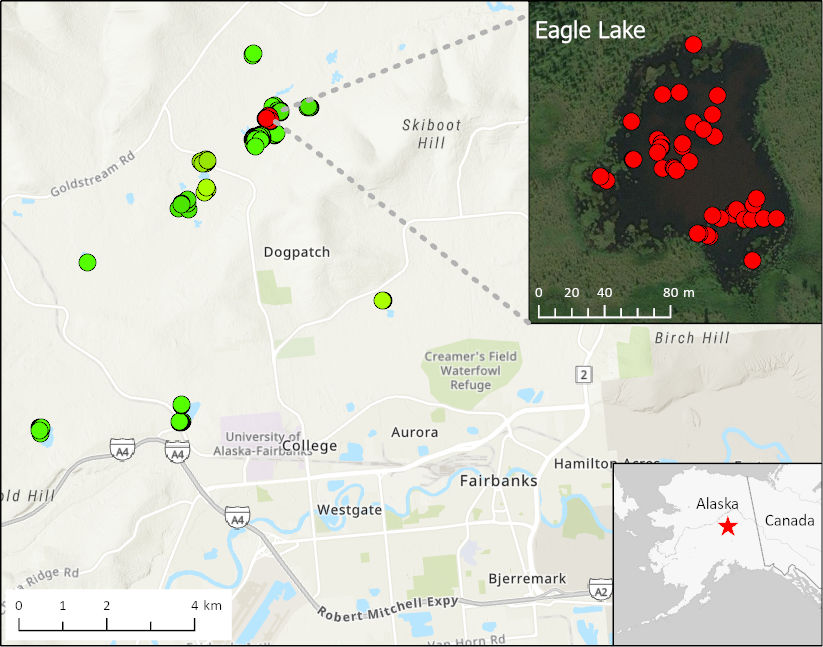
Figure 1. Location of 15 lakes surveyed for methane ebullition hotspots (green points) north of Fairbanks, AK, on October 8, 2014. Inset shows detail of Eagle Lake with locations of 43 hotspots (red points) detected by openings in lake ice.
Citation
Anthony, K.W., P. Hanke, and P. Lindgren. 2021. ABoVE: Methane Ebullition Hotspots in Frozen Lakes near Fairbanks, Alaska, Oct 2014. ORNL DAAC, Oak Ridge, Tennessee, USA. https://doi.org/10.3334/ORNLDAAC/1861
Table of Contents
- Dataset Overview
- Data Characteristics
- Application and Derivation
- Quality Assessment
- Data Acquisition, Materials, and Methods
- Data Access
- References
Dataset Overview
This dataset includes maps of the locations and number of methane ebullition hotspots in 15 frozen lakes in the southern portion of the Goldstream Valley and the surrounding landscape just north of Fairbanks, Alaska, USA. Hotspots were identified from early winter high resolution aerial photographs acquired three days after lake-ice formation in October 2014. Hotspot ebullition seeps are defined as point-sources of high ebullition that release methane from lake sediments year-round. High rates of bubbling impede ice formation. In early winter, bubbling leads to dark, round open holes in lake ice which were visible in the aerial photos. This project investigated the role of theromkarst lakes in thawing of permafrost and mobilization of organic carbon in frozen soils.
Project: Arctic-Boreal Vulnerability Experiment
The Arctic-Boreal Vulnerability Experiment (ABoVE) is a NASA Terrestrial Ecology Program field campaign being conducted in Alaska and western Canada, for 8 to 10 years, starting in 2015. Research for ABoVE links field-based, process-level studies with geospatial data products derived from airborne and satellite sensors, providing a foundation for improving the analysis, and modeling capabilities needed to understand and predict ecosystem responses to, and societal implications of, climate change in the Arctic and Boreal regions.
Related Publication
Walter Anthony, K.M., P. Lindgren, P. Hanke, M. Engram, P. Anthony, R. Daanen, A.C. Bondurant, A.K. Liljedahl, J. Lenz, G. Grosse, B.M. Jones, L. Brosius, S.R. James, B.J. Minsley, N.J. Pastick, J. Munk, J. Chanton, C.E. Miller, and F.J. Meyer. 2020. Decadal-scale hotspot methane ebullition within lakes following abrupt permafrost thaw. Environmental Research Letters 16 035010. http://doi.org/10.1088/1748-9326/abc848
Related Datasets:
Anthony, K.W., P. Lindgren, P. Hanke, J. Cherry, and M.J. Engram. 2020. ABoVE: Aerial Photographs of Frozen Lakes near Fairbanks, Alaska, October 2014. ORNL DAAC, Oak Ridge, Tennessee, USA. https://doi.org/10.3334/ORNLDAAC/1845
Anthony, K.W. 2021. Historical lake shorelines near Fairbanks Alaska, 1949-2009. ORNL DAAC, Oak Ridge, Tennessee, USA. https://doi.org/10.3334/ORNLDAAC/1859
Brown, D.R.N., T.J. Brinkman, and D. Verbyla. 2019. ABoVE: River Ice Breakup and Freeze-up Stages, Yukon River Basin, Alaska, 1972-2016. ORNL DAAC, Oak Ridge, Tennessee, USA. https://doi.org/10.3334/ORNLDAAC/1697
Elder, C., P. Hanke, K.W. Anthony, D.R. Thompson, C.E. Miller, and A.K. Thorpe. 2020. ABoVE: Methane Flux across Two Thermokarst Lake Ecosystems, Interior Alaska, 2018. ORNL DAAC, Oak Ridge, Tennessee, USA. https://doi.org/10.3334/ORNLDAAC/1778
User Note: Users can overlay the locations of 21 orthophotograph lakes (dataset 1845) on the shapefiles in the current dataset (1859) to create a cross-reference map. The relationships among three Anthony et al. related datasets are as follows:
- Anthony et al. (2020) (dataset 1845) - high-resolution orthophotographs of 21 lakes in the Goldstream Valley
- Anthony et al. (2021) (dataset 1859) - historical and recent lake locations, shorelines, and areas of lakes and ponds across Goldstream Valley
- Anthony et al. (2021) (current dataset - 1861) - digitized methane hotspot locations in 15 lakes in the Goldstream Valley derived from 15 of the 21 photographed lakes provided in dataset 1845
Acknowledgments
This work was supported by NASA's ABoVE Program (grants NNX15AU49A and NNN12AA01C), the National Science Foundation's Arctic System Science Program (grant ARCSS-1500931), and Office of Polar Programs (grant OPP-1806213).
Data Characteristics
Spatial Coverage: Goldstream Valley northwest of Fairbanks, AK, USA
ABoVE Reference Locations
Domain: Core
State/Territory: Alaska
Grid cells (3): Ah001v000, Bh006v005, Ch040v032
Spatial Resolution: 1–3 m
Temporal Coverage: 2014-10-08
Temporal Resolution: One-time estimate
Site Boundaries: Latitude and longitude are given in decimal degrees.
| Site | Westernmost Longitude | Easternmost Longitude | Northernmost Latitude | Southernmost Latitude |
|---|---|---|---|---|
| Goldstream Valley, AK | -147.939 | -147.769 | 65.9367 | 65.863 |
Data File Information
There are 15 shapefiles bundles in compressed (*.zip) format provided in this dataset. The shapefiles provide methane hotspot point locations across the study area. Files are named Hotspots_<lake_name>.tif, and lake names are provided in Table 1.
Table 1. Filenames and content. Latitude and longitude coordinates are given in decimal degrees, and root mean squared error (RMSE) and minimum error distance (MED) are in meters.
| File Name | Lake Name | Latitude | Longitude | Number of Hotspots | RMSE | MED |
|---|---|---|---|---|---|---|
| Hotspots_BigTrail.zip | BigTrail Lake | 64.919 | -147.821 | 198 | 3.02 | 3.03 |
| Hotspots_Cranberry.zip | Cranberry Lake | 64.937 | -147.82 | 17 | 1.95 | 1.96 |
| Hotspots_Deuce.zip | Deuce Lake | 64.864 | -147.94 | 31 | 2.16 | |
| Hotspots_Doughnut.zip | Doughnut Lake | 64.898 | -147.909 | 1 | 1.95 | 1.96 |
| Hotspots_Eagle.zip | Eagle Lake | 64.923 | -147.816 | 43 | 2.17 | 2.18 |
| Hotspots_GENL1.zip | Goldstream East New Lake 1 | 64.92 | -147.813 | 33 | 1.78 | |
| Hotspots_GENL2.zip | Goldstream East New Lake 2 | 64.925 | -147.811 | 31 | 2.85 | |
| Hotspots_GENL3.zip | Goldstream East New Lake 3 | 64.925 | -147.796 | 7 | 1.65 | 1.66 |
| Hotspots_Goldstream.zip | Goldstream Lake | 64.916 | -147.85 | 54 | 1.95 | 1.06 |
| Hotspots_GWNL1.zip | Goldstream West New Lake 1 Lake | 64.91 | -147.849 | 4 | 2.3 | |
| Hotspots_Octopus.zip | Octopus Lake | 64.908 | -147.86 | 40 | 1.78 | 1.8 |
| Hotspots_Reindeer.zip | Reindeer Lake | 64.884 | -147.771 | 3 | 1.22 | |
| Hotspots_Smith.zip | Smith Lake | 64.865 | -147.864 | 3 | 2.14 | |
| Hotspots_Snoopy.zip | Snoopy Lake | 64.925 | -147.812 | 11 | 1.6 | |
| Hotspots_Stephens.zip | Stephens Lake | 64.863 | -147.871 | 19 | 2.14 | 2.16 |
Data File Details
- All files use the CRS "Alaska Albers Equal Area projection" (EPSG:3338).
- The shapefiles have only one attribute; Hotspot_Co, the number of hotspots detected at each point.
- For some lakes, there are fewer points in the shapefile than the total number of hotspots because some points have more than 1 hotspot (defined by ice holes) clustered at the same location.
- The spatial accuracy of orthorectification is provided as root mean squared error (RMSE) in meters.
- The spatial accuracy of hotspot locations, when available, is provided as minimum error distance (MED) in meters.
Application and Derivation
This analysis was part of a project that investigated the role of theromkarst lakes in thawing of permafrost and mobilization of organic carbon in frozen soils. Aerial photography was used to measure changes in lake areas and patterns in the formation of lake ice. Holes in lake ice can indicate the location of hotspot seeps associated with the releases of methane from thawing permafrost (Walter Anthony et al. 2021).
Quality Assessment
Hotspots were identified and mapped by analysis of aerial photographs. The aerial photographs were georeferenced and rectified using ground control points. LIDAR elevation data from the U.S. Geological Survey (2018) and the 2017 Alaska Division of Geological & Geophysical Surveys (OCM Partners, 2021) were used to validate ground control point placement and for elevation input to the Agisoft orthorectification software. Aerial photographs were orthorectified in Alaska Albers Equal Area projection with a resolution of 9.65 cm/pixel. The RMSE of orthorectifications are provided in Table 1.
Candidate hotspot locations were identified by dark spots that contrasted against the white background of the lake ice. Dark spots created by flowing water inlets, vegetation, and other solid objects (e.g., tree stumps, muskrat mounds) were identified by visual inspection of the photographs and field inspection. These dark spots were eliminated from analysis. In Doughnut Lake, strong ebullition in the stable lake area was associated with a sub-talik groundwater system rather than methane ebullition. Due to their different origin, these Doughnut Lake seeps were excluded from this analysis.
For a sample of lakes, hotspots were located in the field, and their locations were recorded using a differential global positioning system (DGPS). Discrepancies in hotpot locations between the DGPS and from aerial photographs were summarized for each lake using MED in meters (Table 1). Seep creep, movement of methane seep overtime was also a source of error incorporated into MED. The RMSE owing to seep creep was estimated as 0.24 m per year based on 34 observations in 2011, 2012, 2013, and 2016.
Data Acquisition, Materials, and Methods
Study Area
The study area was 214 km2 in size and encompassed thermokarst lakes in the discontinuous permafrost region northwest of Fairbanks, AK, especially the southern region of the Goldstream Valley (Fig. 2). This landscape is characterized by yedoma permafrost and ice wedges covering the valley bottom and north-facing slopes, thermokarst lakes at toe-slopes, and the valley floor, large differences in microclimates between high- and low-elevation areas, and an abundance of wetlands despite relatively low precipitation.
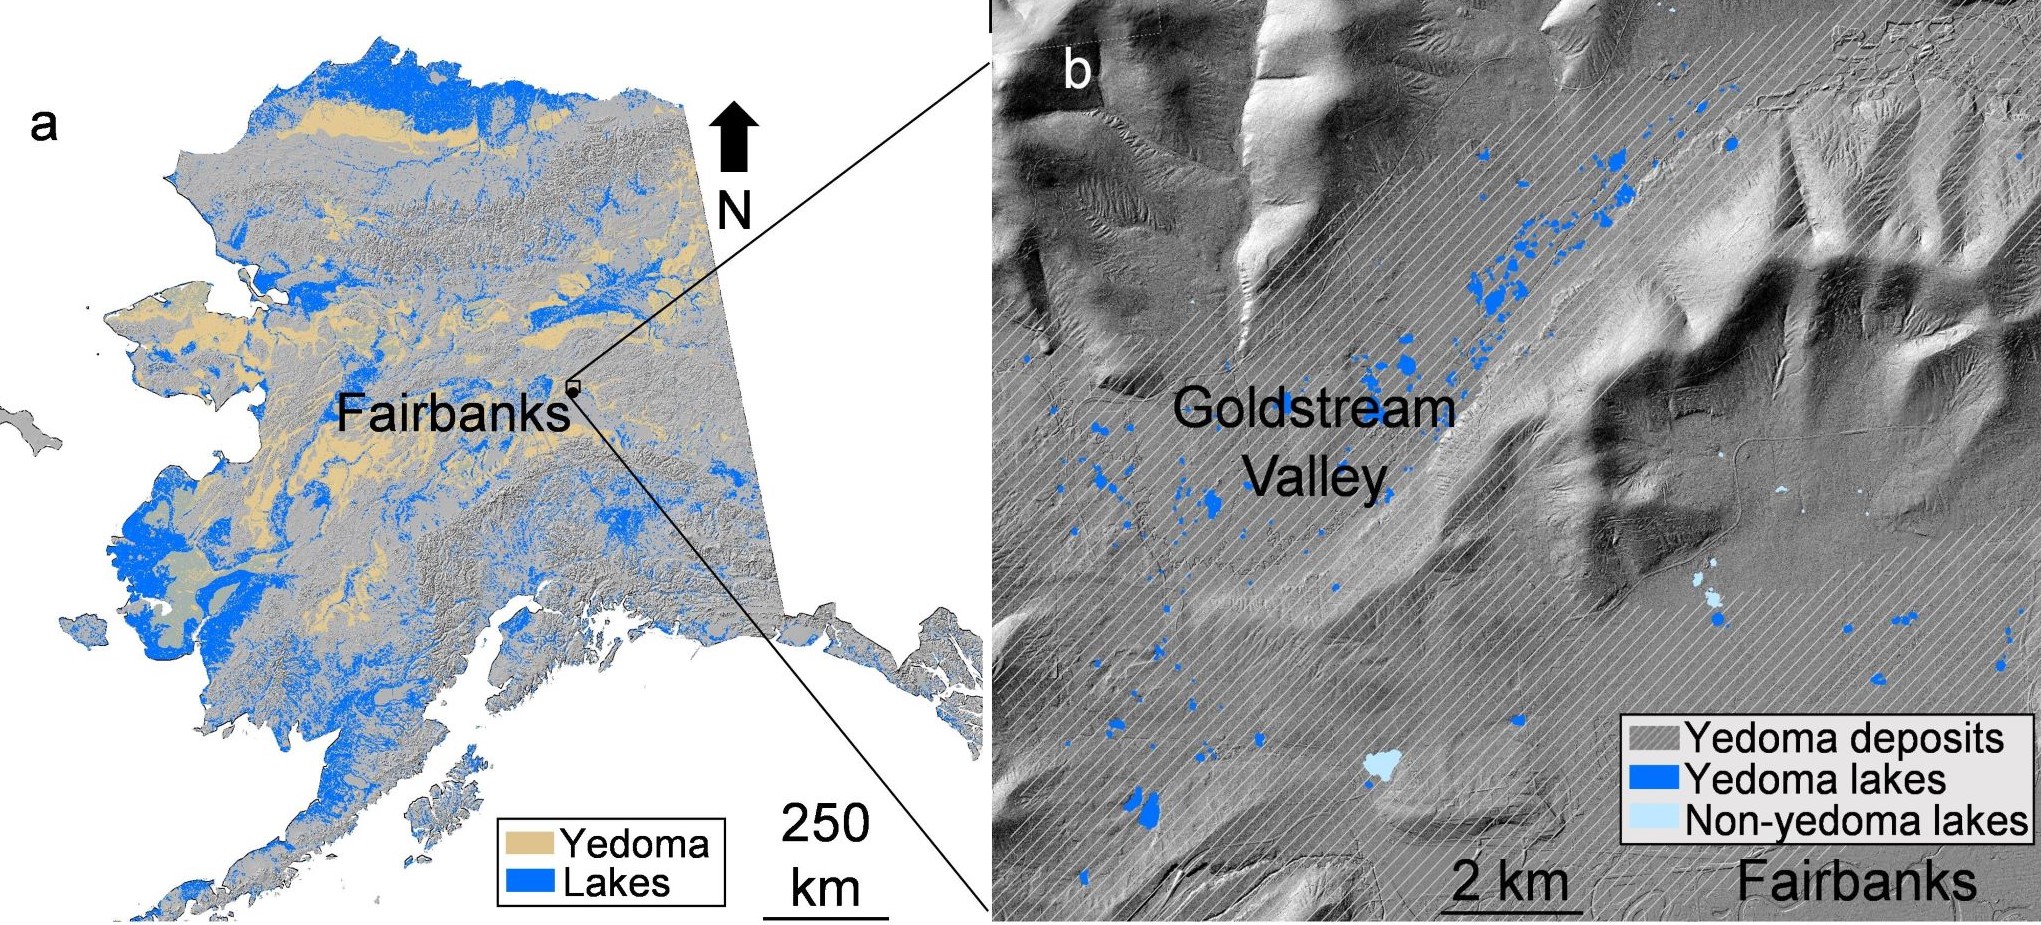
Figure 2. Location of the study area northwest of Fairbanks, Alaska, USA. The map shows (a) yedoma permafrost distribution and (b) yedoma lakes and terrain of the Goldstream Valley. Data sources include Strauss et al. (2016), Alaska LiDAR Dataset (USGS, 2018), Elevation Datasets of Alaska (DGGS Staff, 2013), and Walter Anthony et al. (2020).
Data Sources
High-resolution oblique aerial photographs of 15 lakes in the Fairbanks region were acquired on October 8, 2014, three days after lake-ice formation (Anthony et al. 2020). The photographs, taken at 541-641 m altitude with a resolution of 9 to 11 cm, consisted of three visible bands: red, green, and blue (RGB). These images were orthorectified with Agisoft Photoscan Professional (version #1.3.4.5067) using 2007 Digital Orthophoto Quarter Quads (EROS Center, 2017) provided by the U.S. Geologic Survey as reference data for the selection of ground control points. Orthorectification errors were calculated within the Agisoft software. They varied as a function of image observation geometry, image contrast, and lighting conditions and are documented on a lake by lake basis (Table 1).
In orthorectified aerial photographs, open-hole hotspot ebullition seeps appeared as dark, round spots that strongly contrasted against the background of white, snow-covered lake ice (Figure 2). Every dark spot in each orthorectified aerial image was digitized to identify candidate hotspot locations. Dark spots that were not ebullition hotspots based on field work or visual interpretation (e.g., emergent or floating plants, tree stumps, muskrat mounds, flowing water at creek inlets, and other lake-ice-formation blemishes) were excluded from subsequent analyses.
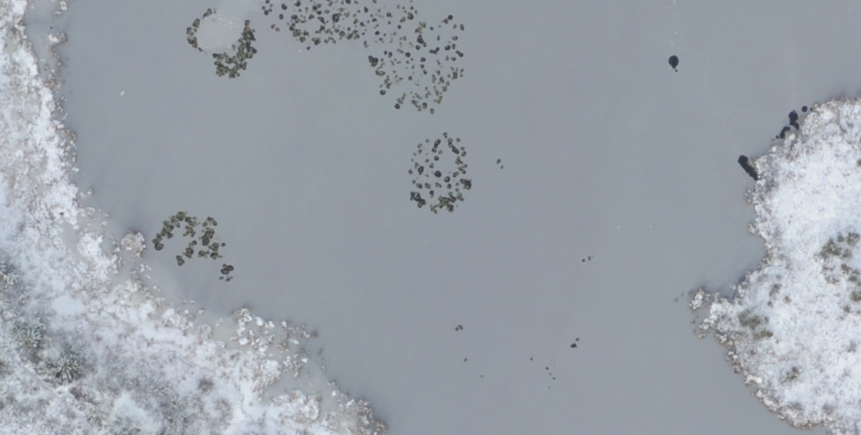
Figure 3. Aerial photograph of a frozen lake with methane ebullition hotspots. Hotspots appear as dark round spots contrasting with white snow-covered lake ice. The lake shore is visible on the left and right portion of this image. Source: AerialPhoto_Doughnut.tif in Anthony et al. (2020).
Image Processing
Classification criteria to distinguish actual hotspots from other dark objects were developed by analyzing the brightness of pixel values from hotspots identified in the field. For a sample of lakes, hotspots were located in the field, and their locations were recorded using a DGPS. Dark spots in close proximity to the DGPS-mapped hotspots were examined in the aerial photographs. They consisted of three or more pixels, and the mean pixel value and range of values for the red band of the images were recorded. The red band was used because this wavelength is strongly absorbed by liquid water. The range and mean of pixel brightness for the DGPS-mapped hotspots were used to create threshold values of red-band brightness for identifying hotspots in lakes with field data.
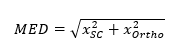
The locations of dark spots on aerial photographs did not perfectly align with DGPS positions owing to errors of the instrument, image orthorectification, and seep creep. Seep creep, the estimated movement of an individual seep from year to year (0.24 m RMSE of 34 observations), was determined using multiple-year DGPS field data (2011, 2012, 2013, and 2016) collected on Goldstream Lake. Any digitized dark spot within a MED from a field-detected open-hole hotspot was a candidate for an open-hole hotspot in the imagery. MED was based on the variance due to seep creep (x2SC) and orthorectification errors (x2ortho) as provided by the following equation.
In estimating pixel value thresholds, a range of distance values (search radii) was examined, from MED to 2*MED, in 0.1*MED increments, which likewise altered the mean and range of pixel values. For each search radius, the maximum pixel value was selected as the threshold. Hotspots were identified by pixels with brightness values less than the lake-specific threshold. These thresholds were applied to the entire lake, and the value resulting in a classification that best matched the DGPS-mapped hotspots was adopted as the best threshold value for that lake. The average of the best threshold values for the lakes having field data was applied to classify hotspots on the remaining lakes.
Small hotspots on some lakes, such as Doughnut and Deuce, were not detected by the threshold classification. These classification errors were attributed to image resolution and natural variation. Hotspot number was underestimated because a) the larger circumference-to-area ratio of small hotspots affected the radiometric value of the hotspot (i.e., fringe effects raise the feature’s mean pixel value), and b) some hotspots may have been temporarily covered with thin ice at the time of aerial photo acquisition because seep bubbling rates vary from day to day. Despite being conservative, this approach revealed spatial patterns of hotspot distributions that matched field-based maps. See Walter Anthony et al. (2021) for additional information.
Data Access
These data are available through the Oak Ridge National Laboratory (ORNL) Distributed Active Archive Center (DAAC).
ABoVE: Methane Ebullition Hotspots in Frozen Lakes near Fairbanks, Alaska, Oct 2014
Contact for Data Center Access Information:
- E-mail: uso@daac.ornl.gov
- Telephone: +1 (865) 241-3952
References
Anthony, K.W., P. Lindgren, P. Hanke, J. Cherry, and M.J. Engram. 2020. ABoVE: Aerial Photographs of Frozen Lakes near Fairbanks, Alaska, October 2014. ORNL DAAC, Oak Ridge, Tennessee, USA. https://doi.org/10.3334/ORNLDAAC/1845
EROS (Earth Resources Observation And Science) Center. 2017. Digital Orthophoto Quadrangle (DOQ). U.S. Geological Survey. https://doi.org/10.5066/F7125QVD
DGGS Staff. 2013. Elevation Datasets of Alaska. Alaska Division of Geological & Geophysical Surveys Digital Data Series 4. https://doi.org/10.14509/25239
OCM Partners. 2021: 2017 USGS 3DEP Lidar: Fairbanks, AK (QL1 & QL2) from 2010-06-15 to 2010-08-15. NOAA National Centers for Environmental Information. https://www.fisheries.noaa.gov/inport/item/55358
Strauss, J., S. Laboor, A.N. Fedorov, D. Fortier, D. Froese, M. Fuchs, G. Grosse, F. Günther, J.W. Harden, G. Hugelius, M.Z. Kanevskiy, A.L. Kholodov, V.V. Kunitsky, G. Kraev, L. Lapointe-Elmrabti, A.V. Lozhkin, E. Rivkina, J. Robinson, L. Schirrmeister, D. Shmelev, Y. Shur, C. Siegert, V. Spektor, M. Ulrich, S.L. Vartanyan, A. Veremeeva, K.M. Walter Anthony, and S.A. Zimov. 2016. Database of Ice-Rich Yedoma Permafrost (IRYP). PANGAEA. https://doi.org/10.1594/PANGAEA.861733
USGS (U.S. Geological Survey.) 2018. USGS Lidar Point Cloud AK FairbanksNSB QL1 2017 FB17 4205 LAS 2018: U.S. Geological Survey. https://www.sciencebase.gov/catalog/item/5be30ff4e4b0b3fc5cf70b38
Walter Anthony, K.M., P. Lindgren, P. Hanke, M. Engram, P. Anthony, R. Daanen, A.C. Bondurant, A.K. Liljedahl, J. Lenz, G. Grosse, B.M. Jones, L. Brosius, S.R. James, B.J. Minsley, N.J. Pastick, J. Munk, J. Chanton, C.E. Miller, and F.J. Meyer. 2020. Decadal-scale hotspot methane ebullition within lakes following abrupt permafrost thaw. Environmental Research Letters 16 035010. http://doi.org/10.1088/1748-9326/abc848