Documentation Revision Date: 2018-02-19
Data Set Version: 1
Summary
The data provided are the best estimates from the described modeling and Monte Carlo approach for each 30-m pixel in the Landsat mosaic at the 50th percentile, and also at the 2.5 and 97.5 percentiles for each data type (plant AGB, shrub AGB, and shrub dominance) which together encompass 95% of predictions.
The published field measurements of total plant and shrub AGB used in the modeling were collected between July 1998 and August 2008. The mean and standard error (SE) of plant and shrub AGB were also acquired or computed for the data at each site. The regional Landsat NDVI mosaic was derived from 1,721 summer scenes acquired between 2007 and 2016. Spectral reflectance information was extracted from these 'peak greenness' scenes on a per pixel basis. Empirical AGB-NDVI relationships were developed for the field sites and the relationships were applied to the mosaic. The Monte Carlo uncertainty analysis involved generating 1,000 regional maps of each ecosystem data type, where each map was produced by randomly permuting the underlying field and remote sensing datasets by their uncertainty due to sampling and sensor calibration errors. The data with this dataset are the 50th percentile (best estimates), the 2.5, and 97.5 percentiles of the 1,000 permutations.
There are nine data files of mapped AGB and shrub dominance with this dataset in GeoTIFF (.tif) format and one shapefile (.shp) provided in compressed (.zip) format which provides the study locations. The study locations are also provided as a companion file in .kmz format for viewing in Google Earth. A companion file of the published field measurements of total plant and shrub AGB used in the modeling is also available as a .csv file.
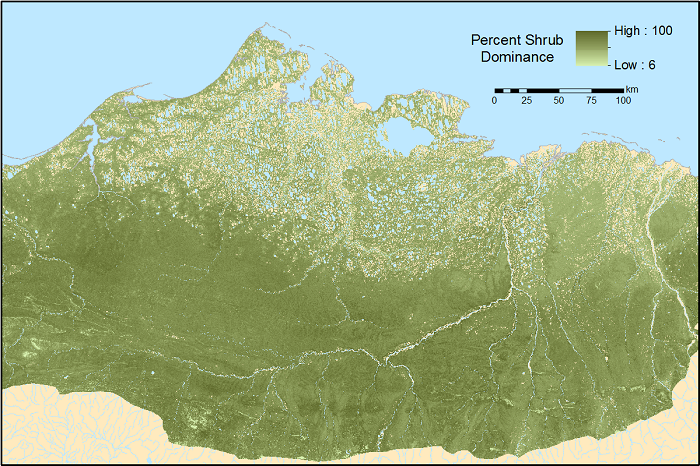
Figure 1. The best estimate (50th percentile) of 30-m shrub dominance (shrub/plant AGB) for non-water portions of the Beaufort Coastal Plain and Brooks Foothills ecoregions of the North Slope of Alaska.
Citation
Berner, L.T., P. Jantz, K.D. Tape, and S.J. Goetz. 2018. ABoVE: Gridded 30-m Aboveground Biomass, Shrub Dominance, North Slope, AK, 2007-2016. ORNL DAAC, Oak Ridge, Tennessee, USA. https://doi.org/10.3334/ORNLDAAC/1565
Table of Contents
- Data Set Overview
- Data Characteristics
- Application and Derivation
- Quality Assessment
- Data Acquisition, Materials, and Methods
- Data Access
- References
Data Set Overview
This dataset includes 30-m gridded estimates of total plant aboveground biomass (AGB), the shrub AGB, and the shrub dominance (shrub/plant AGB) for non-water portions of the Beaufort Coastal Plain and Brooks Foothills ecoregions of the North Slope of Alaska. The estimates were derived by linking biomass harvests from 28 published field site datasets with NDVI from a regional Landsat mosaic derived from Landsat 5 and 7 satellite imagery. The data cover the period 2007-06-01 to 2016-08-31.
The data provided are the best estimates from the described modeling and Monte Carlo approach for each 30-m pixel in the Landsat mosaic at the 50th percentile, and also at the 2.5 and 97.5 percentiles for each data type (plant AGB, shrub AGB, and shrub dominance) which together encompass 95% of predictions.
The published field measurements of total plant and shrub AGB used in the modeling were collected between July1998 and August 2008. The mean and standard error (SE) of plant and shrub AGB were also acquired or computed for the data at each site. The regional Landsat NDVI mosaic was derived from 1,721 summer scenes acquired between 2007 and 2016. Spectral reflectance information was extracted from these 'peak greenness' scenes on a per pixel basis. Empirical AGB-NDVI relationships were developed for the field sites and the relationships were applied to the mosaic. The Monte Carlo uncertainty analysis involved generating 1,000 regional maps of each ecosystem data type, where each map was produced by randomly permuting the underlying field and remote sensing datasets by their uncertainty due to sampling and sensor calibration errors. The data with this dataset are the 50th percentile (best estimates), the 2.5, and 97.5 percentiles of the 1,000 permutations.
Project: Arctic-Boreal Vulnerability Experiment
The Arctic-Boreal Vulnerability Experiment (ABoVE) is a NASA Terrestrial Ecology Program field campaign based in Alaska and western Canada between 2016 and 2021. Research for ABoVE links field-based, process-level studies with geospatial data products derived from airborne and satellite sensors, providing a foundation for improving the analysis and modeling capabilities needed to understand and predict ecosystem responses and societal implications.
Related Publication:
Logan T. Berner, Patrick Jantz, Ken D. Tape, and Scott J. Goetz. 2018. Tundra plant aboveground biomass and shrub dominance mapped across the North Slope of Alaska. Environmental Research Letters. https://doi.org/10.1088/1748-9326/aaaa9a
Acknowledgements:
This study was funded by NASA's Arctic-Boreal Vulnerability Experiment (Grant number: NNX17AE44G).
Data Characteristics
Spatial Coverage: The study area encompassed the Beafort Coastal Plain and Brooks Foothills ecoregions of the North Slope, though published field data from the Seward Peninsula and the North West Territories were also used in the analysis.
ABoVE Reference Locations:
Domain: Core ABoVE
State/territory: Alaska
Grid cell(s): Ahh1Av0Bh0Bv0
Spatial Resolution: 30-m
Temporal Coverage: 2007-06-01 to 2016-08-31
Temporal Resolution: One time estimates
Study Areas (All latitude and longitude given in decimal degrees)
| Site | Westernmost Longitude | Easternmost Longitude | Northernmost Latitude | Southernmost Latitude |
|---|---|---|---|---|
|
Regions of the Beaufort Coastal Plain and Brooks Foothills, North slope, Alaska and the NWT, Canada |
-168.576 | -111.551072 | 76.226 | 64.7265 |
Table 1. File names and descriptions
There are nine data files of mapped AGB and shrub dominance with this dataset in GeoTIFF (.tif) format and one shapefile (.shp) provided in compressed (.zip) format which provides the study locations. The study locations are also provided as a companion file in .kmz format for viewing in Google Earth. A companion file of the published field measurements of total plant and shrub AGB used in the modeling is also available as a .csv file.
The data are best-estimates of plant AGB, shrub AGB, and shrub dominance for each pixel in the regional Landsat mosaic, for the North Slope study areas. The best-estimates were the 50th percentile of the 1,000 permutations for each pixel. Data are also included for the 2.5 and 97.5 percentiles of the 1,000 permutations.
| Filename | Description |
|---|---|
| nslope_plant_agb_p50.tif | Plant AGB (50th percentile) |
| nslope_plant_agb_p2_5.tif | Plant AGB (2.5 percentile) |
| nslope_plant_agb_p97_5.tif | Plant AGB (97.5 percentile) |
| nslope_shrub_agb_p50.tif | Shrub AGB (50th percentile) |
| nslope_shrub_agb_p2_5.tif | Shrub AGB (2.5 percentile) |
| nslope_shrub_agb_p97_5.tif | Shrub AGB (97.5 percentile) |
| nslope_shrub_dominance_pcnt_of_agb_p50.tif | Shrub dominance (50th percentile) reported as a percent |
| nslope_shrub_dominance_pcnt_of_agb_p2_5.tif | Shrub dominance (2.5 percentile) reported as a percent |
| nslope_shrub_dominance_pcnt_of_agb_p97_5.tif | Shrub dominance (97.5 percentile) reported as a percent |
| tundra_biomass_harvest_sites.zip | When unzipped, this file provides a shapefile (.shp) of the study locations. The data are also provided as a companion file in .kmz format for viewing in Google Earth |
Table 2. Attributes of the GeoTIFF files
| Filename | Units | Minimum value | Maximum value | Mean value | Std dev Value | No data value |
|---|---|---|---|---|---|---|
| nslope_plant_agb_p50.tif | gm2 | 26 | 3325 | 734.3 | 283.4 | 65535 |
| nslope_plant_agb_p2_5.tif | gm2 | 9 | 2297 | 582.7 | 248.2 | 65535 |
| nslope_plant_agb_p97_5.tif | gm2 | 61 | 5031 | 908.1 | 344.8 | 65535 |
| nslope_shrub_agb_p50.tif | gm2 | 1 | 3984 | 346.4 | 219.3 | 65535 |
| nslope_shrub_agb_p2_5.tif | gm2 | 0 | 2475 | 204.9 | 161.4 | 65535 |
| nslope_shrub_agb_p97_5.tif | gm2 | 6 | 7979 | 504.7 | 294.6 | 65535 |
| nslope_shrub_dominance_pcnt_of_agb_p50.tif | % | 5 | 100 | 43.3 | 11.2 | 255 |
| nslope_shrub_dominance_pcnt_of_agb_p2_5.tif | % | 0 | 97 | 27.7 | 12.2 | 255 |
| nslope_shrub_dominance_pcnt_of_agb_p97_5.tif | % | 14 | 100 | 53.6 | 9.8 | 255 |
Attributes of the Shapefile
| Attributes | Description |
|---|---|
| point | A reference to the sites |
| id | Numbers 1-28 referring to the sites |
| site | Site name |
| region | Name of region where site is located |
| latitude | Latitude of site |
| longitude | Longitude of site |
| reference | Reference for the site location information |
Table 3. Companion files with this dataset
| Filename | Description |
|---|---|
| Maps_AGB_North_Slope_AK_FieldSites.csv | This file provides information on the field sites as well as the mean (standard error) plant AGB, shrub AGB, and Lansdsat NDVI at each site |
| tundra_biomass_harvest_sites.kmz | A .kmz file which provides the locations of the field sites for viewing in Google Earth |
| Maps_AGB_North_Slope_AK.pdf | A pdf of this guide document |
Application and Derivation
These data could be useful to climate change and vegetation studies in the Alaskan Arctic.
Quality Assessment
The dataset includes uncertainty estimates derived from a Monte Carlo analysis and was also evaluated through comparisons with (1) field measurements of shrub canopy height, (2) independent remote sensing estimates of shrub canopy cover, and (3) high-resolution satellite and aerial imagery. The Monte Carlo analysis involved developing 1,000 estimates of plant and shrub AGB for each 30-m resolution pixel in the study area. This analysis accounted for spatial variation in biomass harvest and Landsat NDVI measurements at each field site, as well as uncertainty in Landsat sensor calibration. The dataset includes our best estimate of each plant attribute (i.e., pixel-wise median of the 1,000 realizations). The dataset also includes 2.5 and 97.5 percentiles of each attribute from the 1,000 realizations, which facilitates creation of 95% confidence intervals for each pixel.
Data Acquisition, Materials, and Methods
Site description
The study area encompassed the Beafort Coastal Plain and Brooks Foothills ecoregions of the North Slope, though published field data from the Seward Peninsula and the North West Territories were also used in the analysis. The Beaufort Coastal Plain supports extensive lowland tundra plant communities often dominated by sedges and small shrubs. The warmer Brooks Foothills supports tussock tundra, shrub tundra, and mixed tundra communities. Field measurements were derived from clip harvests at tundra sites on the North Slope (n=14), the Seward Peninsula (n=7), and in northern Canada (n=3).
Methods
The uncertainty estimates provided in this dataset were derived from a Monte Carlo analysis and were evaluated through comparisons with (1) field measurements of shrub canopy height, (2) independent remote sensing estimates of shrub canopy cover, and (3) high-resolution satellite and aerial imagery.
Plant biomass data
Published field measurements of plant and shrub AGB collected between July 1998 and August 2008 were used to develop empirical relationships between AGB and Landsat NDVI (Copass et al., 2007a, 2007b; Raynolds et al., 2008, 2002; Vankoughnet and Grogan, 2016; Walker et al., 2012, 2003). These field measurements were derived from clip harvests at tundra sites on the North Slope (n=14), the Seward Peninsula (n=7), and in northern Canada (n=3) using similar sampling and measurement methods. Biomass was harvested during the period of peak AGB (mid-June to mid-August).
The mean and standard error (SE) of plant and shrub AGB were acquired or computed for each site.
- Plant AGB included total live and standing dead AGB of all PFTs (shrubs, graminoids, forbs, mosses, and lichens)
- Shrub AGB included both deciduous and evergreen species with woody stems, irrespective of plant height.
The collection of field sites was supplemented with four nonvegetated sites that were situated in mountainous areas around the region. These sites were identified using high resolution satellite, aerial, and oblique imagery available on Google Earth. Together, these data provided estimates of plant and shrub AGB at 28 sites. These sites did not constitute a random or systematic sample of the study area, but encompassed a broad range of tundra plant communities.
The companion file Maps_AGB_North_Slope_AK_FieldSites.csv provides the site information, the mean and standard error (SE) of plant and shrub AGB used in this study. The companion file tundra_biomass_harvest_sites.kmz provides the site locations in .kmz format for viewing in Google Earth.
Landsat mosaic
Landsat 5 and 7 surface reflectance datasets were used to create a seamless multi-band composite mosaic of the study area and to determine NDVI at each of the 28 locations of plant and shrub AGB. The following process was used to create the mosaic:
(1) All available scenes from Landsat 5 (n=361) and Landsat 7 (n=1,360) were acquired over the region from late June through late August between 2007 and 2016. Residual water, snow, clouds, and cloud shadows pixels were masked.
(2) After extensive masking, the NDVI for each scene was computed.
(3) The NDVI from Landsat 5 was bias corrected to match Landsat 7.
(4) The 80th percentile NDVI values for each pixel from all available scenes was computed.
(5) The scene was identified that had NDVI closest to the 80th percentile.
(6) A multi-band Landsat composite mosaic was created of the study area by extracting spectral reflectance information from these 'peak greenness' scenes on a per pixel basis.
Plant biomass mapping and uncertainty assessment
Plant AGB, shrub AGB, and shrub dominance were modeled over the study area by first developing empirical AGB-NDVI relationships at the field sites and then applying these relationships to regional Landsat NDVI mosaics. Uncertainty in these predictions was tracked using a Monte Carlo approach (Harmon et al., 2007; Berner et al., 2017):
- Uncertainty in the AGB-NDVI models resulting from sampling error in both variables within each site.
- Uncertainty in regional NDVI given uncertainty in sensor calibration (Markham and Helder, 2012).
The approach involved repeatedly (n=1,000) permuting AGB and NDVI at each site, fitting nonlinear (exponential) models to the permuted field data, and then predicting regional AGB by combining each nonlinear model with a permutation of the regional NDVI mosaic. The models were fitted using the nonlinear least squares function in R and, after predicting AGB, shrub dominance was computed for each permutation. Lastly, for each of these plant attributes the pixel-wise median, 2.5 percentile, and 97.5 percentiles were computed among the suite of permutations. This yielded both a best estimate (median) and 95% confidence interval (CI) for each plant attribute at 30-m resolution for the North Slope. These CIs incorporated several important sources of uncertainty, but are not a full accounting of potential errors (e.g., atmospheric correction) and thus are a conservative estimate of uncertainty.
Data Access
These data are available through the Oak Ridge National Laboratory (ORNL) Distributed Active Archive Center (DAAC).
ABoVE: Gridded 30-m Aboveground Biomass, Shrub Dominance, North Slope, AK, 2007-2016
Contact for Data Center Access Information:
- E-mail: uso@daac.ornl.gov
- Telephone: +1 (865) 241-3952
References
Logan T. Berner, Patrick Jantz, Ken D. Tape, and Scott J. Goetz. 2018. Tundra plant aboveground biomass and shrub dominance mapped across the North Slope of Alaska. Environmental Research Letters. https://doi.org/10.1088/1748-9326/aaaa9a
Berner, L.T., B.E. Law, A.J. Meddens, and J.A. Hicke. (2017). Tree mortality from fires, bark beetles, and timber harvest during a hot and dry decade in the western United States (2003–2012). Environmental Research Letters, 12, 065005. https://doi.org/10.1088/1748-9326/aa6f94
Copass, C., A.D. McGuire, J. Beringer, and E. Edwards. 2007a. Ivotuk Aboveground BIomass Measurements (Excel) version 1.0 UCAR/NCAR - Earth Observing Laboratory. https://dx.doi.org/10.5065/D6B56GV1. Accessed June 12, 2017.
Copass, C., A.D. McGuire, and D.A. Walker. 2007b Council Biomass Data (Excel) version 1.0 UCAR/NCAR - Earth Observing Laboratory. https://dx.doi.org/10.5065/D62R3PVR. Accessed June 12, 2017.
Harmon, M.E., D.L. Phillips, J. Battles, A. Rassweiler, R. Hall, and W. Lauenroth. (2007). Principles and Standards for Measuring Net Primary Production in Long-Term Ecological Studies, ed T. Fahey and A. Knapp (Oxford: Oxford University Press) pp 238-60.
Markham, B.L. and D.L. Helder. (2012) Forty-year calibrated record of earth-reflected radiance from Landsat: A review Remote Sensing of Environment, 122, 30-40. https://doi.org/10.1016/j.rse.2011.06.026
Raynolds, M. K., J.C. Comiso, D.A. Walker, and D. Verbyla. 2008. Relationship between satellite-derived land surface temperatures, arctic vegetation types, and NDVI. Remote Sensing of Environment. 112,1884-94. https://doi.org/10.1016/j.rse.2007.09.008
Raynolds, M. K., C.R.Martin, D.A. Walker, A. Moody, D. Wirth, and C.Thayer-Snyder. 2002. ATLAS Vegetation Studies: Seward Peninsula, Alaska, 2000. ARCSS-ATLAS-AGC Data Report. Alaska Geobotanty Center, Institute of Arctic Biology, University of Alaska Fairbanks, 126 pages.
Vankoughnet, M.R. and P. Grogan. 2016. Plant production and nitrogen accumulation above- and belowground in low and tall birch tundra communities: the influence of snow and litter. Plant and Soil, 408, 195-210. https://doi.org/10.1007/s11104-016-2921-2
Walker, D., H. Epstein, G. Jia, A. Balser , C. Copass, E. Edwards, W. Gould, J. Hollingsworth, J. Knudson, and H. Maier. 2003. Phytomass, LAI, and NDVI in northern Alaska: relationships to summer warmth, soil pH, plant functional types, and extrapolation to the circumpolar Arctic. Journal of Geophysical Research, 108, 8169. https://doi.org/10.1029/2001JD000986
Walker D.A., H.E. Epstein, M.K. Raynolds, P. Kuss, M.A. Kopecky, G.V. Frost, F.J.A. Daniëls, M.O. Leibman, N.G. Moskalenk, G.V. Matyshak, O.V. Khitun, A.V. Khomutov B.C. Forbes, U.S. Bhatt, A.N. Kade, C.M. Vonlanthen, and L. Tichý. 2012. Environment, vegetation and greenness (NDVI) along the North America and Eurasia Arctic transects. Environmental Research Letters, 7, 015504. https://doi.org/10.1088/1748-9326/7/1/015504