Documentation Revision Date: 2025-05-30
Dataset Version: 1.0
Summary
The spatial domain was intended to match the MODIS Alaska Snow Metrics (Lindsay et al., 2015) and extend its temporal fidelity beyond the MODIS era.
The dataset includes 37 files in GeoTIFF (*.tif) format—one data file for every year of the 36-year record and a fractional water mask (applies to the 1988-2016 data only).
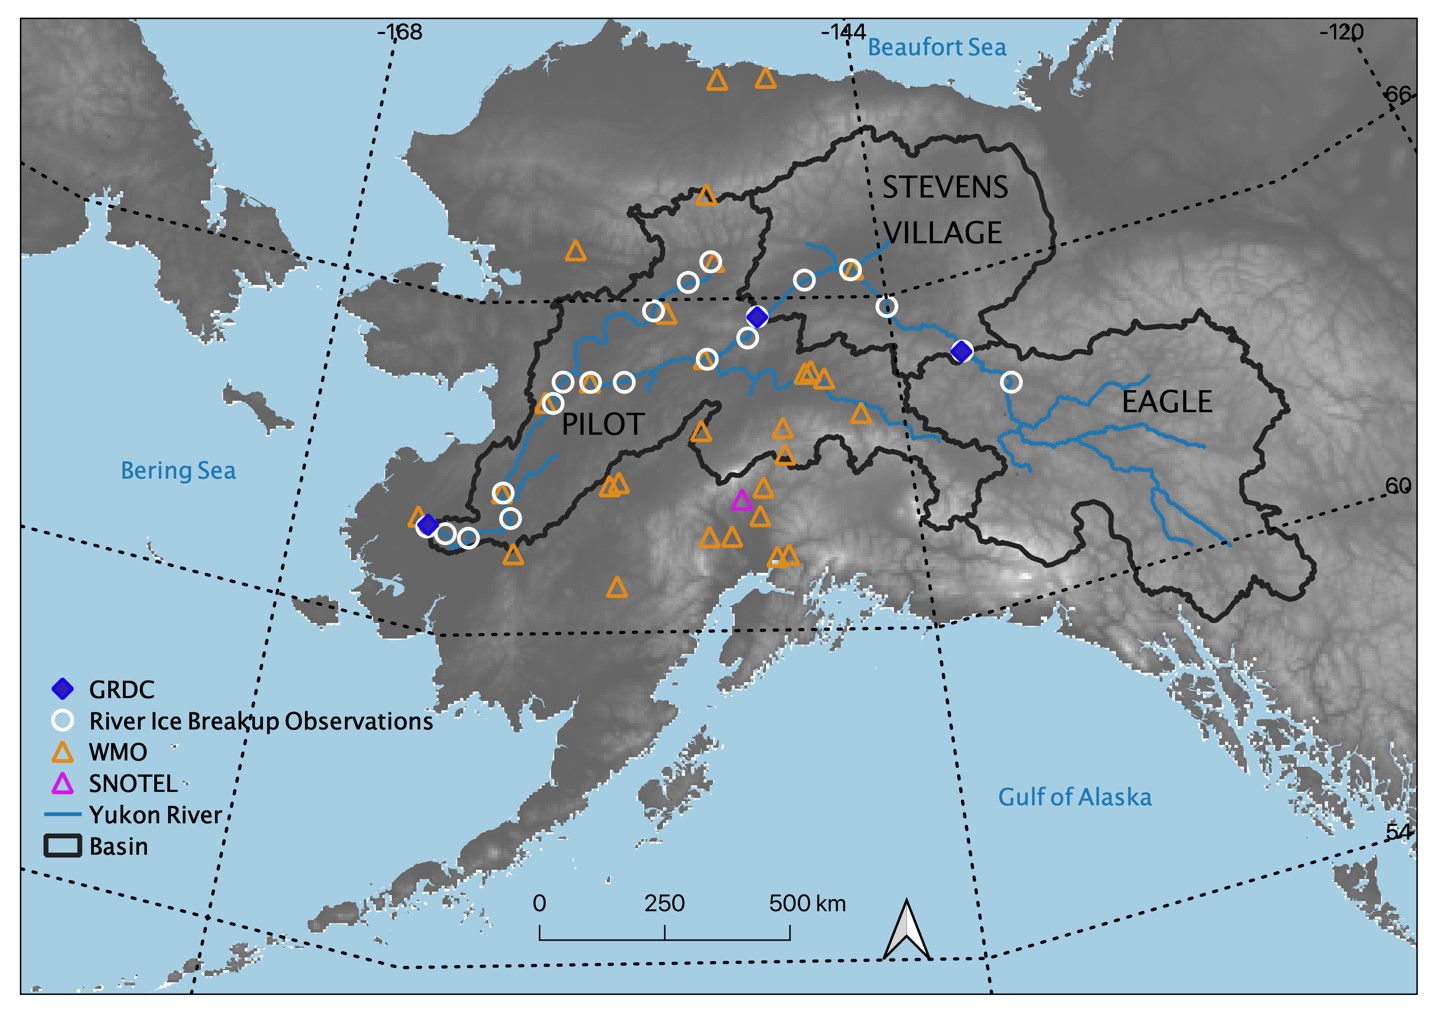
Figure 1. Spatial extent of snowpack main melt onset dataset (MMOD) extending from the Russian Far East across Alaska into Canada's Northwest Territories and British Columbia. The map also includes the GRDC river gauging locations (blue diamonds) used at Eagle, Stevens Village, and Pilot basins (black outlines). Locations of river ice breakup observations (white circles), the World Meteorological Organization (WMO) stations (orange triangles), and SNOw TELemetry network (SNOTEL) stations (purple triangles) are shown. Source: Pan et al. (2021).
Citation
Pan, C.G., P.B. Kirchner, J.S. Kimball, and J. Du. 2021. ABoVE: Passive Microwave-derived Annual Snowpack Main Melt Onset Date Maps, 1988-2023. ORNL DAAC, Oak Ridge, Tennessee, USA. https://doi.org/10.3334/ORNLDAAC/1841
Table of Contents
- Dataset Overview
- Data Characteristics
- Application and Derivation
- Quality Assessment
- Data Acquisition, Materials, and Methods
- Data Access
- References
- Dataset Revisions
Dataset Overview
This dataset provides the annual date of snowpack seasonal beginning melt (i.e., main melt onset date, MMOD) across northwest Canada; Alaska, U.S., and parts of far eastern Russia at 6.25-km resolution for the period 1988–2023. MMOD was derived from the daily 19V (K-band) and 37V (Ka-band) GHz bands from the Making Earth Science Data Records for Use in Research Environments (MEaSUREs) Calibrated Enhanced-Resolution Passive Microwave (PMW) EASE-Grid Brightness Temperature (Tb) Earth System Data Record (ESDR). The PMW MMOD dataset was validated using the transition date from Freeze Degree Days (FDD) to Thaw Degree Days (TDD) from in situ air temperature observations from 31 SNOw TELemetry network (SNOTEL) observations, and compared to the established Freeze-Thaw ESDR (FT-ESDR) spring onset date. The resulting MMOD data record is suitable for documenting the spatial-temporal impacts of MMOD variability in ecosystem services, wildlife movements, and hydrologic processes across the ABoVE domain.
The spatial domain was intended to match the MODIS Alaska Snow Metrics (Lindsay et al., 2015) and extend its temporal fidelity beyond the MODIS era.
Project: Arctic-Boreal Vulnerability Experiment
The Arctic-Boreal Vulnerability Experiment (ABoVE) is a NASA Terrestrial Ecology Program field campaign being conducted in Alaska and western Canada, for 8 to 10 years, starting in 2015. Research for ABoVE links field-based, process-level studies with geospatial data products derived from airborne and satellite sensors, providing a foundation for improving the analysis, and modeling capabilities needed to understand and predict ecosystem responses to, and societal implications of, climate change in the Arctic and Boreal regions.
Related Publications
Pan, C.G., P.B. Kirchner, J.S. Kimball, and J. Du. 2020. A long-term passive microwave snowoff record for the Alaska region 1988-2016. Remote Sensing 12(1):153. https://doi.org/10.3390/rs12010153
Pan, C.G., P.B. Kirchner, J.S. Kimball, and J. Du. 2021. Snow phenology and hydrologic timing in the Yukon River Basin, AK, USA. Remote Sens,2021,13,2284. https://doi.org/10.3390/rs13122284
Related Datasets
Du, J., J.S. Kimball, and J.D. Watts. 2016. ABoVE: Fractional Open Water Cover for Pan-Arctic and ABoVE-Domain Regions, 2002-2015. ORNL DAAC, Oak Ridge, Tennessee, USA. https://doi.org/10.3334/ORNLDAAC/1362
Loboda, T.V., E.E. Hoy, and M.L. Carroll. 2019. ABoVE: Study Domain and Standard Reference Grids, Version 2. ORNL DAAC, Oak Ridge, Tennessee, USA. https://doi.org/10.3334/ORNLDAAC/1527
Pan, C.G., P.B. Kirchner, J.S. Kimball, Y. Kim, and J. Du. 2018. ABoVE: Rain-on-Snow Frequency and Distribution during Cold Seasons, Alaska, 2003-2016. ORNL DAAC, Oak Ridge, Tennessee, USA. https://doi.org/10.3334/ORNLDAAC/1611
Pan, C.G., P.B. Kirchner, J. Du, and J.S. Kimball. 2019. ABoVE: Passive Microwave-derived Annual Snowoff Date Maps, 1988-2018. ORNL DAAC, Oak Ridge, Tennessee, USA. https://doi.org/10.3334/ORNLDAAC/1711
Pan, C.G., P.B. Kirchner, J.S. Kimball, and J. Du. 2021. ABoVE: Passive Microwave-derived Annual Snow Melt Duration Date Maps, 1988-2018. ORNL DAAC, Oak Ridge, Tennessee, USA. https://doi.org/10.3334/ORNLDAAC/1843
Verbyla, D. 2017. ABoVE: Last Day of Spring Snow, Alaska, USA, and Yukon Territory, Canada, 2000-2016. ORNL DAAC, Oak Ridge, Tennessee, USA. https://doi.org/10.3334/ORNLDAAC/1528
Acknowledgments
This project received support from NASA’s Arctic Boreal Vulnerability Experiment (Grant NNX15AT74A; 80NSSC22K1238) and the National Park Service, Southwest Alaska Inventory and Monitoring Network (P23AC01622-00).
Data Characteristics
Spatial Coverage: Northwest Canada; Alaska, U.S.; and far eastern Russia
ABoVE Reference Locations
Domain: Core ABoVE
Grid cells: Ah000-001v000-001
Spatial Resolution: Approximately 6.25 km
Temporal Coverage: 1988-02-09 to 2023-07-20
Temporal Resolution: Annual
Site Boundaries: Latitude and longitude are given in decimal degrees.
| Site | Westernmost Longitude | Easternmost Longitude | Northernmost Latitude | Southernmost Latitude |
|---|---|---|---|---|
| Northwest Canada, Alaska, and far eastern Russia | -180 | -107.83 | 72.41 | 51.61 |
User Note: This dataset extends from Canada westward across the 180-degree anti-meridian into eastern Russia.
Data File Information
This dataset includes 37 files in GeoTIFF (*.tif) format. The data from 1988-2016 included a coastal mask removing coastal pixels due to potential water contamination from coarse brightness temperature observations (Dersken et al., 2012). There is not a coastal mask for the 2017-2023 data. The full data are included, and data users should be aware that coastal values can be adversely affected by adjacent water bodies.
Most files use the naming convention ABoVE.MMOD.YYYYAh000-001v000-001.001.tif,
where
- ABoVE.MMOD is the annual estimated main melt onset date for this ABoVE dataset,
- YYYY is the year of observation,
- Ah000-001v000-001 is the ABoVE reference grid, and
- .001 is the data product version.
Table 1. File names and descriptions.
| File Name | Units | Description |
|---|---|---|
| ABoVE.MMOD.YYYYAh000-001v000-001.001.tif | day of year |
36 files providing the main melt onset date (MMOD), one for each year for the period 1988–2023. Cell values indicate the day of the year (range 40–202) when the MMOD was observed. The no data value is -9999. |
| FW_mask_melt_onset.tif | percent | The percent of the grid cell covered by surface water provided because high levels of or high seasonal variability in fractional water influenced the MMOD detection algorithm. The no data value is -999. |
Data File Details
For all GeoTIFF files, the CRS is EPSG:102001 (i.e., standard ABoVE projection).
Application and Derivation
The main snowmelt onset date (MMOD) influences local and regional ecosystem services, wildlife movements, and hydrologic processes, such as streamflow, flooding, and river ice break up. The timing and pattern of snowmelt have important impacts on the economies of Alaskan and Canadian human communities. This dataset documents variability in MMOD across space and the 29-year study period.
Quality Assessment
The Passive Microwave (PMW) MMOD dataset was validated using meteorological, field, and satellite observations. The MMOD estimates were compared to the transition date from Freeze Degree Days (FDD) to Thaw Degree Days (TDD) derived from average daily air temperatures from World Meteorological Organization (WMO) weather stations (www.ncdc.noaa.gov) and to observations from Alaska’s SNOw TELemetry network (SNOTEL; www.nrcs.usda.gov/wps/portal/nrcs/ak/snow/). Estimates were also compared against the Freeze-Thaw Earth System Data Record (FT-ESDR; www.ntsg.umt.edu/freeze-thaw/) spring onset dates from the corresponding years. Across Alaskan climate regions, correlations between MMOD estimates and FDD-TDD transition dates ranged from 0.42–0.63. Mean absolute error (MAE) values varied 9–18 days and were influenced by forest cover. Spatially, the PMW MMOD data record compared well with the FT-ESDR; however, the mean MMOD was 114 which is 9 days ahead of the mean FT-ESDR spring onset. Overall, the uncertainty in the MMOD estimates was +/- 15 days (Pan et al., 2021).
Data Acquisition, Materials, and Methods
MMODs were estimated for the years 1988–2023 for Alaska, northwest Canada, and far eastern Russia using imagery from satellite-based passive microwave (PMR) sensors. Daily images in 19 GHz and 37 GHz wavelengths with horizontal and vertical polarizations were obtained from the Making Earth Science Data Records for Use in Research Environments (MEaSUREs) Calibrated Enhanced-Resolution Passive Microwave Daily EASE-Grid 2.0 Brightness Temperature ESDR, available at the National Snow and Ice Data Center (NSIDC; https://nsidc.org/pmesdr/) (Brodzik et al. 2016). Scatterometer image reconstruction (SIR) was used to improve the resolution of the PMR images to 6.25 km (19 GHz) and 3.125 km (37 GHz) (Long and Brodzik, 2016). Grid cells with missing data were filled using linear interpolation.
The PMW MMOD estimation algorithm used gradient ratio polarization (GRP) at 19 GHz and 37 GHz for each grid cell (Pan et al., 2018). GRP remains around 1.0 (unitless) during dry snow conditions and moves below 1.0 as the snow begins to melt. GRP then decreases rapidly to negative values during main melt conditions before increasing to just below 0.0 during the summer. The algorithm captured the date just before the GRP begins to descend below zero, and MMOD was identified when GRP crossed a cell-specific threshold value. For each grid cell, the 4-day running mean GRP (rm) was compared to the winter average GRP (win) for that cell to compute a change parameter (param): param = win - rm. MMOD was identified as the day that param exceeds a threshold value in the range of 0.2–0.6. Preliminary analysis found that the running mean of GRP was affected by surface water features, so threshold values of param were adjusted based on the percent of surface water (i.e., fractional surface water) in each grid cell. Lower param values were used for cells with >39% of fractional surface water (Pan et al., 2021).
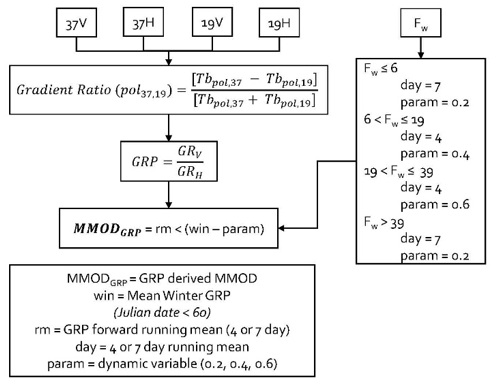
Figure 2. PMW MMOD gradient ratio polarization (GRP) derivation. Source: Pan et al., 2021
Data Access
These data are available through the Oak Ridge National Laboratory (ORNL) Distributed Active Archive Center (DAAC).
ABoVE: Passive Microwave-derived Annual Snowpack Main Melt Onset Date Maps, 1988-2023
Contact for Data Center Access Information:
- E-mail: uso@daac.ornl.gov
- Telephone: +1 (865) 241-3952
References
Brodzik, M.J., D.G. Long, M.A. Hardman, A. Paget, and R. Armstrong. 2016, Updated 2020. MEaSUREs Calibrated Enhanced-Resolution Passive Microwave Daily EASE-Grid 2.0 Brightness Temperature ESDR, Version 1. Boulder, Colorado USA. NASA National Snow and Ice Data Center Distributed Active Archive Center. https://doi.org/10.5067/MEASURES/CRYOSPHERE/NSIDC-0630.001
Du, J., J.S. Kimball, and J.D. Watts. 2016. ABoVE: Fractional Open Water Cover for Pan-Arctic and ABoVE-Domain Regions, 2002-2015. ORNL DAAC, Oak Ridge, Tennessee, USA. https://doi.org/10.3334/ORNLDAAC/1362
Lindsay, C., J. Zhu, A.E. Miller, P. Kirchner, and T.L. Wilson. 2015. Deriving snow cover metrics for Alaska from MODIS. Remote Sensing 7:12961–12985. https://doi.org/10.3390/rs71012961
Loboda, T.V., E.E. Hoy, and M.L. Carroll. 2019. ABoVE: Study Domain and Standard Reference Grids, Version 2. ORNL DAAC, Oak Ridge, Tennessee, USA. https://doi.org/10.3334/ORNLDAAC/1527
Long, D.G., and M.J. Brodzik. 2016. Optimum image formation for spaceborne microwave radiometer products. IEEE Transactions on Geoscience and Remote Sensing 54(5):2763–2779. https://doi.org/10.1109/TGRS.2015.2505677
Pan, C.G., P.B. Kirchner, J.S. Kimball, and J. Du. 2020. A long-term passive microwave snowoff record for the Alaska region 1988-2016. Remote Sensing 12(1):153. https://doi.org/10.3390/rs12010153
Pan, C.G., P. Kirchner, J.S. Kimball, Y. Kim, and J. Du. 2018. Rain-on-snow events in Alaska, their frequency and distribution from satellite observations. Environmental Research Letters 13:075004. https://doi.org/10.1088/1748-9326/aac9d3
Pan, C.G., P.B. Kirchner, J.S. Kimball, Y. Kim, and J. Du. 2018. ABoVE: Rain-on-Snow Frequency and Distribution during Cold Seasons, Alaska, 2003-2016. ORNL DAAC, Oak Ridge, Tennessee, USA. https://doi.org/10.3334/ORNLDAAC/1611
Pan, C.G., P.B. Kirchner, J. Du, and J.S. Kimball. 2019. ABoVE: Passive Microwave-derived Annual Snowoff Date Maps, 1988-2018. ORNL DAAC, Oak Ridge, Tennessee, USA. https://doi.org/10.3334/ORNLDAAC/1711
Pan, C.G., P.B. Kirchner, J.S. Kimball, and J. Du. 2021. Snow phenology and hydrologic timing in the Yukon River Basin, AK, USA. Remote Sens, 2021,13,2284. https://doi.org/10.3390/rs13122284
Pan, C.G., P.B. Kirchner, J.S. Kimball, and J. Du. 2021. ABoVE: Passive Microwave-derived Annual Snow Melt Duration Date Maps, 1988-2018. ORNL DAAC, Oak Ridge, Tennessee, USA. https://doi.org/10.3334/ORNLDAAC/1843
Verbyla, D. 2017. ABoVE: Last Day of Spring Snow, Alaska, USA, and Yukon Territory, Canada, 2000-2016. ORNL DAAC, Oak Ridge, Tennessee, USA. https://doi.org/10.3334/ORNLDAAC/1528
Dataset Revisions
| Product Version | Release Date | Revision Notes |
| 1.0 | 2025-04-16 | Data for 2019-2023 were added. A coastal mask removing coastal pixels due to potential water contamination from coarse brightness temperature observations is not included for these years. It is recommended that data users be aware that coastal values can be adversely affected by adjacent water bodies. |
| 1.0 | 2022-02-28 | Data for 2017-2018 were added. A coastal mask removing coastal pixels due to potential water contamination from coarse brightness temperature observations is not included for these years. It is recommended that data users be aware that coastal values can be adversely affected by adjacent water bodies. |
| 1.0 | 2021-04-30 | Data for 1988-2016 and ncludes a coastal mask removing coastal pixels due to potential water contamination from coarse brightness temperature observations. |